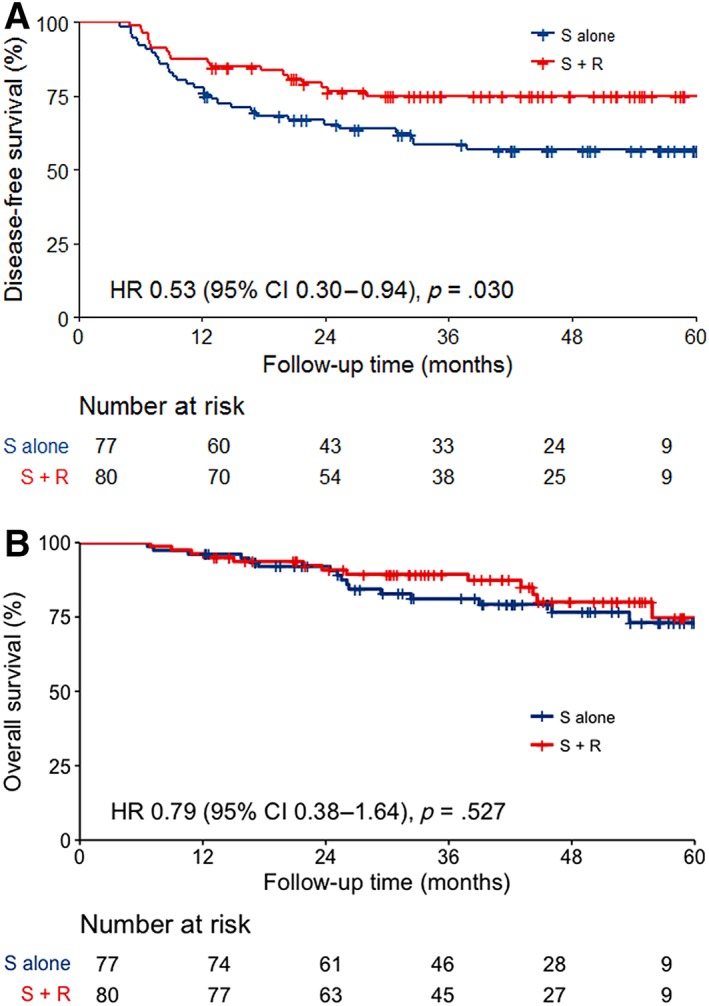
Figure 2.

Survival curves. (A): Disease‐free survival curves for surgery‐alone and postoperative radiotherapy groups. (B): Overall survival curves in surgery‐alone and postoperative radiotherapy groups.Abbreviations: CI, confidence interval; HR, hazard ratio; R, postoperative radiotherapy; S, surgery.
