

Abstract
Background
The objective of this study was to develop and validate a nomogram to predict 1‐year overall survival (OS) and 2‐year OS in patients with high‐grade digestive neuroendocrine neoplasms (NENs) as well as to guide selection of subgroups that could benefit from systemic chemotherapy.
Subjects, Materials, and Methods
We performed a retrospective analysis of 223 patients with NENs of the gut and hepato‐biliary‐pancreatic system from four centers included in the development cohort. The nomogram was externally validated in a cohort of 90 patients from another one.
Results
The final model included lactate dehydrogenase, performance status, stage, Ki67, and site of primary tumor, all of which had a significant effect on OS. The uncorrected C‐index was 0.761 for OS, and the bias‐corrected C‐index was 0.744. Predictions correlated well with observed 1‐year and 2‐year outcomes (judged by eye). The area under the time‐dependent receiver operating characteristic curve at 12 months and 24 months was 0.876 and 0.838, respectively. The nomogram performed well in terms of both discrimination and calibration when applied to the validation cohort, and OS was significantly different between the two groups classified by nomogram score (log‐rank p < .001).
Conclusion
The validated nomogram provided useful prediction of OS, which can be offered for clinicians to improve their abilities to assess patient prognosis, to create clinical risk groups for informing treatment or for patient stratification by disease severity in clinical trials.
Implications for Practice
The high‐grade neuroendocrine neoplasms of the digestive system are rare malignancies with great heterogeneity. An overall survival nomogram was developed and externally validated in this study. Two subgroups were classified by the nomogram score, and platinum‐based chemotherapy may not bring clinical benefit for the low‐risk patients.
Keywords: Neuroendocrine neoplasm, Digestive system, High grade, Development and validation, Prognostic nomogram
Short abstract
This study aimed to develop and validate a nomogram for prediction of overall survival for patients with high‐grade neuroendocrine neoplasms of the digestive system.
Introduction
Neuroendocrine neoplasms (NENs) are rare malignancies with great heterogeneity 1. Although they are found throughout the body in all organs, approximately three quarters of NENs originate from the gastrointestinal tract and hepato‐biliary‐pancreatic system 2. According to the World Health Organization/European Neuroendocrine Tumor Society guidelines, NENs are classified based upon both tumor morphology and markers of proliferation in the latter, including the Ki67 and/or mitotic index, and malignancies with a Ki67 index greater than 20% are considered high‐grade NENs (G3) 3, 4, 5.
NENs‐G3 were usually treated as one relatively higher malignant subgroup and mostly requires systemic platinum‐based chemotherapy for unresectable and metastatic disease. Emerging evidence indicates that the NENs‐G3 includes a spectrum of different entities that are characterized by different prognosis and response to therapy 6, 7, 8. Recently, a new subgroup of well‐differentiated high‐grade neuroendocrine tumours (NETs‐G3) has been defined 9, 10. Several studies revealed NETs‐G3 presented lower progression rate compared with poorly differentiated high‐grade neuroendocrine carcinomas (NECs‐G3) and seemed to show limited clinical benefit from platinum‐based chemotherapy 11, 12, 13. However, it was reported that the majority of patients with digestive system–originating NENs‐G3 are poorly differentiated. Additionally, there are still controversies on the choice of most suitable Ki67 cutoff for making clinical management decisions 7, 14. It was suggested that a Ki67 cutoff of 55% was informative for choosing between temozolomide‐based or platinum‐based treatment in the Nordic retrospective study 12. However, another study identified a different cutoff (60%) that patients with a Ki‐67 of <60% seemed to respond more often to temozolomide‐based chemotherapy 15.
Moreover, the Ki67 itself is highly influenced by the surrounding tumor microenvironment 7. Accordingly, it is not advisable to distinguish the prognosis of patients with NENs‐G3 or make treatment decisions reliant on only Ki67 and morphology. Other factors such as primary tumor site, clinical characteristics, and molecular alterations should also be considered. Thus, a more informative prognostic assessment tool that simultaneously considers a number of prognostic factors for NENs‐G3 to assess patient prognosis, stratify patient by risk, and guide treatment are urgently warranted.
Previous studies have addressed risk factors of digestive system–originating NENs‐G3 for survival. Among the 305 patients with advanced gastrointestinal neuroendocrine carcinoma in the NORDIC study, four risk factors were significantly associated with poor survival: poor performance status (PS), primary colorectal tumors, elevated platelets, and lactate dehydrogenase (LDH) levels 12. A total of 258 patients with unresectable or recurrent NENs‐G3 of the gastrointestinal tract or hepato‐biliary‐pancreatic system were included in another multivariate analysis, which showed that the primary site and baseline serum LDH levels were independent prognostic factors for overall survival (OS) 16. In another study published in 2017, Lamarca et al. 17 designed a prognostic score including presence of liver metastases, alkaline phosphatase (ALP), LDH, PS, and Ki67 to classify patients with NENs‐G3 from gut and pancreas into two groups with incremental risk. Although the risk model includes factors most influential for survival, it does not account for several known prognostic factors (e.g., primary site, stage) and is limited by its moderate accuracy. Consequently, the survival probabilities in the two risk groups have limited ability to predict survival for an individual patient.
A nomogram is a statistical instrument that accounts for numerous variables to estimate a numeric probability of an event for an individual patient 18. Therefore, the aim of this study was to develop and validate a nomogram for prediction of OS for patients with NENs‐G3 from the digestive system.
Subjects, Materials, and Methods
Study Design and Participants
We developed the nomogram within combined cohorts from four Chinese centers: Wuhan Union Hospital (Wuhan; between January 1, 2011, and June 1, 2018), Fudan University Shanghai Cancer Center (Shanghai; from January 1, 2012, to December 31, 2014), Hubei Cancer Hospital (Wuhan; from January 1, 2009, to December 31, 2016), and Wuhan Tongji Hospital (Wuhan; from January 1, 2012, to June 1, 2017). Clinicopathologic data from 223 patients were retrospectively analyzed to construct and internally validate a clinical prediction model for OS. Eligible patients were those with a histological confirmation of NENs‐G3 (Ki‐67 > 20%) including mixed adenoneuroendocrine carcinoma (MANEC) from the digestive system or an unknown primary in whom the primary tumor was suspected to be of digestive system origin. We excluded patients with PS 4 or missing survival data.
To externally validate the nomogram, a data set consisting of the same baseline and demographic characteristics used in the development cohort was collected by collaborators at one Chinese center from The First Affiliated Hospital, Sun Yat‐sen University (Guangzhou; from June 1, 2003, to September 1, 2018). Inclusion and exclusion criteria were identical to those used in the development cohort. Patients with missing information on any of the predictors in the final risk model were excluded and considered ineligible.
The histologic characteristics of all patients were centrally reviewed by two pathologists. The study was approved by the institutional review boards of the five hospitals mentioned above. Written informed consent was obtained from all the patients for their data to be used for research.
Outcome
The principal outcome of interest included the predicted probability of 1‐year and 2‐year OS on the basis of baseline characteristics. The 1‐year and 2‐year outcomes were chosen because 74.5% of the patients who experienced death did so within 1 years, and 95.5% of the patients within 2 years. OS was defined as the time between first diagnosis of NEN and death (or last follow‐up with no death).
Statistical Analysis
Development of the Nomogram
For the development of the nomogram, we sought outcome indicators (from a search of the published work and based on our clinical experience) that have been considered as affecting outcome and can be easily ascertained in different settings with various clinical expertise. Demographic characteristics together with age, gender, PS (0–1 vs. 2–3), stage (localized, regional, or distant) 2, 17, 19, primary tumor site 16, Ki67, ALP, LDH, and other laboratory markers (including platelets, absolute neutrophil count, absolute lymphocyte count, and derived neutrophil‐to‐lymphocyte ratio [NLR]) at time of first diagnosis were collected for identification of prognostic factors and design of the predictive model. Site of primary tumor was classified as gastrointestinal tract, hepato‐biliary‐pancreatic system, or unknown primary according to clinical information available 16. Baseline biochemical parameters selected for evaluation included lactate dehydrogenase and alkaline phosphatase, and both were quantified as a factor of the upper normal limit (UNL) 20.
Any predictor recorded for <60% of patients in the development data was not included in the modeling process, resulting in the exclusion of tumor morphology and neurone‐specific enolase. To investigate whether exclusions of patients as a result of missing data had introduced any bias, multiple imputation was performed using predictive mean matching to fill in the missing values under the assumption of data missing at random 21, 22. All analyses were done for the complete data and were repeated with an imputed data set (supplemental online Appendix 1).
We estimated overall survival using the Kaplan‐Meier method. The Cox proportional hazards model was used to evaluate independent prognostic factors and estimate their covariate‐adjusted effects on OS. All two‐way interactions were evaluated. A maximum regression model, including all the significant variables in the univariate Cox regression (defined as p values less than an arbitrarily chosen significance level of 10%) and previously defined “variables of interest” (PS, site of primary tumor, and Ki67), was designed. We included a set of predictor variables in the maximum regression model and applied a backward procedure based on the Akaike information criterion (AIC) for variable selection. Variables for inclusion were carefully chosen to ensure parsimony of the final model. The nomogram was developed from the final regression model, which allowed us to obtain survival probability estimates.
Assessing and Comparing Model Performance
We assessed nomogram model performance by examining calibration (calibration plots), discrimination (Harrell C index), and overall accuracy (Brier score) 23, 24, 25. Final model was internally validated using bootstrap with 1,000 resamples and cross‐validation methods to obtain optimism corrected discrimination via the concordance index for survival data and calibration plots. The area under the time‐dependent receiver operating characteristic curve (AUC) was also measured to compare the accuracy of prediction of survival at 6, 12, and 24 months of the maximum model and the final model.
The validation cohort was used to externally validate the model 26. A total risk score was calculated for each patient in the whole cohorts, based on the points given for each factor in the nomogram. The patients were classified into two groups according to low and high risk (recursive partitioning analysis was used for classification development). The Kaplan‐Meier method and log‐rank were used to compare whether the survival distributions differed between the two risk groups. Subgroup analysis was used to compare the effect of chemotherapy on OS for the two groups.
All statistical tests were two tailed, with the significance level set to .05. Statistical analyses were performed using SPSS version 22.0 (IBM Corporation, Chicago, IL) and R version 3.5.1 (The R Foundation, Vienna, Austria). The packages in R that were used in this study are reported in supplemental online Appendix 1.
Results
Participants
A total of 172 of 223 patients with digestive system–derived NEN‐G3 made up the development cohort after excluding 51 patients with missing data on Ki67 or LDH (supplemental online Fig. 1). Table 1 listed the baseline characteristics of this development cohort. A total of 89 deaths occurred during follow‐up. The estimated median OS was 13.0 months.
Table 1.
Characteristics of the study population
| Characteristics | Training cohort with missing data (n = 223) | Training cohort with complete data (n = 172) | External validation cohort (n = 90) |
|---|---|---|---|
| Age, years | |||
| Median (IQR) | 60.0 (52.0–66.0) | 60.0 (51.0–66.0) | 59.0 (48.3–64.0) |
| Gender | |||
| Female | 76 (34.1) | 57 (33.1) | 31 (34.4) |
| Male | 147 (65.9) | 115 (66.9) | 59 (65.6) |
| Performance status | |||
| 0–1 | 195 (87.4) | 145 (84.3) | 90 (100) |
| 2–3 | 28 (12.6) | 27 (15.7) | 0 (0) |
| Stage | |||
| Localized | 24 (10.8) | 15 (8.7) | 12 (13.3) |
| Regional | 88 (39.5) | 66 (38.4) | 28 (31.1) |
| Distant | 111 (49.8) | 91 (52.9) | 50 (55.6) |
| Presence of liver metastases, yesa | 81 (73.0) | 72 (79.1) | 39 (78.0) |
| Site of primary tumor | |||
| Gastrointestinal tract | 128 (57.3) | 96 (55.8) | 68 (75.6) |
| Esophagus | 19 (8.5) | 10 (5.8) | 1 (1.1) |
| Stomach | 65 (29.1) | 49 (28.5) | 29 (32.2) |
| Small intestine | 8 (3.4) | 4 (2.3) | 14 (15.6) |
| Colon | 16 (7.2) | 14 (8.1) | 15 (16.7) |
| Rectum | 20 (9.0) | 19 (11.0) | 9 (10.0) |
| Hepato‐biliary‐pancreatic system | 83 (37.3) | 68 (39.5) | 21 (23.3) |
| Pancreas | 49 (22.0) | 45 (26.2) | 16 (17.8) |
| Liver | 14 (6.3) | 11 (6.4) | 1 (1.1) |
| Gallbladder | 20 (9.0) | 12 (7.0) | 4 (4.4) |
| Unknown primary | 12 (5.4) | 8 (4.7) | 1 (1.1) |
| Ki67 | |||
| Median (IQR) | 0.70 (0.50–0.80) | 0.70 (0.500–0.80) | 0.75 (0.60–0.90) |
| Missing | 18 (8.1) | 0 (0) | 0 (0) |
| MANEC, yes | 27 (12.1) | 19 (11.0) | 9 (10) |
| Tumor morphology | |||
| Poorly differentiated | 127 (57.0) | 96 (55.8) | 71 (78.9) |
| Moderately differentiated | 3 (1.3) | 1 (0.6) | 1 (1.1) |
| Well differentiated | 1 (0.4) | 1 (0.6) | 18 (20.0) |
| NR | 92 (41.3) | 74 (43.0) | 0 (0) |
| Neutrophil‐to‐lymphocyte ratio | |||
| Median (IQR) | 2.82 (2.08–4.19) | 2.84 (2.16–4.16) | 2.74 (1.86–4.63) |
| Missing | 8 (3.6) | 0 (0) | 0 (0) |
| Platelet, 109/L | |||
| Median (IQR) | 220 (167–273) | 215 (167–274) | 240 (183–316) |
| Missing | 8 (3.6) | 2 (1.2) | 0 (0) |
| Alkaline phosphatase, UNL | |||
| Median (IQR) | 0.50 (0.40–0.90) | 0.60 (0.40–0.90) | 0.600 (0.400–0.900) |
| Missing | 6 (2.7) | 0 (0) | 0 (0) |
| Lactate dehydrogenase, UNL | |||
| Median (IQR) | 0.90 (0.80–1.45) | 0.90 (0.78–1.50) | 1.00 (0.800–1.48) |
| Missing | 44 (19.7) | 0 (0) | 0 (0) |
| Treatment | |||
| RS | 44 (19.7) | 38 (22.1) | 19 (21.1) |
| RS + AC | 45 (20.2) | 35 (20.3) | 20 (22.2) |
| PaS or other LT + CT | 33 (14.8) | 26 (15.1) | 13 (14.4) |
| CT | 38 (17.0) | 32 (18.6) | 29 (32.2) |
| PaS or other LT | 16 (7.2) | 18 (10.5) | 4 (4.4) |
| BSC or NR | 47 (21.1) | 24 (14.0) | 5 (5.6) |
| First‐line CTb | |||
| Platinum‐containing CT | 56 (78.9) | 44 (75.9) | 34 (81.0) |
| Nonplatinum‐containing CT | 15 (21.1) | 14 (24.1) | 8 (19.0) |
| ACc | |||
| Platinum‐containing CT | 35 (77.8) | 27 (77.1) | 19 (95) |
| Nonplatinum‐containing CT | 10 (22.2) | 8 (22.9) | 1 (5) |
| Status, dead | 110 (49.3) | 89 (51.7) | 33 (36.7) |
| Follow‐up, months | |||
| Median (IQR) | 7.00 (2.00–18.0) | 6.00 (2.00–16.3) | 11.0 (4.00–20.8) |
| Median (minimum to maximum) | 7.00 (0.00–63.0) | 6.00 (0.50–63.0) | 11.0 (0.00–134) |
| Overall survival, months | |||
| Median (95% CI) | 16.0 (11.4–20.6) | 13.0 (8.6–17.4) | 28 (16.9–39.2) |
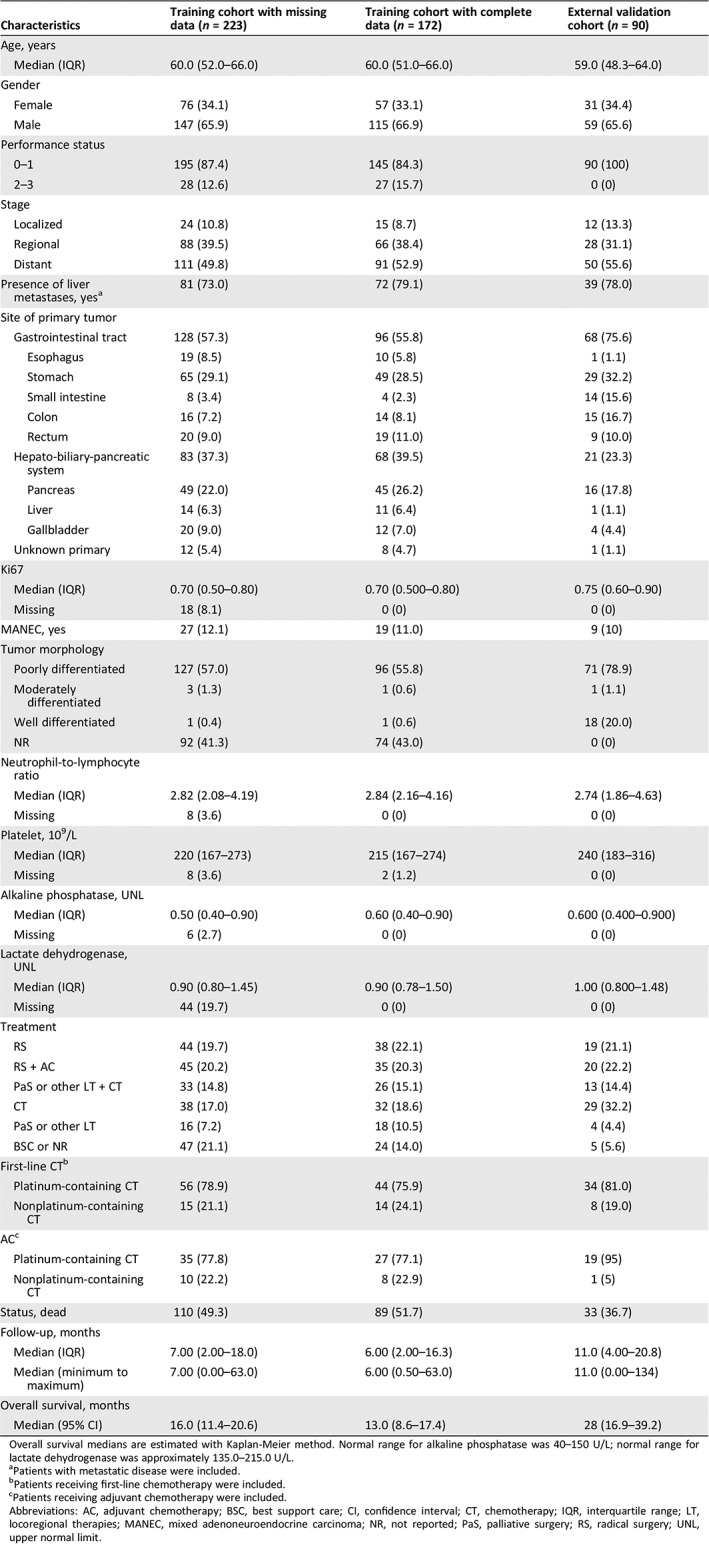
Overall survival medians are estimated with Kaplan‐Meier method. Normal range for alkaline phosphatase was 40–150 U/L; normal range for lactate dehydrogenase was approximately 135.0–215.0 U/L.
Patients with metastatic disease were included.
Patients receiving first‐line chemotherapy were included.
Patients receiving adjuvant chemotherapy were included.
Abbreviations: AC, adjuvant chemotherapy; BSC, best support care; CI, confidence interval; CT, chemotherapy; IQR, interquartile range; LT, locoregional therapies; MANEC, mixed adenoneuroendocrine carcinoma; NR, not reported; PaS, palliative surgery; RS, radical surgery; UNL, upper normal limit.
Development of Nomogram for OS
In addition to Ki67 (p = .138), which was previously defined as “variables of interest,” the following variables were found to be prognostic for OS in univariate Cox regression analysis (supplemental online Table 1): NLR (p < .001), ALP (p = .011), LDH (p < .001), PS (p < .001 for PS 2–3 compared with PS 0–1), stage (p < .001 for metastatic stage compared with localized stage), presence of liver metastases (p < .001), and site of primary tumor (compared with the NENs from gastrointestinal tract, p < .001 for hepato‐biliary‐pancreatic system, p = .749 for unknown primary). All these variables were included in the maximum multivariable regression model (supplemental online Table 1). The AIC‐backward selection procedure led us to exclude ALP, NLR, and presence of liver metastases from the covariates set, and therefore, Ki67, PS, LDH, stage, and site of primary tumor were included in the final model (Table 2) to develop the nomogram for OS, which were independently associated with OS. The nomogram can be used to predict the probability of a patient death due to any cause at 1 year or 2 years (Fig. 1). The nomogram is a graphic depiction of the model, and how to use the nomograms is described in the figure legends. The nomogram scoring system (supplemental online Table 2) can be used to calculate overall survival predictions more accurately than drawing lines on the nomogram. The uncorrected concordance index was 0.761 (95% confidence interval [CI], 0.690–0.832) for OS, and the bias‐corrected C‐index generated by bootstrap validations with 1,000 resamples was 0.744. Figure 2A, 2B shows the calibration plots for the internal cross‐validation at 1 year and 2 years, and both of them closely approximated the observed estimates. The AUC for the 1‐year and 2‐year OS was 0.876 (95% CI, 0.809–0.943) and 0.838 (95% CI, 0.760–0.916), respectively.
Table 2.
Overall survival model for nomogram
| Estimate | p value | |
|---|---|---|
| Ki.67, continuous variable | 1.69843 | .004 |
| Performance status | ||
| 0‐1 | Reference | Reference |
| ≥2 | 0.99783 | <.001 |
| Stage | ||
| Localized | Reference | Reference |
| Regional | 1.08671 | .145 |
| Distant | 2.00423 | .007 |
| Site of primary tumor | ||
| Gastrointestinal tract | Reference | Reference |
| Hepato‐biliary‐pancreatic system | 0.56732 | .028 |
| Unknown primary | −0.40246 | .468 |
| Lactate dehydrogenase (UNL), continuous variable | 0.13607 | <.001 |
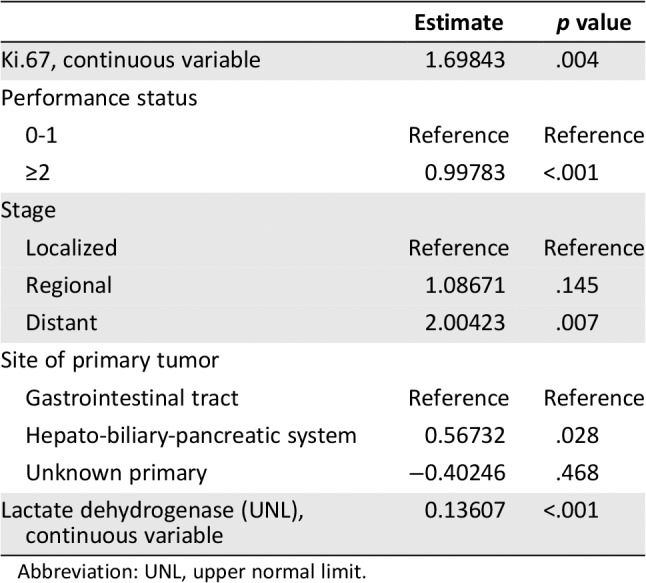
Abbreviation: UNL, upper normal limit.
Figure 1.
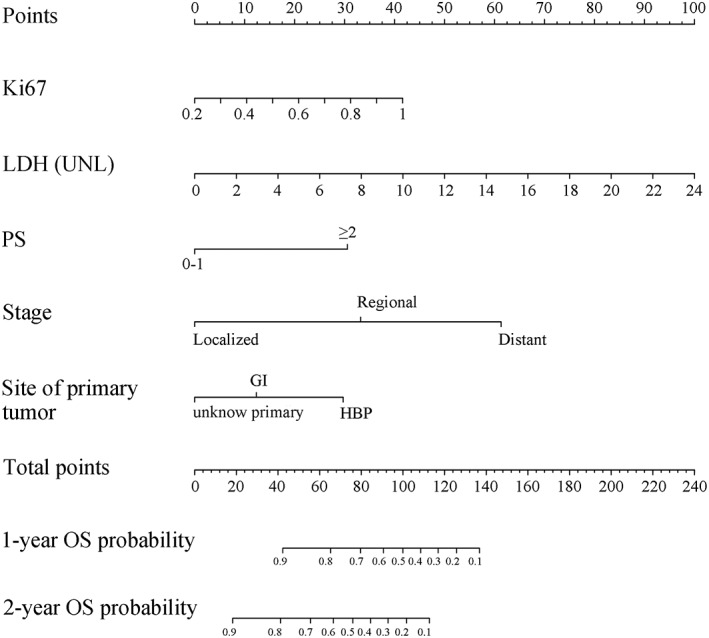
Nomogram for predicting probability of OS at 1 and 2 years for high‐grade neuroendocrine neoplasms of the digestive system. To use, locate the patient's Ki67 and draw a line straight up to the point's axis to establish the score associated with a Ki67. Do this again for the other four covariates (lactate dehydrogenase, performance status, stage, site of primary tumor), each time drawing a straight line upward toward the point's axis. Add the scores for each covariate together and locate the total score on the total point's axis. Draw a straight line down to survival‐probability axis to find patient's probability of 1‐year and 2‐year OS. Abbreviations: GI, gastrointestinal tract; HBP, hepato‐biliary‐pancreatic system; LDH, lactate dehydrogenase; OS, overall survival; PS, performance status; UNL, upper normal limit.
Figure 2.
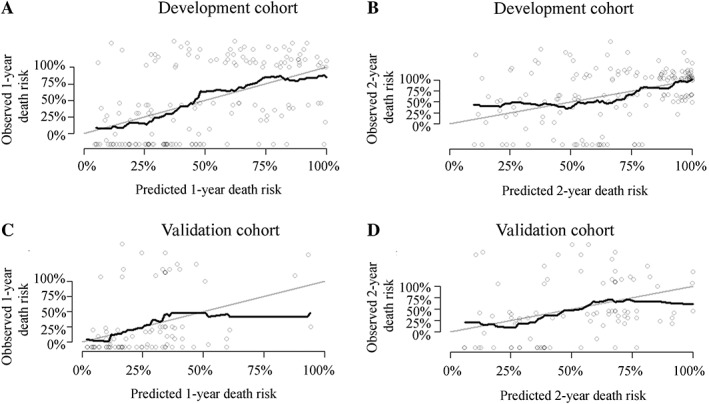
Calibration curves for the overall survival nomogram model. Calibration curves for internally cross validation at 1 year (A) and 2 years (B). Calibration curves for external validation at 1 year (C) and 2 years (D).
There was better accuracy for estimation of risk of survival at 6, 12, and 24 months when compared with the maximum regression model for the final model (supplemental online Fig. 2A, 2B).
External Validation of the Nomogram
The validation cohort included 90 patients in the final analysis (supplemental online Fig. 1); baseline characteristics are shown in Table 1. Median follow‐up time for the cohort was about 11 months. The median estimated OS was 28 months (95% CI, 16.9–39.2; Table 1).
The nomogram applied to the validation cohort had an uncorrected C‐index of 0.727 (95% CI, 0.612–0.840) and a bootstrap‐corrected C‐index of 0.724 with 1,000 resamples. Figure 2C, 2D shows the calibration plots for the nomogram, in which the predicted probabilities of 1‐year and 2‐year OS are plotted against the observed data. Both closely approximated a 45° line but deviated slightly among individuals with poor survival. The AUC values for the 1‐year and 2‐year OS were 0.812 (95% CI, 0.699–0.934) and 0.823 (95% CI, 0.692–0.955), respectively.
A total risk score was calculated for each patient in the training cohort. The patients were classified into two groups according to low and high risk (group A: 0–100 points, group B: >100 points). Distribution of the prognostic score within the combined whole population is summarized in supplemental online Table 3. The curves between the two groups were apparently separated, with statistically significant differences on OS for the validation cohort and whole cohorts (log‐rank p < .001; Fig. 3A, 3B).
Figure 3.
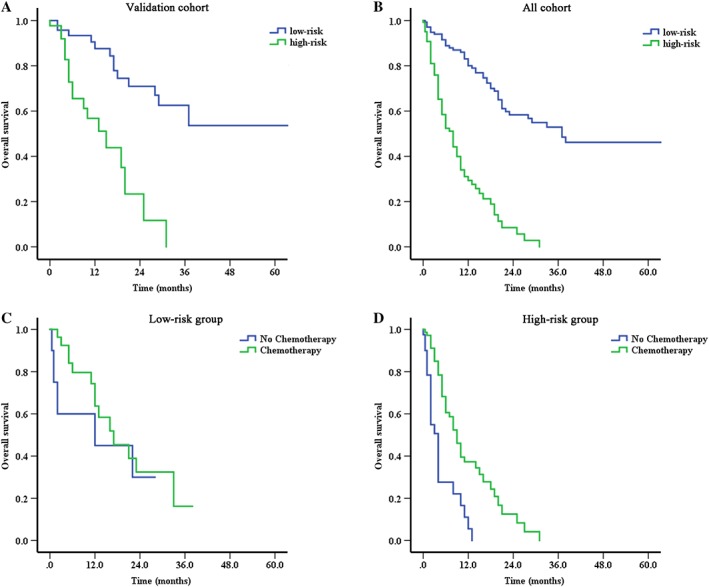
The prognostic risk score defining two populations of patients with significant differences on overall survival. Survival curves for two populations (low‐risk group and high‐risk group) of patients classified by prognostic total score calculated from the nomogram in the validation cohort (A) and all cohorts (B). Survival curves for subgroup analysis to compare the effect of chemotherapy on overall survival between low‐risk group (C, advanced or unresectable patients receiving fist‐line chemotherapy or not) and high‐risk group (D, advanced or unresectable patients receiving fist‐line chemotherapy or not).
The OS Nomogram in the Clinical Practice
The direct application of the nomogram was to classify the patients into two groups with significant differences on OS according to the total risk score (median OS: group A, 37 months and group B, 8 months, p < .001). Further subgroup analysis suggested that chemotherapy may only benefit the patients in the group B.
For the advanced or unresectable patients receiving first‐line chemotherapy or not, the median OS was as follows: 17 months (n = 29, 95% CI, 7.6–24.4 months) versus 12 months (n = 10, 95% CI, 0–36.8 months) in group A (p = .459), 9 months (n = 71, 95% CI, 6.9–11.1 months) versus 4 months (n = 40, 95% CI, 2.9–5.1 months) in group B (p < .001), respectively (Fig. 3C, 3D).
Comparison of Predictive Accuracy for OS Between Current Nomogram and Published Prognostic Model
We compared the performance of the current regression model with that of the previously well‐validated model by Lamarca et al. 17: 1.255616037*(Liver metastasis = yes) + 0.001998003* ALP +0.00019998* LDH + 0.019802627* Ki67 − 0.527632742*(PS = 1) + 1.124929597*(PS = 2) + 0.783901544*(PS = 3). And the prognostic score in their study was as follows: 1 (Liver metastasis = YES) or 0 (Liver metastasis = NO) + 0 (ALP, U/L ≤ 82) or 1 (ALP, U/L = 83–289) or 2 (ALP, U/L ≥ 290) + 0 (LDH, U/L ≤ 827) or 1 (LDH, U/L ≥ 828) + 0 (PS = 0–1) or 1 (PS ≥2) + 0 (Ki67, % ≤ 80) or 1 (Ki67, % > 80). Both of them and our final model were validated in the patients from the whole cohorts using the same exclusion criteria as in their study; that is, hepatobiliary system–derived NENs and patients with mixed adenoneuroendocrine carcinoma were excluded.
Notably, the OS nomogram performed better at all time points for both two cohorts' survival estimation compared with the other two models in their study (supplemental online Table 4).
Discussion
In this study, we developed and validated one nomogram for patients with NENs‐G3 from digestive system to predict 1‐year and 2‐year OS. Moreover, the C‐index of the nomogram in our study was 0.761 for OS and was higher than the stage (0.647) alone. Kaplan‐Meier analysis showed progressively worse disease‐specific survival from group A (low‐risk group) to group B (high‐risk group) among different subgroups of stage (supplemental online Fig. 3A, 3B) or tumor differentiation (supplemental online Fig. 4A–4C) for all cohorts in our study. And our nomogram underwent successful external validation against one independent cohort, which may be a practical instrument to provide patient‐centered, personalized prediction for newly diagnosed patients with digestive system–derived NENs‐G3.
The model used easily ascertainable clinical and pathological risk factors to provide prediction on OS, including PS, Ki67, stage, site of primary tumor, and LDH. This minimizes variability in the collection of patient data and improves the general applicability of the study findings. The nomogram has some resemblances with and potential improvements over the previously published model by Lamarca et al. 17. Several predictive factors in our nomogram (LDH, PS, and Ki67) were common with their study, but our larger sample size for the validation cohort allowed us to evaluate the contribution of additional factors, such as stage, platelets, and site of primary tumor, which had been identified as predictors for outcome from several studies. Moreover, because the patients of the development cohort were from four different centers, a selection bias, to some extent, could be controlled. Notably, ALP, despite being included in their model and showing significant difference in our univariate analyses, was not added to the final model, given that it was excluded based on the AIC for variable selection and not independently associated with OS after adjusted for other prognostic variables in the maximum regression model. The primary tumor location also appeared to be prognostic. Furthermore, it is important to note that their published risk score only applies to NENs‐G3 from gastrointestinal and pancreas. Our results showed that high‐grade MANEC and pure NEC had similar prognosis, which was in line with the findings of previously published studies 27, 28 and agreed with the hypothesis that high‐grade MANEC are treated similarly to pure NEC as the natural history of the disease appears to be determined by the NEC component 5, 29.
To compare with their developed regression model and prognostic score, we validated all of them in the patients, limiting the cohort to gastrointestinal‐ and pancreas‐derived NENs and nonmixed adenoneuroendocrine carcinoma. The importance of validation is highlighted in our study, as our prognostic nomogram performed better in the secondary analyses. The difference in performance is likely driven by several diversities in study populations, such as the tumor morphology and race. Unfortunately, tumor morphology was not reported at baseline in their cohort.
The direct application of our prognostic nomogram was to create two subgroups, a low‐risk (A) and high‐risk (B) group with significant differences on OS. In our study, 51.4% of the patients had distant metastases, and 37% of the patients were locally advanced. Thus, the majority of the patients may not be candidates for surgical resection because of their medical comorbidities and unresectable property. For these tumors, systemic therapy is often the primary treatment choice 30, 31. Further subgroup analysis suggested that chemotherapy may only benefit the patients in the poor‐prognosis subgroup. A total of 78% of the patients in our study receiving first‐line chemotherapy were treated with platinum‐based chemotherapy. Accordingly, our results suggested that for the low‐risk patients, active chemotherapy, especially platinum‐based chemotherapy, may not be able to bring clinical benefit. Considering the limited sample of the patients receiving nonplatinum‐based treatment, the optimal clinical management for the cohort in the low‐risk group with unresectable and metastatic disease remained unanswered, which will be addressed by the next phase of our work. Simultaneously, the prognostic model can also be applied to facilitate subgroup analysis for informing treatment or for stratifying patients by disease severity in clinical trials.
We acknowledge that the study has several limitations. First, our study was limited by its retrospective nature, and additional prospective validation will be required to evaluate the risk model. Second, because of the nonavailability of this information for the majority of patients, the nomogram did not include other important predictors as reported in other studies, such as tumor morphology. Third, the primary objective for our research is to predict the 1‐year or 2‐year death risk, which may be less affected by the limited follow‐up time. Fourth, the calibration plots for the external validation cohort deviated slightly, especially for individuals with poor survival, for whom the estimated mortality was a little higher than observed mortality. The median OS in the validation cohort was longer compared with the development cohort. Inadequate discrimination, to some extent, can be explained by the different distribution of the baseline characteristics, such as the PS and tumor morphology. All of the patients in the validation cohort have PS 0–1. The proportion of well‐differentiated NENs was higher when compared with the development cohort (20% vs. 0.6%). Fifth, the study population is exclusively Chinese, which may limit applicability to a wider population. Finally, to ensure reliability of data, we excluded patients who had missing information on key predictors, leaving a final sample size of 172 patients with complete data in the development cohort, and some selection bias may be introduced. We then repeated with imputed data sets, which gave much the same results (supplemental online Appendix 1).
Conclusion
The nomogram for 1‐year and 2‐year OS was developed and validated for patients with NENs‐G3 from digestive system, which can be offered to clinicians to improve prognostic assessment, enhance patient stratification in clinical trials, and aid prognosis‐based decision‐making for each patient.
Author Contributions
Conception/design: Zhenyu Lin, Haihong Wang, Yixuan Zhang, Guiling Li, Jie Chen, Tao Zhang
Provision of study material or patients: Guiling Li, Guoliang Pi, Xianjun Yu, Yaobing Chen, Gang Wu, Jie Chen, Tao Zhang
Collection and/or assembly of data: Zhenyu Lin, Haihong Wang, Yixuan Zhang, Kaizhou Jin, Ying Zhu
Data analysis and interpretation: Zhenyu Lin, Haihong Wang, Yixuan Zhang, Guiling Li, Liangkai Chen, Shengli Yang
Manuscript writing: Zhenyu Lin, Haihong Wang, Yixuan Zhang, Guiling Li, Guoliang Pi, Xianjun Yu, Yaobing Chen, Kaizhou Jin, Liangkai Chen, Shengli Yang, Ying Zhu, Gang Wu, Jie Chen, Tao Zhang
Final approval of manuscript: Zhenyu Lin, Haihong Wang, Yixuan Zhang, Guiling Li, Guoliang Pi, Xianjun Yu, Yaobing Chen, Kaizhou Jin, Liangkai Chen, Shengli Yang, Ying Zhu, Gang Wu, Jie Chen, Tao Zhang
Disclosures
The authors indicated no financial relationships.
Supporting information
See http://www.TheOncologist.com for supplemental material available online.
Supplementary Material
Supplementary Figures
Supplementary Tables
Acknowledgments
This work was supported by the National Natural Science Foundation of China (grant 81874061) and Foundation of Guangzhou Science and Technology Plan (grant 201804010078).
Disclosures of potential conflicts of interest may be found at the end of this article.
Contributor Information
Jie Chen, Email: chenojie@hotmail.com.
Tao Zhang, Email: taozhangxh@hust.edu.cn.
References
- 1. Cives M, Strosberg JR. Gastroenteropancreatic neuroendocrine tumors. CA Cancer J Clin 2018;68:471–487. [DOI] [PubMed] [Google Scholar]
- 2. Dasari A, Shen C, Halperin D et al. Trends in the incidence, prevalence, and survival outcomes in patients with neuroendocrine tumors in the United States. JAMA Oncol 2017;3:1335–1342. [DOI] [PMC free article] [PubMed] [Google Scholar]
- 3. Klimstra DS, Modlin IR, Coppola D et al. The pathologic classification of neuroendocrine tumors: A review of nomenclature, grading, and staging systems. Pancreas 2010;39:707–712. [DOI] [PubMed] [Google Scholar]
- 4. Rindi G, Wiedenmann B. Neuroendocrine neoplasms of the gut and pancreas: New insights. Nat Rev Endocrinol 2011;8:54–64. [DOI] [PubMed] [Google Scholar]
- 5. Sorbye H, Baudin E, Borbath I et al. Unmet needs in high‐grade gastroenteropancreatic neuroendocrine neoplasms (WHO G3). Neuroendocrinology 2019;108:54–62. [DOI] [PubMed] [Google Scholar]
- 6. Nunez‐Valdovinos B, Carmona‐Bayonas A, Jimenez‐Fonseca P et al. Neuroendocrine tumor heterogeneity adds uncertainty to the World Health Organization 2010 classification: Real‐world data from the Spanish Tumor Registry (R‐GETNE). The Oncologist 2018;23:422–432. [DOI] [PMC free article] [PubMed] [Google Scholar]
- 7. Kawasaki K, Fujii M, Sato T. Gastroenteropancreatic neuroendocrine neoplasms: Genes, therapies and models. Dis Model Mech 2018;11. [DOI] [PMC free article] [PubMed] [Google Scholar]
- 8. Kloppel G. Neuroendocrine neoplasms: Dichotomy, origin and classifications. Visc Med 2017;33:324–330. [DOI] [PMC free article] [PubMed] [Google Scholar]
- 9. Rindi G, Klimstra DS, Abedi‐Ardekani B et al. A common classification framework for neuroendocrine neoplasms: An International Agency for Research on Cancer (IARC) and World Health Organization (WHO) expert consensus proposal. Mod Pathol 2018;31:1770–1786. [DOI] [PMC free article] [PubMed] [Google Scholar]
- 10. Coriat R, Walter T, Terris B et al. Gastroenteropancreatic well‐differentiated grade 3 neuroendocrine tumors: Review and position statement. The Oncologist 2016;21:1191–1199. [DOI] [PMC free article] [PubMed] [Google Scholar]
- 11. Heetfeld M, Chougnet CN, Olsen IH et al. Characteristics and treatment of patients with G3 gastroenteropancreatic neuroendocrine neoplasms. Endocr Relat Cancer 2015;22:657–664. [DOI] [PubMed] [Google Scholar]
- 12. Sorbye H, Welin S, Langer SW et al. Predictive and prognostic factors for treatment and survival in 305 patients with advanced gastrointestinal neuroendocrine carcinoma (WHO G3): The NORDIC NEC study. Ann Oncol 2013;24:152–160. [DOI] [PubMed] [Google Scholar]
- 13. Strosberg JR, Fine RL, Choi J et al. First‐line chemotherapy with capecitabine and temozolomide in patients with metastatic pancreatic endocrine carcinomas. Cancer 2011;117:268–275. [DOI] [PMC free article] [PubMed] [Google Scholar]
- 14. Olsen IH, Sorensen JB, Federspiel B et al. Temozolomide as second or third line treatment of patients with neuroendocrine carcinomas. ScientificWorldJournal 2012;2012:170496. [DOI] [PMC free article] [PubMed] [Google Scholar]
- 15. Welin S, Sorbye H, Sebjornsen S et al. Clinical effect of temozolomide‐based chemotherapy in poorly differentiated endocrine carcinoma after progression on first‐line chemotherapy. Cancer 2011;117:4617–4622. [DOI] [PubMed] [Google Scholar]
- 16. Yamaguchi T, Machida N, Morizane C et al. Multicenter retrospective analysis of systemic chemotherapy for advanced neuroendocrine carcinoma of the digestive system. Cancer Sci 2014;105:1176–1181. [DOI] [PMC free article] [PubMed] [Google Scholar]
- 17. Lamarca A, Walter T, Pavel M et al. Design and validation of the GI‐NEC score to prognosticate overall survival in patients with high‐grade gastrointestinal neuroendocrine carcinomas. J Natl Cancer Inst 2017;109. [DOI] [PubMed] [Google Scholar]
- 18. Nomograms Kattan MW.. Introduction. Semin Urol Oncol 2002;20:79–81. [PubMed] [Google Scholar]
- 19. Yao JC, Hassan M, Phan A et al. One hundred years after "carcinoid": Epidemiology of and prognostic factors for neuroendocrine tumors in 35,825 cases in the United States. J Clin Oncol 2008;26:3063–3072. [DOI] [PubMed] [Google Scholar]
- 20. Pond GR, Siu LL, Moore M et al. Nomograms to predict serious adverse events in phase II clinical trials of molecularly targeted agents. J Clin Oncol 2008;26:1324–1330. [DOI] [PubMed] [Google Scholar]
- 21. van Buuren S, Boshuizen HC, Knook DL. Multiple imputation of missing blood pressure covariates in survival analysis. Stat Med 1999;18:681–694. [DOI] [PubMed] [Google Scholar]
- 22. Zhang Z. Multiple imputation with multivariate imputation by chained equation (MICE) package. Ann Transl Med 2016;4:30. [DOI] [PMC free article] [PubMed] [Google Scholar]
- 23. Harrell FE Jr, Lee KL, Mark DB. Multivariable prognostic models: Issues in developing models, evaluating assumptions and adequacy, and measuring and reducing errors. Stat Med 1996;15:361–387. [DOI] [PubMed] [Google Scholar]
- 24. Zhang Z, Cortese G, Combescure C et al. Overview of model validation for survival regression model with competing risks using melanoma study data. Ann Transl Med 2018;6:325. [DOI] [PMC free article] [PubMed] [Google Scholar]
- 25. Gerds TA, Andersen PK, Kattan MW. Calibration plots for risk prediction models in the presence of competing risks. Stat Med 2014;33:3191–3203. [DOI] [PubMed] [Google Scholar]
- 26. Royston P, Altman DG. External validation of a cox prognostic model: Principles and methods. BMC Med Res Methodol 2013;13:33. [DOI] [PMC free article] [PubMed] [Google Scholar]
- 27. La Rosa S, Marando A, Furlan D et al. Colorectal poorly differentiated neuroendocrine carcinomas and mixed adenoneuroendocrine carcinomas: Insights into the diagnostic immunophenotype, assessment of methylation profile, and search for prognostic markers. Am J Surg Pathol 2012;36:601–611. [DOI] [PubMed] [Google Scholar]
- 28. Park JY, Ryu MH, Park YS et al. Prognostic significance of neuroendocrine components in gastric carcinomas. Eur J Cancer 2014;50:2802–2809. [DOI] [PubMed] [Google Scholar]
- 29. de Mestier L, Cros J, Neuzillet C et al. Digestive system mixed neuroendocrine‐non‐neuroendocrine neoplasms. Neuroendocrinology 2017;105:412–425. [DOI] [PubMed] [Google Scholar]
- 30. Oberg K, Knigge U, Kwekkeboom D et al. Neuroendocrine gastro‐entero‐pancreatic tumors: ESMO clinical practice guidelines for diagnosis, treatment and follow‐up. Ann Oncol 2012;23(suppl 7):vii124–vii130. [DOI] [PubMed] [Google Scholar]
- 31. Sorbye H, Strosberg J, Baudin E et al. Gastroenteropancreatic high‐grade neuroendocrine carcinoma. Cancer 2014;120:2814–2823. [DOI] [PubMed] [Google Scholar]
Associated Data
This section collects any data citations, data availability statements, or supplementary materials included in this article.
Supplementary Materials
See http://www.TheOncologist.com for supplemental material available online.
Supplementary Material
Supplementary Figures
Supplementary Tables