

Abstract
Background
Minimally invasive diagnostic biomarkers for patients with pancreatic ductal adenocarcinoma (PDAC) and distal cholangiocarcinoma (dCCA) are warranted to facilitate accurate diagnosis. This study identified diagnostic plasma proteins based on proteomics of tumor secretome.
Materials and Methods
Secretome of tumor and normal tissue was collected after resection of PDAC and dCCA. Differentially expressed proteins were measured by mass spectrometry. Selected candidate biomarkers and carbohydrate antigen 19‐9 (CA19‐9) were validated by enzyme‐linked immunosorbent assay in plasma from patients with PDAC (n = 82), dCCA (n = 29), benign disease (BD; n = 30), and healthy donors (HDs; n = 50). Areas under the curve (AUCs) of receiver operator characteristic curves were calculated to determine the discriminative power.
Results
In tumor secretome, 696 discriminatory proteins were identified, including 21 candidate biomarkers. Thrombospondin‐2 (THBS2) emerged as promising biomarker. Abundance of THBS2 in plasma from patients with cancer was significantly higher compared to HDs (p < .001, AUC = 0.844). Combined expression of THBS2 and CA19‐9 yielded the optimal discriminatory capacity (AUC = 0.952), similarly for early‐ and late‐stage disease (AUC = 0.971 and AUC = 0.911). Remarkably, this combination demonstrated a power similar to CA19‐9 to discriminate cancer from BD (AUC = 0.764), and THBS2 provided an additive value in patients with high expression levels of bilirubin.
Conclusion
Our proteome approach identified a promising set of candidate biomarkers. The combined plasma expression of THBS2/CA19‐9 is able to accurately distinguish patients with PDAC or dCCA from HD and BD.
Implications for Practice
The combined plasma expression of thrombospondin‐2 and carbohydrate antigen 19‐9 is able to accurately diagnose patients with pancreatic cancer and distal cholangiocarcinoma. This will facilitate minimally invasive diagnosis for these patients by distinguishing them from healthy individuals and benign diseases.
Keywords: Pancreatic cancer, Distal cholangiocarcinoma, Diagnostic biomarkers, Thrombospondin‐2, Proteomics
Short abstract
This article identifies diagnostic plasma proteins to distinguish patients with pancreatic ductal adenocarcinoma and distal cholangiocarcinoma from benign disease and health donors and evaluates these new markers for additive value with CA19‐9 at different disease stages.
Introduction
Lethality of pancreatic ductal adenocarcinoma (PDAC) remains an unsolved problem 1. This tumor type is featured by early metastatic dissemination 2. As a result, the majority of patients are diagnosed at advanced stages 3. Early and adequate diagnosis enhances the possibility of offering optimal curative therapy 4. Strikingly, clinical symptoms and diagnostic features of patients with PDAC show a considerable similarity to those of patients with distal cholangiocarcinoma (dCCA) 5.
Currently, the diagnostic process for patients with PDAC and dCCA tumors relies on clinical suspicion, radiological investigation, brush cytology or fine‐needle aspiration for pathological confirmation, and measurement of tumor markers 3. This extensive diagnostic workup still results in diagnostic uncertainty with 5%–10% misdiagnosis after surgery 6, as well as delayed therapy initiation. Moreover, these invasive diagnostic techniques can cause procedure‐specific complications and exhibit low sensitivity for early‐stage tumors, undermining their use for early diagnostics 7. Thus far, histopathological tumor confirmation after resection remains the only gold standard procedure for differential diagnostics 8. Minimally invasive biomarkers could help to distinguish PDAC and dCCA from benign disease (BD) and improve the clinical management of these patients.
The clinically implemented tumor marker carbohydrate antigen 19‐9 (CA19‐9) is easily measurable in blood samples but lacks the sensitivity (∼79%) and specificity (∼82%) needed for conclusive diagnoses for both PDAC and dCCA 9. Multiple confounders can hamper the accuracy of CA19‐9. Firstly, elevated levels of bilirubin result in false positive CA19‐9 in BD 10. Secondly, expression of CA19‐9 is dependent on specific Lewis genotypes, which are absent in 5%–10% of the population 11, resulting in false negative results. Additionally, only 60% of patients with cholangiocarcinoma show elevated levels of CA19‐9 12. These factors prompt the search for novel, additional biomarkers with additive value to CA19‐9.
Proteins secreted by tumor cells, also known as secretome, have been investigated for their potential as biomarkers. Unbiased discovery analysis of this secretome has the potential to yield novel tumor‐specific protein‐based biomarkers. In particular, increased sensitivity and depth of mass spectrometry analysis provide a powerful discovery platform that can be exploited for biomarker identification 13. However, proteins are highly abundant in plasma and serum, shielding less expressed tumor‐specific proteins. Conventionally, cell line secretome has been evaluated for biomarker identification 14, but tumor tissue secretomes present a more realistic sample source to reflect human tumor‐specific protein secretion into the circulation 15. Hence, exploration of proteins in tumor secretome allows for a novel approach to identify diagnostic plasma biomarkers.
The aim of the study was to identify novel diagnostic plasma proteins to distinguish patients with PDAC and dCCA from patients with BD and healthy donors (HDs) and to evaluate these new markers for their additive value with CA19‐9 in different disease stages. To this end, we were first to profile the proteome of secreted proteins from resected PDAC, dCCA, adjacent normal pancreatic tissues, and cancer cell lines to identify novel tumor protein biomarkers. Comparative analysis yielded several PDAC‐ and dCCA‐specific proteins. Expression of thrombospondin‐2 (THBS2) was explored in plasma samples of patients with early‐ and late‐stage PDAC, dCCA, and BD and HDs and combined with the current standard marker, CA19‐9. Together, the combined expression of THBS2 and CA19‐9 demonstrated a high accuracy to diagnose both PDAC and dCCA.
Materials and Methods
Study Population and Samples
Tissues from tumorous areas and adjacent normal pancreas were collected from seven patients with suspected malignancy of the pancreas. Blood samples were collected prior to therapy from consecutive patients with PDAC (n = 82), dCCA (n = 29), and BD (n = 30) and age‐and gender‐matched HDs (n = 50). BD included chronic pancreatitis (n = 14), cholangitis (n = 9), and choledocholithiasis (n = 7). Bilirubin levels were determined by the colorimetric diazomethod (Bilirubin Total Gen.3, Roche Diagnostics, Basel, Switzerland). A bilirubin level of ≥20 μmol/L was considered elevated. The prospective collection of samples and clinical data was approved by the local medical ethical committee of the VU University Amsterdam (2016.510) and obtained after written informed consent. The study was reported in accordance with Standards for Reporting of Diagnostic Accuracy Studies guidelines 16 and further described in the supplemental online Methods.
Tissue and Cells Secretome
Tissue secretome from tumor and adjacent normal pancreatic tissue was collected as described previously and in the supplemental online Methods 17. Secretome of three PDAC cell lines (Suit‐2, PANC1, AsPC1) was harvested as described previously 18. Briefly, serum‐free medium containing secreted proteins was collected after ∼16 hours and concentrated, as described in the supplemental online Methods.
Whole‐in‐Gel Protein Digestion, nanoLC–Tandem Mass Spectrometry Proteomic Analysis and Protein Identification
Proteins were digested to peptides with a whole‐in‐gel protein digestion protocol as described previously 19. Next, peptides were separated by an Ultimate 3000 nanoLC–tandem mass spectrometry (MS/MS) system (Dionex, Thermo Fisher Scientific, Waltham, MA) and measured in a Q Exactive mass spectrometer (Thermo Fisher Scientific). MS/MS spectra were searched against the Swissprot FASTA file (release March 2017, 42,161 entries, canonical and isoforms) using MaxQuant 1.5.8.0. The mass spectrometry proteomics data have been deposited to the ProteomeXchange Consortium, data set PXD012480 20. In‐depth description and peptide/protein data are reported in the supplemental online Methods and supplemental online Tables 1 and 2.
Selection of Candidate Biomarkers and Data Mining
Proteins were evaluated on the significance of differential expression (p < .05) and paired fold change (FC) ≥2 in secretome of PDAC or dCCA tumorous tissue compared with secretome of paired normal pancreatic tissue. Candidate proteins had to be detected in all PDAC and dCCA samples. Next, proteins were selected based on their previous identification in the human Plasma Proteome Database (http://www.plasmaproteindatabase.org) 21. This step enhances the likelihood of detection of the secreted proteins in plasma. All candidate biomarkers were further selected based on their expression in the secretome of cancer cell lines. Next, the top proteins were analyzed for pancreatic expression in the Human Protein Atlas (HPA; http://www.proteinatlas.org) 22 and in addition a literature search was performed for known biology involvement in PDAC or dCCA. Pathway analysis of the emerging tumor proteins were investigated with Gene Ontology analysis with Cytoscape (version 3.3.5) and Cluego Plugin (version 2.5.0).
Enzyme‐Linked Immunosorbent Assay Validation
Two protein candidates were selected for validation in plasma samples with enzyme‐linked immunosorbent assay (ELISA). Human thromobospondin‐2 (THBS2, K#DTSP20, R&D Systems, Minneapolis, MN) and mucin 5B (MUC5B, #LS‐F22609, LSBio, Seattle, WA) were measured according to manufacturer's protocols. In addition, CA19‐9 (#EHCA199, Thermo Fisher Scientific) was measured in plasma samples. Duplicates (diluted two‐ to fourfold in dilution buffer) of 50 μL for THBS2 and 100 μL for MUC5B and CA19‐9 were used as a total input. A background standard from pooled plasma from five HDs was added to each plate to evaluate interplate variability and normalize for batch effect.
Statistical Analysis
Differential secreted proteins identified in tissue secretome were analyzed with the paired beta‐binomial test 23. Individual FCs were calculated per tumor‐normal paired combinations. Hierarchical clustering was performed with R (version 3.3.4), package gplots (default Euclidean distance function and complete linkage).
Demographic characteristics were compared using the Pearson chi‐squared test for categorical variables and unpaired Student's t test or analysis of variance for continuous variables. Receiver operator characteristic (ROC) curves and area under the curve (AUC) with accompanying 95% confidence interval (CI) were calculated to determine to discriminative power of individual candidates. Logistic regression analysis compared patients with PDAC and dCCA with HDs. Subsequently, multivariate logistic modeling followed by backward elimination was performed to identify the optimal diagnostic biomarker combination. Following logistic regression, predicted probabilities were used to generate an ROC curve and AUC value to assess the discriminatory power. Sensitivity of the optimal biomarker combination was determined using the Youden index at ≥90% specificity. The predicted probability threshold was used to determine the optimal cut‐off for each biomarker. Optimal biomarker combination was validated comparing patients with PDAC and dCCA with patients with BD. A p value of ≤.05 was considered statistically significant. Analyses were performed using SPSS software version 24 (IBM SPSS, Chicago, IL).
Results
Discovery of PDAC and dCCA Biomarkers
Of the seven paired samples, three pairs were excluded from analysis after histological review because of lack of abundant tumor cells in fibrotic tissue (Fig. 1). The remaining four tissue pairs were analyzed by mass spectrometry as an unbiased biomarker protein discovery approach (supplemental online Fig. 1A). Clinicopathological characteristics of the included patients are described in Table 1.
Figure 1.
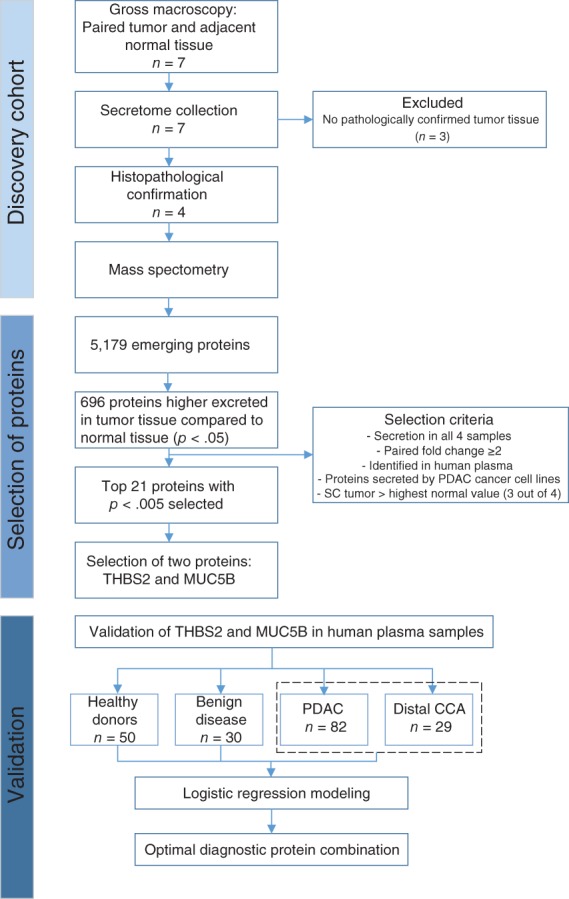
Flow chart of study design and included patients. Abbreviations: CCA, cholangiocarcinoma; MUC5B, mucin 5B; PDAC, pancreatic ductal adenocarcinoma; SC, spectral count; THBS2, thrombospondin‐2.
Table 1.
Clinical characteristics of the included samples for tissue secretome analyses and samples included for expression in plasma
| Clinical variable | Tissue secretome | Plasma validation | p valuea | ||||
|---|---|---|---|---|---|---|---|
| PDAC (n = 2) | Distal CCA (n = 2) | PDAC (n = 82) | Distal CCA (n = 29) | HDs (n = 50) | Benign disease (n = 30) | ||
| Age, median ± SD, yr | 71 ± 13 | 69 ± 7 | 69 ± 10 | 70 ± 10 | 66 ± 6 | 62 ± 10 | .018b |
| Sex, n (%) | .780 | ||||||
| Female | 1 (50) | 2 (100) | 34 (42) | 12 (41) | 24 (48) | 11 (37) | |
| Male | 1 (50) | 0 (0) | 48 (58) | 17 (59) | 26 (52) | 19 (63) | |
| Tumor stage,c n (%) | .018b | ||||||
| I | — | — | 3 (4) | 5 (17) | — | — | |
| II | 100 (100) | 100 (100) | 49 (60) | 20 (69) | — | — | |
| III | — | — | 16 (19) | 1 (3) | — | — | |
| IV | — | — | 14 (17) | 3 (10) | — | — | |
| CA19‐9, mean ± SD, U/mLd | 312 ± 678 | 108 ± 195 | 3 ± 2 | 18 ± 42 | <.001b | ||
| Thrombospondin‐2, mean ± SD, ng/mL | — | — | 66 (54) | 62 (36) | 24 (9) | 54 (58) | <.001b |
| Bilirubin, mean ± SD, μmol/L | 114 ± 141 | 201 | 99 (128) | 103 (135) | — | 20 (36) | .008b |
| Bilirubin, n (%) | .001b | ||||||
| Normal | 1 (50) | 0 (0) | 38 (46) | 7 (24) | — | 21 (70) | |
| Elevated | 1 (50) | 1 (50) | 42 (51) | 18 (62) | — | 6 (20) | |
| NR | — | 1 (50) | 2 (2) | 4 (14) | — | 3 (10) | |
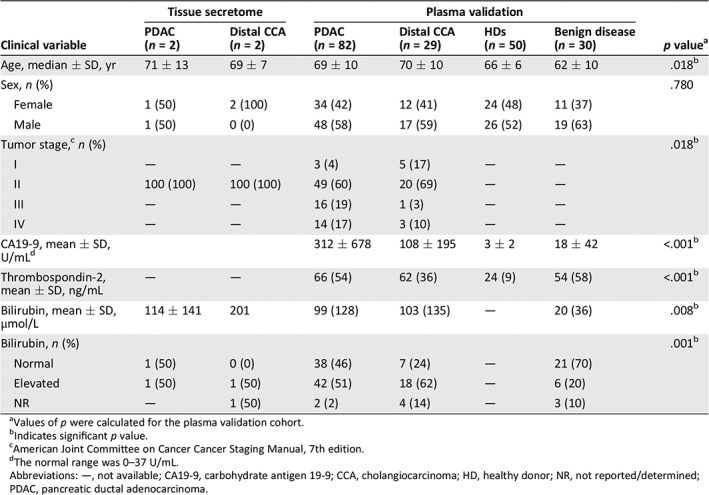
Values of p were calculated for the plasma validation cohort.
Indicates significant p value.
American Joint Committee on Cancer Cancer Staging Manual, 7th edition.
The normal range was 0–37 U/mL.
Abbreviations: —, not available; CA19‐9, carbohydrate antigen 19‐9; CCA, cholangiocarcinoma; HD, healthy donor; NR, not reported/determined; PDAC, pancreatic ductal adenocarcinoma.
Protein Identification and Selection of Potential Biomarkers
A total of 5,179 proteins were identified by mass spectrometry, of which 696 and 176 were significantly higher in secretome samples of PDAC/dCCA tumors and normal pancreas tissue, respectively. Differential proteins were able to distinguish normal from tumor tissues by unsupervised clustering (supplemental online Fig. 1B). Indeed, tumor secreted proteins were associated with cancer‐related biological processes (supplemental online Fig. 1C), validating the origin of our possible biomarkers. We hypothesized that proteins that are more abundantly secreted by PDAC and dCCA compared with normal tissue can be more easily implemented as novel tumor biomarker than downregulated proteins. Thus, the 696 significantly higher excreted proteins in tumor tissue underwent additional selection steps to obtain a final list of potential diagnostic biomarkers (see Fig. 1 for filtering steps). The top 21 proteins were further evaluated for their levels in our MS/MS data (supplemental online Fig. 2), their association in cancer biology, their expression in tumor cells on HPA, and the availability of commercial ELISAs for plasma/serum (Table 2). Finally, two candidate proteins were selected for further validation in plasma samples: THBS2, which showed highest MS/MS secreted count levels, and MUC5B, a member of the mucin family, which are known potential cancer biomarkers.
Figure 2.
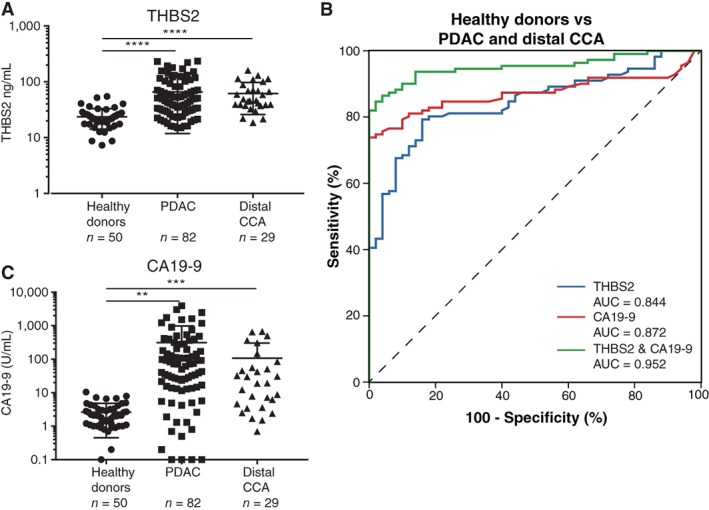
THBS2 and CA19‐9 expression in plasma samples of healthy donors compared with patients with PDAC and distal CCA. (A): Scatter plot of THBS2 levels in plasma samples from healthy donors (n = 50) compared with all stages of patients with PDAC (n = 82) and distal CCA (n = 29). (B): Receiver operator characteristic curves for THBS2 (AUC = 0.844, blue), CA19‐9 (AUC = 0.872, red), and THBS2 combined with CA19‐9 (AUC = 0.952, green) in plasma samples for healthy donors compared with patients with PDAC and distal CCA. (C): Scatter plot of CA19‐9 levels in plasma samples from healthy donors (n = 50) compared with all stages of patients with PDAC (n = 82) and distal CCA (n = 29). **p < .01, ***p < .001, **** p < .0001. Abbreviations: AUC, area under the curve; CA19‐9, carbohydrate antigen 19‐9; CCA, cholangiocarcinoma; PDAC, pancreatic ductal adenocarcinoma; THBS2, thrombospondin‐2.
Table 2.
Overview of the top 21 candidate proteins emerging from tissue secretome identified by mass spectrometry analysis
| Gene name | Protein | Average spectral count tumor | Fold change | p value | Previously described in PDAC | ELISA serum/plasmaa | Localization protein on HPA | Detection rate on HPA | Intensity expression of HPA |
|---|---|---|---|---|---|---|---|---|---|
| ANXA8 | Annexin A8 | 16.4 | 26.0 | 1.46E‐06 | Yes | No | Not detected | Not detected | Not detected |
| SERPINB5 | Serpin family B member 5 | 38.1 | 12.5 | 2.36E‐06 | Yes | Yes | Tumor | High | High |
| NSUN2 | NOP2/Sun RNA methyltransferase family member 2 | 8.9 | 33.7 | 8.30E‐06 | No | No | Tumor | High | High |
| UBR4 | Ubiquitin protein ligase E3 component n‐recognin 4 | 31.8 | 5.3 | 6.64E‐05 | No | No | Tumor | Intermediate | Intermediate |
| HK2 | Hexokinase 2 | 14.2 | 7.6 | 9.78E‐05 | Yes | No | Tumor | High | Low |
| MUC5B | Mucin 5b | 38.0 | 7.7 | .0002 | Yes | Yes | Tumor | Intermediate | High |
| SFN | Stratifin | 51.6 | 4.4 | .0002 | Yes | No | Tumor | Intermediate | Intermediate |
| MXRA5 | Matrix remodeling associated 5 | 44.5 | 5.1 | .0004 | No | Yes | Tumor | Low | Low |
| PLAA | Phospholipase A2 activating protein | 14.3 | 6.4 | .0006 | No | No | Tumor | Intermediate | Intermediate |
| GBP2 | Guanylate binding protein 2 | 8.3 | 6.2 | .0007 | No | No | Tumor | Intermediate | Intermediate |
| PTK7 | Protein tyrosine kinase 7 | 46.6 | 3.5 | .0008 | No | No | Tumor | Intermediate | Low |
| GBP1 | Guanylate binding protein 1 | 26.2 | 3.0 | .0009 | Yes | Yes | Tumor | Intermediate | Low |
| DNM2 | Dynamin 2 | 13.6 | 5.3 | .0012 | Yes | No | Tumor | Intermediate | Intermediate |
| ZYX | Zyxin | 18.3 | 4.7 | .0018 | No | Yes | Tumor | Low | Low |
| CHORDC1 | Cysteine and histidine rich domain containing 1 | 5.2 | 6.6 | .0019 | No | No | Tumor | Low | Low |
| NMI | N‐myc and STAT interactor | 7.0 | 5.3 | .0024 | No | Yes | Tumor | High | Intermediate |
| THBS2 | Thrombospondin‐2 | 108.8 | 3.7 | .0031 | Yes | Yes | Tumor | Intermediate | Intermediate |
| PFKM | Phosphofructokinase, muscle | 18.0 | 3.9 | .0035 | No | No | Tumor | High | Intermediate |
| UBE4A | Ubiquitination factor E4A | 8.5 | 5.0 | .0035 | No | No | Tumor | Intermediate | Intermediate |
| CCDC80 | Coiled‐coil domain containing 80 | 16.4 | 3.5 | .0044 | No | Yes | Tumor | Low | Intermediate |
| SRRT | Serrate, RNA effector molecule | 8.0 | 3.4 | .0046 | No | No | Tumor | High | High |
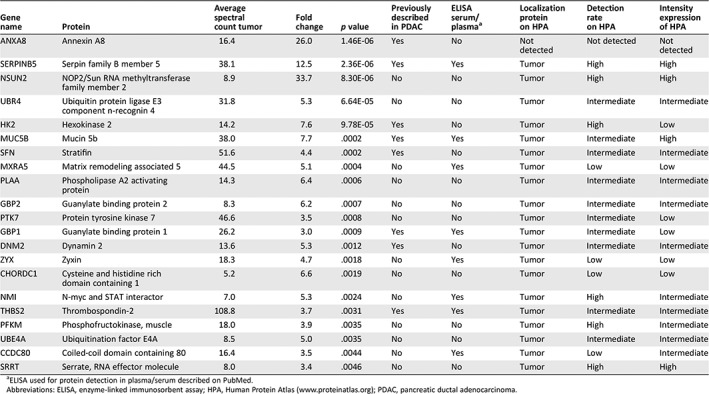
ELISA used for protein detection in plasma/serum described on PubMed.
Abbreviations: ELISA, enzyme‐linked immunosorbent assay; HPA, Human Protein Atlas (http://www.proteinatlas.org); PDAC, pancreatic ductal adenocarcinoma.
Expression of THBS2 and MUC5B in Plasma Samples of Patients with PDAC and dCCA Compared with HDs
First, the protein levels of THBS2 and MUC5B were investigated in 20 HDs and 19 stage I–IV PDAC plasma samples. For MUC5B, no difference in the expression levels of this first cohort was found (p = .970; supplemental online Fig. 3) and was thus not further investigated. Expression levels of THBS2 (p < .001) prompted further analysis in the full cohort of patients with PDAC (n = 82) and dCCA (n = 29) and HDs (n = 50; Table 1).
Figure 3.
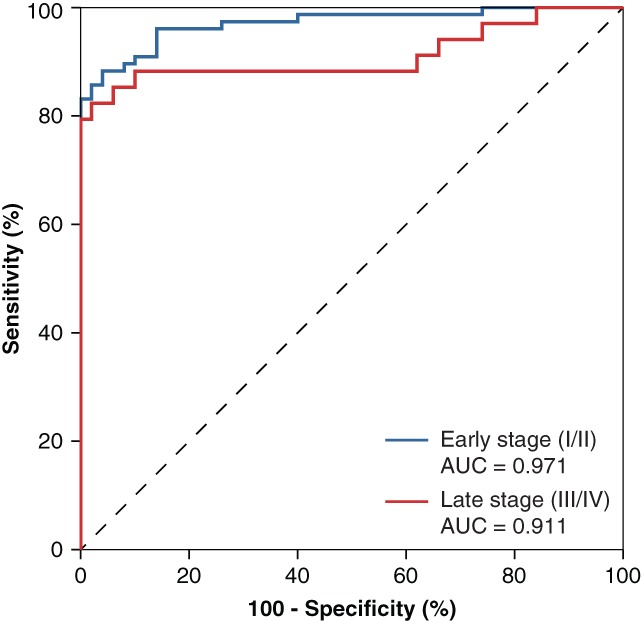
Receiver operator characteristic curves for the combined diagnostic panel of THBS2 and carbohydrate antigen 19‐9 in patients with early‐stage tumors (n = 77; AUC = 0.971, blue) and late‐stage tumors (n = 34; AUC = 0.911, red) compared with healthy donors. Abbreviation: AUC, area under the curve.
The expression of THBS2 was significantly higher in PDAC (66 ng/mL) and dCCA (62 ng/mL) compared with HDs (24 ng/mL, p < .001; Fig. 2A). No difference in plasma THBS2 expression was found between PDAC and dCCA, in line with discovery phase. THBS2 exhibited an AUC of 0.844 (95% CI, 0.784–0.904; p < .001; Fig. 2B) when comparing PDAC and dCCA versus HDs, resulting in a positive predictive value of 94%. Expression of THBS2 was able to accurately discriminate HDs from both PDAC (AUC = 0.822), as well as HDs from dCCA (AUC = 0.906; supplemental online Fig. 4).
Figure 4.
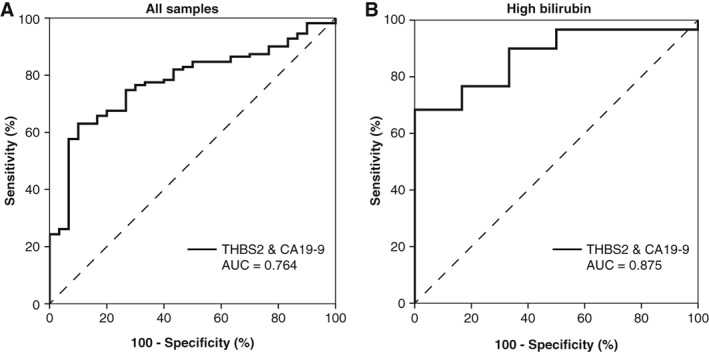
THBS2 and CA19‐9 expression in plasma samples for patients with benign disease compared with pancreatic ductal adenocarcinoma and distal cholangiocarcinoma. (A): Receiver operator characteristic curve for the combined expression of THBS2 and CA19‐9 in plasma samples from patients with benign disease (n = 30) versus pancreatic ductal adenocarcinoma (n = 82) and distal cholangiocarcinoma (n = 29; AUC = 0.764). (B): Performance of the combined panel stratified for patients with high expression levels of bilirubin. The combination demonstrated an AUC of 0.875 in patients with high bilirubin levels. Abbreviations: AUC, area under the curve; CA19‐9, carbohydrate antigen 19‐9; THBS2, thrombospondin‐2.
Levels of CA19‐9 were significantly higher in patients with PDAC (312 U/mL) and dCCA (108 U/mL) compared with HDs (3 U/mL, p = .001; Fig. 2C), which resulted in an AUC of 0.872 (95% CI, 0.817–0.927; p < .001; Fig. 2B). CA19‐9 did not show sufficient power to discriminate between PDAC and dCCA (AUC = 0.612 [0.497–0.727]). The combination of THBS2 and CA19‐9 resulted in an enhanced AUC of 0.952 (95% CI, 0.921–0.984; p < .001; Fig. 2B), comparing PDAC and dCCA with HDs. Together, the combined panel resulted in a sensitivity of 90% with a specificity of 90%. The combined biomarker panel performance was compared for resectable (stage I/II, n = 77) and locally advanced and metastatic PDAC and dCCA (stage III/IV, n = 34) and demonstrated a similar performance for early‐ (AUC = 0.971) and late‐stage (AUC = 0.911) disease (Fig. 3).
Determination of an Optimal Cut‐off for THBS2 and CA19‐9
Based on the combined biomarker panel, the optimum predicted probability threshold (≥0.478) was used to determine the optimal cutoff of THBS2. This resulted in the best discriminatory cutoff value of 40.9 ng/mL. At this concentration, 50% of the PDAC cases were detected with 95% specificity. For CA19‐9 levels, the optimal cutoff based on the combined biomarker panel was 7.2 U/mL. The combination of the optimal cutoff of THBS2 (40.9 ng/mL) and CA19‐9 (7.2 U/mL) demonstrated an AUC of 0.906 (95% CI, 0.860–0.953) and classified correctly 96/111 (86%) of the patients with PDAC or dCCA and 44/50 (88%) of the HDs. Of note, 11 of 26 (42%) patients with PDAC/dCCA with low levels of CA19‐9 had elevated levels of THBS2, underlining the additive value of THBS2 in the diagnostic biomarker panel.
Performance of THBS2 and CA19‐9 Combination in Patients with Benign Disease
To test the diagnostic capacity of the combined THBS2/CA19‐9 panel in a realistic cohort of outpatient clinic population, patients with PDAC and dCCA were compared with those with BD (n = 30; Table 1). Patients with PDAC and dCCA were older (p = .018) and had bilirubin levels higher (p = .008) compared with patients with BD. The diagnostic performance of THBS2 in this cohort demonstrated an AUC of 0.614 (95% CI, 0.498–0.730; p = .055) and CA19‐9 an AUC of 0.779 (95% CI, 0.695–0.862; p < .001). The combination of THBS2 and CA19‐9 did not improve these results, showing an AUC of 0.764 (95% CI, 0.679–0.849; p < .001; Fig. 4A), and a specificity of 90% with a sensitivity of 62%. However, THBS2 still demonstrated an additive value in patients with high bilirubin.
High levels of bilirubin are known to influence expression levels of CA19‐9 24. To evaluate the confounding effect of bilirubin on the diagnostic performance of the THBS2/CA19‐9 combination, bilirubin was determined in patients with PDAC, dCCA, and BD. In total, 51% of the patients with PDAC, 62% of the patients with dCCA and 20% of the patients with BD demonstrated elevated levels of bilirubin (Table 1). No significant difference was found in expression of CA19‐9 comparing patients with low and high levels of bilirubin (p = .214), whereas expression of THBS2 was significantly lower in patients with low bilirubin (p < .001). Of the patients with PDAC/dCCA with normal CA19‐9 levels and without jaundice, 2 of 12 had elevated THBS2 levels (≥40.9 ng/mL). Also, 9 of 13 patients with normal CA19‐9 with jaundice showed elevated levels of THBS2, underlining its additive value. High expression levels of bilirubin did not impede the diagnostic potential of the THBS2/CA19‐9 combination comparing patients with PDAC/dCCA with those with BD, which resulted in an AUC of 0.875 (95% CI, 0.767–0.983; Fig. 4B), although these numbers were relatively low.
Discussion
This study demonstrates the diagnostic potential of combined plasma expression of THBS2 and CA19‐9 as a diagnostic biomarker combination for patients with PDAC and dCCA. Higher expression levels of THBS2 and CA19‐9 were observed in PDAC and dCCA, and the combined expression showed high accuracy to distinguish them from HDs. The phased approach of this study encompassed an unbiased discovery phase of mass spectrometry‐based biomarker detection from tissue secretome, leading to the identification of a promising set of 21 secreted candidate biomarkers, followed by an independent validation of two selected proteins in human plasma samples. Together, the combination of THBS2 and CA19‐9 demonstrated high accuracy for diagnosis of patients with PDAC and dCCA.
THBS2 expression has been described previously as biomarker for patients with PDAC and has been shown to correlate with high dysplasia grade in patients with premalignant disease 25. Combined expression of THBS2 and CA19‐9 demonstrated comparable diagnostic accuracy to distinguish patients with PDAC from HDs and patients with BD, in line with our results 26, 27, 28. These studies reported slightly different optimal cutoff values of THBS2 (42 and 28.9 ng/mL), almost comparable to the present study (40 ng/mL). These small discrepancies could be explained by the difference between plasma and serum samples or technical procedures. In addition, expression in patients with dCCA was not examined previously. Also, detection of THBS2 in blood samples can be easily performed by a well‐validated ELISA, for which costs are relatively low nowadays. Although, for clinical application, we need a thorough process of optimization to ensure robust detection of THBS2, this ELISA test is indeed less expensive and minimally invasive compared with tissue biopsies.
THBS2 is an extracellular matrix glycoprotein of the thrombospondin family, and it mediates cell adhesion, potentially regulating angiogenesis 29. THBS2 was reported to be secreted by tumor‐stimulated stellate cells, inducing migratory functions of PDAC cells 30. The selection of candidate biomarkers in our study was partly based on proteins secreted by cancer cell lines and resulted in interesting novel potential biomarkers. However, this does not exclude the possibility of similar proteins being secreted by other cells from the microenvironment, as is shown by previous secretion of THBS2 by stromal cells 29, 30. Moreover, stroma itself can be an interesting source for biomarkers, as shown previously 31. In this study, we selected cancer cell line‐secreted proteins to aim to unravel biomarkers specifically secreted by tumor cells. Further studies are necessary to explore possible diagnostic value and overlapping expression of stroma‐specific biomarkers.
The thrombospondin family is known to regulate cell signaling and cell adhesion, and thrombospondin‐1 was described previously as a possible proteomic marker in PDAC 32, 33, 34. However, the thrombospondin family may possibly be relevant as a multicancer biomarker, because discriminative expression levels of THBS2 have been reported in several solid tumors 35, 36. This pancancer characteristic of THBS2 is also illustrated in our study, showing high expression in plasma samples of patients with dCCA, next to its potential as a PDAC‐related marker. Of note, no difference in plasma expression of THBS2 between patients with PDAC and dCCA was found in our study. PDAC and dCCA are distinct tumor entities. Although dCCA has a more favorable prognosis compared to PDAC, current adjuvant therapy regimens are clearly associated with improved survival only in PDAC, and treatment paradigms used for PDAC should not be extrapolated to dCCA 37, 38. This should prompt future studies on additional biomarkers to specifically differentiate between these tumor types 39, 40, 41. However, the combined expression of THBS2/CA19‐9 holds great promise as a tumor‐specific diagnostic biomarker for both PDAC and dCCA. Although the combination of THBS2/CA19‐9 performed equally to CA19‐9 to distinguish patients with PDAC/dCCA from BD, this combination demonstrated additive value in patients with elevated levels of bilirubin and had a positive predictive value of 94%. As such, the combined expression of THBS2 and CA19‐9 should be thoroughly investigated for clinical application in other tumor types and (inflammatory) diseases as well as premalignant lesions to ensure tumor and disease specificity.
Several other candidate biomarker proteins were identified by the mass spectrometry analysis of tissue secretome, such as MUC5B, serpin family B member 5 (SERPINB5), and matrix remodeling associated 5 (MXRA5). Elevated levels of SERPINB5 have been found in plasma samples from patients with PDAC compared with HDs, although expression levels were partly overlapping 42. Remarkably, MXRA5 was coexpressed with THBS2 in patients with lung cancer, which could call into question the additive value of MXRA5 as diagnostic biomarker combined with THBS2 43. Mucins have been reported to be involved in tumorigenesis, and MUC5B was found to regulate survival of PDAC cells 44, 45. In addition, MUC5B was identified in proteome studies as a potential diagnostic marker in pancreatic juice 33. However, no differences in plasma protein levels were found, suggesting a differential secretion of MUC5B in proximal fluids in comparison with plasma. Future studies could further explore the potential of the remaining candidate markers to optimize the combined accuracy.
This study has several limitations. Although clinically relevant patient groups were included, the numbers of patients per specified patient group in this pilot study were relatively low. This prohibited stratified analyses to investigate the diagnostic potential for specific subtypes of BD. In addition, a limited number of samples was included for unbiased discovery of protein expression by mass spectrometry analyses. However, our results demonstrated a clear separation between tumor and normal tissue, and several previously identified proteins were found in this analysis, substantiating the comprehensiveness of this approach. Nevertheless, large‐scale validation and further stratification for benign and premalignant disease is needed to verify the diagnostic capacity.
Conclusion
This study demonstrates the discriminatory power of the combined plasma expression of THBS2 and CA19‐9 to detect patients with PDAC and dCCA in early and late disease stages by using a comprehensive and robust mass spectrometry‐based screening approach combined with independent validation in clinically relevant patient samples. Expression levels in PDAC and dCCA were comparable, and this combined biomarker panel accurately distinguishes both malignancies from HDs and patients with BD. This study encourages to further explore the diagnostic potential of THBS2/CA19‐9 as a diagnostic marker for pancreatic and distal bile duct tumors.
Author Contributions
Conception/design: Tessa Y.S. Le Large, Laura L. Meijer, Thomas Wurdinger, Hanneke W.M. van Laarhoven, Maarten F. Bijlsma, Connie R. Jimenez, Elisa Giovannetti, Geert Kazemier
Provision of study material or patients: Tessa Y.S. Le Large, Laura L. Meijer, Rosita Paleckyte, Lenka N.C. Boyd, Bart Kok, Tim Schelfhorst, Nicole C.T. van Grieken, Barbara M. Zonderhuis, Freek Daams, Elisa Giovannetti, Geert Kazemier
Collection and/or assembly of data: Tessa Y.S. Le Large, Laura L. Meijer, Rosita Paleckyte, Lenka N.C. Boyd, Bart Kok, Thomas Wurdinger, Tim Schelfhorst, Thang V. Pham, Maarten F. Bijlsma
Data analysis and interpretation: Tessa Y.S. Le Large, Laura L. Meijer, Rosita Paleckyte, Thomas Wurdinger, Sander R. Piersma, Thang V. Pham, MFB, Elisa Giovannetti, Geert Kazemier
Manuscript writing: Tessa Y.S. Le Large, Laura L. Meijer, Elisa Giovannetti, Geert Kazemier
Final approval of manuscript: Tessa Y.S. Le Large, Laura L. Meijer, Rosita Paleckyte, Lenka N.C. Boyd, Bart Kok, Thomas Wurdinger, Tim Schelfhorst, Sander R. Piersma, Thang V. Pham, Nicole C.T. van Grieken, Barbara M. Zonderhuis, Freek Daams, Hanneke W.M. van Laarhoven, Maarten F. Bijlsma, Connie R. Jimenez, Elisa Giovannetti, Geert Kazemier
Disclosures
Thomas Wurdinger: inventor on liquid biopsy‐related patents (IP), Grail Inc. (OI), Exbiome BV, Ciwit BV (SAB); Hanneke W.M. van Laarhoven: Bristol Myers Squibb, Eli Lilly & Co., Merck Sharp and Dohme, Nordic Pharma, Servier (C/A), Bayer, Bristol Myers Squibb, Celgene, Janssen, Eli Lilly & Co., Nordic Pharma, Philips, Roche, Servier (RF—institution); Maarten F. Bijlsma: Celgene (RF), Servier (C/A). The other authors indicated no financial relationships.
(C/A) Consulting/advisory relationship; (RF) Research funding; (E) Employment; (ET) Expert testimony; (H) Honoraria received; (OI) Ownership interests; (IP) Intellectual property rights/inventor/patent holder; (SAB) Scientific advisory board
Supporting information
See http://www.TheOncologist.com for supplemental material available online.
Supplemental Appendices
Table S1 Supplementary peptide table 1
Table S2 Supplementary peptide table 2
Acknowledgments
The authors thank Dr. N. Funel (Cancer Pharmacology Lab, Pisa, Italy) for his kind support with the histopathological staining. This study was funded by grants from the Bennink Foundation (The Netherlands), KWF Kankerbestrijding (The Netherlands), and Cancer Center Amsterdam (The Netherlands), Associazione Italiana per la Ricerca sul Cancro (AIRC, Italy), and Fondazione Pisana per le Scienza (FPS, Italy). The Cancer Center Amsterdam Foundation and NWO‐Middelgroot (NLD) are acknowledged for support of the mass spectrometry infrastructure. None of these parties were involved in the design of the study, and collection, analysis, and interpretation of data and in writing the manuscript.
Disclosures of potential conflicts of interest may be found at the end of this article.
References
- 1. Ma J, Siegel R, Jemal A. Pancreatic cancer death rates by race among us men and women, 1970‐2009. J Natl Cancer Inst 2013;105:1694–1700. [DOI] [PubMed] [Google Scholar]
- 2. Rhim AD, Mirek ET, Aiello NM et al. EMT and dissemination precede pancreatic tumor formation. Cell 2012;148:349–361. [DOI] [PMC free article] [PubMed] [Google Scholar]
- 3. Kamisawa T, Wood LD, Itoi T et al. Pancreatic cancer. Lancet 2016;388:73–85. [DOI] [PubMed] [Google Scholar]
- 4. Hur C, Tramontano AC, Dowling EC et al. Early pancreatic ductal adenocarcinoma survival is dependent on size: Positive implications for future targeted screening. Pancreas 2016;45:1062–1066. [DOI] [PMC free article] [PubMed] [Google Scholar]
- 5. Gonzalez RS, Bagci P, Basturk O et al. Intrapancreatic distal common bile duct carcinoma: Analysis, staging considerations, and comparison with pancreatic ductal and ampullary adenocarcinomas. Mod Pathol 2016;29:1358–1369. [DOI] [PMC free article] [PubMed] [Google Scholar]
- 6. Gerritsen A, Molenaar IQ, Bollen TL et al. Preoperative characteristics of patients with presumed pancreatic cancer but ultimately benign disease: A multicenter series of 344 pancreatoduodenectomies. Ann Surg Oncol 2014;21:3999–4006. [DOI] [PubMed] [Google Scholar]
- 7. Hewitt MJ, McPhail MJ, Possamai L et al. EUS‐guided FNA for diagnosis of solid pancreatic neoplasms: A meta‐analysis. Gastrointest Endosc 2012;75:319–331. [DOI] [PubMed] [Google Scholar]
- 8. Mokdad AA, Minter RM, Zhu H et al. Neoadjuvant therapy followed by resection versus upfront resection for resectable pancreatic cancer: A propensity score matched analysis. J Clin Oncol 2017;35:515–522. [DOI] [PubMed] [Google Scholar]
- 9. Goonetilleke KS, Siriwardena AK. Systematic review of carbohydrate antigen (CA 19‐9) as a biochemical marker in the diagnosis of pancreatic cancer. Eur J Surg Oncol 2007;33:266–270. [DOI] [PubMed] [Google Scholar]
- 10. Marrelli D, Caruso S, Pedrazzani C et al. CA19‐9 serum levels in obstructive jaundice: Clinical value in benign and malignant conditions. Am J Surg 2009;198:333–339. [DOI] [PubMed] [Google Scholar]
- 11. Luo G, Liu C, Guo M et al. Potential biomarkers in Lewis negative patients with pancreatic cancer. Ann Surg 2017;265:800–805. [DOI] [PubMed] [Google Scholar]
- 12. Hatzaras I, Schmidt C, Muscarella P et al. Elevated CA 19‐9 portends poor prognosis in patients undergoing resection of biliary malignancies. HPB (Oxford) 2010;12:134–138. [DOI] [PMC free article] [PubMed] [Google Scholar]
- 13. Yoneyama T, Ohtsuki S, Honda K et al. Identification of IGFBP2 and IGFBP3 as compensatory biomarkers for CA19‐9 in early‐stage pancreatic cancer using a combination of antibody‐based and LC‐MS/MS‐based proteomics. PLoS One 2016;11:e0161009. [DOI] [PMC free article] [PubMed] [Google Scholar]
- 14. Wu CC, Hsu CW, Chen CD et al. Candidate serological biomarkers for cancer identified from the secretomes of 23 cancer cell lines and the Human Protein Atlas. Mol Cell Proteomics 2010;9:1100–1117. [DOI] [PMC free article] [PubMed] [Google Scholar]
- 15. Rifai N, Gillette MA, Carr SA. Protein biomarker discovery and validation: The long and uncertain path to clinical utility. Nat Biotechnol 2006;24:971–983. [DOI] [PubMed] [Google Scholar]
- 16. Cohen JF, Korevaar DA, Altman DG et al. STARD 2015 guidelines for reporting diagnostic accuracy studies: Explanation and elaboration. BMJ Open 2016;6:e012799. [DOI] [PMC free article] [PubMed] [Google Scholar]
- 17. de Wit M, Kant H, Piersma SR et al. Colorectal cancer candidate biomarkers identified by tissue secretome proteome profiling. J Proteomics 2014;99:26–39. [DOI] [PubMed] [Google Scholar]
- 18. Piersma SR, Fiedler U, Span S et al. Workflow comparison for label‐free, quantitative secretome proteomics for cancer biomarker discovery: Method evaluation, differential analysis, and verification in serum. J Proteome Res 2010;9:1913–1922. [DOI] [PubMed] [Google Scholar]
- 19. Piersma SR, Warmoes MO, de Wit M et al. Whole gel processing procedure for GeLC‐MS/MS based proteomics. Proteome Sci 2013;11:17. [DOI] [PMC free article] [PubMed] [Google Scholar]
- 20. Perez‐Riverol Y, Csordas A, Bai J et al. The PRIDE Database and related tools and resources in 2019: Improving support for quantification data. Nucleic Acids Res 2019;47:D442–D450. [DOI] [PMC free article] [PubMed] [Google Scholar]
- 21. Alvarez MJ, Shen Y, Giorgi FM et al. Functional characterization of somatic mutations in cancer using network‐based inference of protein activity. Nat Genet 2016;48:838–847. [DOI] [PMC free article] [PubMed] [Google Scholar]
- 22. Uhlen M, Fagerberg L, Hallstrom BM et al. Proteomics. Tissue‐based map of the human proteome. Science 2015;347:1260419. [DOI] [PubMed] [Google Scholar]
- 23. Pham TV, Jimenez CR. An accurate paired sample test for count data. Bioinformatics 2012;28:i596–i602. [DOI] [PMC free article] [PubMed] [Google Scholar]
- 24. Ballehaninna UK, Chamberlain RS. The clinical utility of serum CA 19‐9 in the diagnosis, prognosis and management of pancreatic adenocarcinoma: An evidence based appraisal. J Gastrointest Oncol 2012;3:105–119. [DOI] [PMC free article] [PubMed] [Google Scholar]
- 25. Simpson RE, Yip‐Schneider MT, Wu H et al. Circulating thrombospondin‐2 enhances prediction of malignant intraductal papillary mucinous neoplasm. Am J Surg 2019;217:425–428. [DOI] [PMC free article] [PubMed] [Google Scholar]
- 26. Kim J, Bamlet WR, Oberg AL et al. Detection of early pancreatic ductal adenocarcinoma with thrombospondin‐2 and CA19‐9 blood markers. Sci Transl Med 2017;9:eeah5583. [DOI] [PMC free article] [PubMed] [Google Scholar]
- 27. Peng HY, Chang MC, Hu CM et al. Thrombospondin‐2 is a highly specific diagnostic marker and is associated with prognosis in pancreatic cancer. Ann Surg Oncol 2019;26:807–814. [DOI] [PubMed] [Google Scholar]
- 28. Berger AW, Schwerdel D, Reinacher‐Schick A et al. A blood‐based multi marker assay supports the differential diagnosis of early‐stage pancreatic cancer. Theranostics 2019;9:1280–1287. [DOI] [PMC free article] [PubMed] [Google Scholar]
- 29. Calabro NE, Kristofik NJ, Kyriakides TR. Thrombospondin‐2 and extracellular matrix assembly. Biochim Biophys Acta 2014;1840:2396–2402. [DOI] [PMC free article] [PubMed] [Google Scholar]
- 30. Farrow B, Berger DH, Rowley D. Tumor‐derived pancreatic stellate cells promote pancreatic cancer cell invasion through release of thrombospondin‐2. J Surg Res 2009;156:155–160. [DOI] [PubMed] [Google Scholar]
- 31. Veenstra VL, Damhofer H, Waasdorp C et al. Adam12 is a circulating marker for stromal activation in pancreatic cancer and predicts response to chemotherapy. Oncogenesis 2018;7:87. [DOI] [PMC free article] [PubMed] [Google Scholar]
- 32. Nie S, Lo A, Wu J et al. Glycoprotein biomarker panel for pancreatic cancer discovered by quantitative proteomics analysis. J Proteome Res 2014;13:1873–1884. [DOI] [PMC free article] [PubMed] [Google Scholar]
- 33. Le Large TYS, Bijlsma MF, Kazemier G et al. Key biological processes driving metastatic spread of pancreatic cancer as identified by multi‐omics studies. Semin Cancer Biol 2017;44:153–169. [DOI] [PubMed] [Google Scholar]
- 34. Adams JC, Lawler J. The thrombospondins. Int J Biochem Cell Biol 2004;36:961–968. [DOI] [PMC free article] [PubMed] [Google Scholar]
- 35. Bertin N, Clezardin P, Kubiak R et al. Thrombospondin‐1 and ‐2 messenger RNA expression in normal, benign, and neoplastic human breast tissues: Correlation with prognostic factors, tumor angiogenesis, and fibroblastic desmoplasia. Cancer Res 1997;57:396–399. [PubMed] [Google Scholar]
- 36. Kodama J, Hashimoto I, Seki N et al. Thrombospondin‐1 and ‐2 messenger RNA expression in invasive cervical cancer: Correlation with angiogenesis and prognosis. Clin Cancer Res 2001;7:2826–2831. [PubMed] [Google Scholar]
- 37. Caparello C, Meijer LL, Garajova I et al. Folfirinox and translational studies: Towards personalized therapy in pancreatic cancer. World J Gastroenterol 2016;22:6987–7005. [DOI] [PMC free article] [PubMed] [Google Scholar]
- 38. Ethun CG, Lopez‐Aguiar AG, Pawlik TM et al. Distal cholangiocarcinoma and pancreas adenocarcinoma: Are they really the same disease? A 13‐institution study from the US Extrahepatic Biliary Malignancy Consortium and the Central Pancreas Consortium. J Am Coll Surg 2017;224:406–413. [DOI] [PMC free article] [PubMed] [Google Scholar]
- 39. Soer E, Brosens L, van de Vijver M et al. Dilemmas for the pathologist in the oncologic assessment of pancreatoduodenectomy specimens: An overview of different grossing approaches and the relevance of the histopathological characteristics in the oncologic assessment of pancreatoduodenectomy specimens. Virchows Arch 2018;472:533–543. [DOI] [PMC free article] [PubMed] [Google Scholar]
- 40. Pomianowska E, Grzyb K, Westgaard A et al. Reclassification of tumour origin in resected periampullary adenocarcinomas reveals underestimation of distal bile duct cancer. Eur J Surg Oncol 2012;38:1043–1050. [DOI] [PubMed] [Google Scholar]
- 41. Meijer LL, Puik JR, Le Large TYS et al. Unravelling the diagnostic dilemma: A microRNA panel of circulating miR‐16 and miR‐877 as a diagnostic classifier for distal bile duct tumors. Cancers (Basel) 2019;11E1181. [DOI] [PMC free article] [PubMed] [Google Scholar]
- 42. Klett H, Fuellgraf H, Levit‐Zerdoun E et al. Identification and validation of a diagnostic and prognostic multi‐gene biomarker panel for pancreatic ductal adenocarcinoma. Front Genet 2018;9:108. [DOI] [PMC free article] [PubMed] [Google Scholar]
- 43. Weng TY, Wang CY, Hung YH et al. Differential expression pattern of THBS1 and THBS2 in lung cancer: Clinical outcome and a systematic‐analysis of microarray databases. PLoS One 2016;11:e0161007. [DOI] [PMC free article] [PubMed] [Google Scholar]
- 44. Kaur S, Kumar S, Momi N et al. Mucins in pancreatic cancer and its microenvironment. Nat Rev Gastroenterol Hepatol 2013;10:607–620. [DOI] [PMC free article] [PubMed] [Google Scholar]
- 45. Lee J, Lee J, Yun JH et al. DUSP28 links regulation of mucin 5b and mucin 16 to migration and survival of ASPC‐1 human pancreatic cancer cells. Tumour Biol 2016;37:12193–12202. [DOI] [PubMed] [Google Scholar]
Associated Data
This section collects any data citations, data availability statements, or supplementary materials included in this article.
Supplementary Materials
See http://www.TheOncologist.com for supplemental material available online.
Supplemental Appendices
Table S1 Supplementary peptide table 1
Table S2 Supplementary peptide table 2