

Abstract
Aims
This study aims to compare the clinical course of peripartum cardiomyopathy (PPCM) cohorts from Germany (G‐PPCM) and South Africa (SA‐PPCM) with fibrosis‐related markers to get insights into novel pathomechanisms of PPCM.
Methods and results
G‐PPCM (n = 79) and SA‐PPCM (n = 72) patients and healthy pregnancy‐matched women from Germany (n = 56) and South Africa (n = 40) were enrolled. Circulating levels of procollagen type‐I (PINP) and type‐III (PIIINP) N‐terminal propeptides, soluble ST2, galectin‐3, and full‐length and cleaved osteopontin (OPN) were measured at diagnosis (baseline) and 6 months of follow‐up. Both cohorts received standard heart failure therapy while anticoagulation therapy was applied in 100% of G‐PPCM but only in 7% of SA‐PPCM patients. In G‐PPCM patients, baseline left ventricular ejection fraction (LVEF) was lower, and outcome was better (baseline LVEF, 24 ± 8%, full recovery: 52%, mortality: 0%) compared with SA‐PPCM patients (baseline LVEF: 30 ± 9%, full recovery: 32%, mortality: 11%; P < 0.05). At baseline, PINP/PIIINP ratio was lower in SA‐PPCM and higher in G‐PPCM compared with respective controls, whereas total OPN was elevated in both collectives. Cleaved OPN, which increases PIIINP levels, is generated by thrombin and was reduced in patients receiving anticoagulation therapy. High baseline galectin‐3, soluble ST2, and OPN levels were associated with poor outcome in all PPCM patients.
Conclusions
SA‐PPCM patients displayed a more profibrotic biomarker profile, which was associated with a less favourable outcome despite better cardiac function at baseline, compared with G‐PPCM patients. Use of bromocriptine and anticoagulation therapy in G‐PPCM may counteract fibrosis and may in part be responsible for their better outcome.
Keywords: Peripartum cardiomyopathy, Fibrosis, Biomarker, Therapy, Outcome
1. Introduction
Peripartum cardiomyopathy (PPCM) is a rare disease, characterized by an onset of heart failure in women towards the end of pregnancy, during delivery, or within the first 6 months postpartum1. The incidence of PPCM worldwide is estimated to be one in 1000 pregnancies with the highest incidences reported in Africans and Afro‐Americans.2 The pathophysiology of PPCM involves increased oxidative stress, impaired angiogenesis, and activation of immune and inflammatory reactions.3 Cardiac fibrosis has been proposed to play an important role in the initiation and progression of several cardiac diseases,4 whereas the implication of cardiac fibrosis in the pathogenesis of PPCM is controversial.5, 6
Several studies have assessed the association of collagen metabolism‐related biomarkers procollagen type‐I N‐terminal propeptide (PINP) and procollagen type‐III N‐terminal propeptide (PIIINP) in the diagnosis and prognosis of cardiac diseases.7 Moreover, increased levels of galectin‐3 (Gal3) and soluble ST2 (sST2), both contemporary markers of cardiac inflammation and fibrosis, have a predictive value for adverse outcome in heart failure patients.8, 9 Osteopontin (OPN) has been shown to enhance inflammation and fibrosis10 and is essential for collagen secretion. Thereby, OPN causes an increase of myocardial stiffness in heart failure patients.11 Furthermore, there is evidence that specifically the thrombin‐cleaved N‐terminal OPN leads to myocardial fibrosis by enhancing the synthesis of collagen type III.12
While in most PPCM patients, cardiac function recovers, some patients progress into irreversible heart failure with high morbidity, the need for left ventricular assist device (LVAD), heart transplantation, and high mortality (1.4% to 28%).13, 14, 15, 16, 17, 18 To date, it is hard to predict whether a patient will recover or remain in heart failure, as no prognostic biomarker exists for PPCM.
Comparison between PPCM collectives of different ethnic backgrounds suggests that African PPCM patients may have a different pathophysiology and a lower chance for full recovery, compared with non‐African patients,14, 15, 19 but a direct comparison of different ethnic cohorts has not been performed yet. Thus, we aimed to directly compare the outcome of two large PPCM registries, one with patients from South Africa (SA‐PPCM), including only patients of African ethnicity, and one from Germany (G‐PPCM), with only Caucasian patients included. In these cohorts, we assessed clinical and medical history and outcome, as well as circulating factors of cardiac fibrosis, and compared them with pregnancy‐matched healthy controls of each corresponding ethnic background.
2. Methods
2.1. Study design and patient enrolment
This study was approved by the Human Research Ethics Committee of the University of Cape Town, Cape Town, SA (R033/2013) and by the local ethics committee of Hannover Medical School, Hanover, G (3242‐2016). The study complies with the Declaration of Helsinki, and all patients and controls gave written informed consent. Seventy‐two PPCM patients (SA‐PPCM) were enrolled at Groote Schuur Hospital (University of Cape Town, SA), and 79 patients (G‐PPCM) were recruited at Hannover Medical School (Hannover Medical School, G). German patients of African origin were excluded from this study as well as SA‐PPCM with Caucasian background, to allow a distinction between these two ethnicities.
Echocardiography with Doppler colour flow mapping was performed to measure left ventricular dimensions and function according to the American Society of Echocardiography guidelines.20
Blood pressure and heart rate were measured non‐invasively, and the New York Heart Association (NYHA) functional class of each patient at baseline and follow‐up visit was evaluated by a physician who was provided with the clinical data but blinded to the laboratory results.
2.2. Analysis of outcome
The follow‐up period is the duration of the pregnancy for patients who presented peripartum, plus the 6 months of follow‐up visit, which was accomplished between 3 and 7 months after diagnosis. Poor outcome was defined as death, heart transplantation, LVAD implantation, or left ventricular ejection fraction (LVEF) ≤35% at 6 months as previously described.21 Recovery was defined as gain of 10% in LVEF and LVEF ≥35% at 6 months of follow‐up; full left ventricular recovery was defined as LVEF ≥50% at 6 months of follow‐up.
2.3. Biomarkers measurements
Plasma and serum were collected at baseline and at the 6 months of follow‐up visit. Aliquots were stored at −80°C. N‐terminal pro‐brain natriuretic peptide (NT‐proBNP) plasma levels were measured by routine laboratory workup as described.22 The measurement of plasma Gal3 (Human Galectin‐3 Platinum Elisa, eBiosciences, San Diego, USA), sST2 (Presage® ST2 Assay, Critical Diagnostics, San Diego, USA), serum PINP (PINP Elisa Assay, Cloud‐Clone Corp, Texas, USA), and serum PIIINP (PIIINP Elisa Assay, Cloud‐Clone Corp) was conducted according to the manufacturer's instructions. OPN was measured using Bio‐Plex Pro Assay (Human Cancer Biomarker Panel 1, Bio‐Rad, Hercules. USA).
In addition, cleavage of OPN by thrombin was measured by western blot [Anti‐Human Osteopontin (O‐17) Rabbit IgG Affinity Purify, Immuno‐Biological Laboratories Co. Japan].
We recruited 96 healthy pregnancy‐matched women without any history of cardiac disease and with a normal physical examination. Forty controls were recruited in SA, of whom 17 women were in the prepartum period and 23 were in the early postpartum period. Fifty‐six healthy women were recruited in Germany. All German controls were in the postpartum period.
2.4. Statistical analysis
Data were analysed using GraphPad Prism version 7.03 for Windows (La Jolla, California, USA) and SPSS (IBM, NYC, USA) version 24 for Windows. Continuous data are expressed as mean ± standard deviation or median (range) and categorical data as frequencies (%). Normal distribution was assessed using D'Agostino and Pearson omnibus normality test. χ 2 test and Fisher's exact test were used for discrete variables; unpaired t‐test with Welch's correction or Mann–Whitney U test were used for continuous variables. As follow‐up data were not available for all patients, some statistical analyses were only performed between the control and patients groups. For multiple‐group comparison, we used one‐way ANOVA with Bonferroni post‐test or Kruskal–Wallis with Dunn's post‐test for continuous variables and χ 2 test for discrete variables. A P‐value of less than 0.05 was considered statistically significant.
3. Results
3.1. Patient characteristics
A total of 151 patients (n = 72 SA‐PPCM and n = 79 patients G‐PPCM) with confirmed diagnosis for PPCM23 were analysed (Figure 1 A and B). Comparison between the two cohorts showed that the mean LVEF, heart rate, and HIV rates in SA‐PPCM at time of diagnosis were significantly higher than in G‐PPCM (Table 1). G‐PPCM were older, presented with higher left ventricular end‐diastolic‐diameter, higher rates of hypertensive disorders (including chronic hypertension and hypertensive disorders of pregnancy), hypercholesterolaemia, family history for cardiovascular disease, previous caesarean section, and more patients in NYHA class III/IV than SA‐PPCM (Table 1). All other clinical baseline characteristics, including NT‐proBNP levels, were comparable among G‐PPCM and SA‐PPCM patient cohorts (Table 1). Medical records revealed that 100% of G‐PPCM and 75% of SA‐PPCM received standard therapy for heart failure (beta‐blocker and angiotensin‐converting enzyme inhibitors/angiotensin II receptor blocker). In addition, all G‐PPCM obtained bromocriptine and anticoagulation therapy [prophylactic or therapeutic, low molecular weight heparin (LMWH), direct oral anticoagulants, and Vitamin K antagonists], while only 26% of SA‐PPCM obtained bromocriptine, and only 7% received anticoagulation (Table 1). Ventricular assist device, implantable cardioverter defibrillator/cardiac resynchronization therapy defibrillator implantation, and percutaneous mechanical circulatory support were only applied in the G‐PPCM cohort (Table 1).
Figure 1.
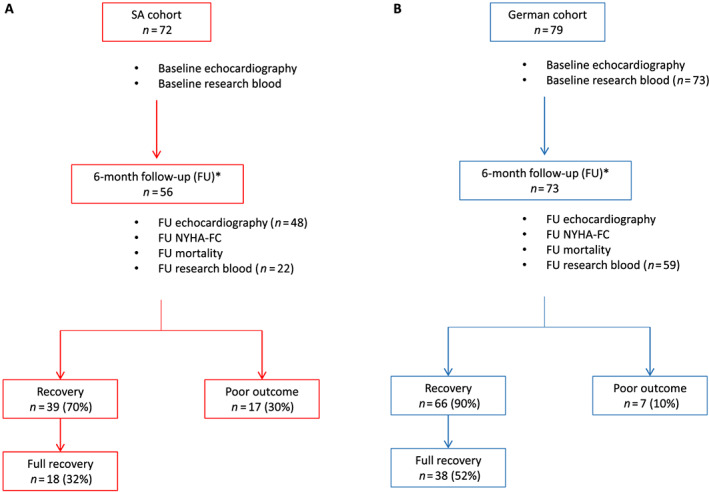
Flow chart of (A) South African (SA) and (B) German (G) cohorts. Seventy‐two and 79 peripartum cardiomyopathy (PPCM) patients were recruited in SA and G, respectively. Baseline clinical and echocardiography information was available for all patients. Research blood samples were collected for all SA‐PPCM patients, but only 73 G‐PPCM patients had blood collected at baseline. Fifty‐six SA‐PPCM and 73 G‐PPCM patients attended their 6 months of follow‐up (FU) visit, and FU research blood was taken for 22 SA‐PPCM and 59 G‐PPCM patients. Recovery: left ventricular ejection fraction (LVEF) >35%; full recovery: LVEF ≥50%; and poor outcome: LVEF ≤35 or death or left ventricular assist device at 6 months of FU. *FU between 3 and 7 months. NYHA‐FC, New York Heart Association functional class.
Table 1.
Baseline maternal characteristics of study population (n = 151)
| Clinical characteristic | All (n = 151) | SA (n = 72) | G (n = 79) | P‐value |
|---|---|---|---|---|
| Age (years) | 31 ± 6 | 29 ± 6 | 34 ± 5 | <0.0001 |
| Parity, median (range) | 2 (0–7) | 2 (0–6) | 2 (1–7) | 0.3216 |
| BMI (kg/m2) | 26 (17–52) | 26 (17–52) | 27 (18–50) | 0.2442 |
| Systolic blood pressure (mmHg) | 110 (80–168) | 111 (80–168) | 110 (86–145) | 0.4925 |
| Diastolic blood pressure (mmHg) | 74 (50–110) | 70 (50–110) | 75 (50–101) | 0.9976 |
| Heart rate (bpm) | 91 ± 16 | 96 ± 17 | 87 ± 15 | 0.0008 |
| NYHA functional class, n (%) | ||||
| I/II | 50 (34) | 35 (49) | 15 (20) | 0.0002 |
| III/IV | 98 (66) | 37 (51) | 61 (80) | |
| Haemoglobin (g/dL) | 11 ± 2 | 11 ± 2 | 12 ± 2 | 0.2357 |
| NT‐proBNP (ng/L), median (range) | 3133 (8–21 290) | 4440 (8–16 026) | 2988 (175–21 290) | 0.6572 |
| Echocardiography | ||||
| LVEDD/BSA (mm/m2) | 33 ± 5 | 35 ± 5 | 32 ± 4 | 0.0009 |
| LVESD/BSA (mm/m2) | 28 ± 5 | 29 ± 5 | 27 ± 5 | 0.0641 |
| Ejection fraction (%) | 27 ± 9 | 30 ± 9 | 24 ± 8 | <0.0001 |
| E velocity (cm/s) | 89 ± 34 | 90 ± 38 | 87 ± 24 | 0.7056 |
| A velocity (cm/s) | 54 ± 26 | 51 ± 28 | 60 ± 23 | 0.1716 |
| E/A (ratio) | 2.1 ± 1.7 | 2.4 ± 2.0 | 1.6 ± 0.6 | 0.1062 |
| General medical history, n (%) | ||||
| Hypertensive disorders | 37 (26) | 13 (18) | 24 (35) | 0.0229 |
| Hypercholesterolaemia | 11 (7) | 1 (1) | 10 (13) | 0.0093 |
| HIV | 21 (14) | 21 (29) | 0 (0) | <0.0001 |
| Family history of CVD | 34 (24) | 10 (14) | 24 (35) | 0.0053 |
| Onset of clinical symptoms, n (%) | ||||
| Prepartum | 7 (5) | 5 (7) | 2 (3) | 0.2721 |
| <1 week postpartum | 27 (19) | 8 (11) | 19 (26) | 0.0315 |
| ≥1 week postpartum | 110 (76) | 59 (82) | 51 (71) | |
| Caesarian section, n (%) | 50 (46) | 24 (35) | 26 (65) | 0.0048 |
| Medication, n (%) | ||||
| Beta‐blocking agents | 130 (86) | 54 (75) | 76 (96) | 0.0002 |
| ACE‐inhibitors/ARB | 133 (88) | 54 (75) | 79 (100) | <0.0001 |
| Dobutamin | 3 (2) | 0 (0) | 3 (4) | 0.2466 |
| Bromocriptine | 97 (64) | 19 (26) | 78 (100) | <0.0001 |
| Oral anticoagulation (DOACs, Vitamin K antagonists) | 23 (15) | 5 (7) | 18 (23) | 0.0114 |
| LMWH (pat. with OAC excluded) | 61 (40) | 0 (0) | 61 (100) | <0.0001 |
| Devices/MCS, n (%) | ||||
| VAD | 2 (1) | 0 (0) | 2 (3) | 0.4977 |
| ICD/CRT‐D | 5 (3) | 0 (0) | 5 (6) | 0.0597 |
| Other (ECMO, impella) | 2 (1) | 0 (0) | 2 (3) | 0.4977 |
| Heart transplantation, n (%) | 0 (0) | 0 (0) | 0 (0) | NA |
Continuous data were expressed as mean ± standard deviation or median and range, according to normality of distribution. Comparison between the two groups was performed using Student's t‐test for Gaussian distributed data and the Mann–Whitney U test where at least one column was not normally distributed. Categorical variables are presented as frequencies (percentages) and compared using Fisher's exact tests. ACE‐inhibitors/ARB, angiotensin‐converting enzyme inhibitors/angiotensin II receptor blocker; BMI, body mass index; BSA, body surface area; CVD, cardiovascular disease; DOACs, direct oral anticoagulants; ECMO, extracorporeal membrane oxygenation; G, Germany; ICD/CRT‐D, implantable cardioverter defibrillator/cardiac resynchronization therapy defibrillator; LMWH, low molecular weight heparin; LVEDD, left ventricular end‐diastolic diameter; LVESD, left ventricular end‐systolic diameter; MCS, mechanical circulatory support; NT‐proBNP, N‐terminal pro‐brain natriuretic peptide; NYHA, New York Heart Association; OAC, oral anticoagulation; SA, South Africa; VAD, ventricular assist device.
3.2. Despite lower cardiac function at baseline in the German‐ compared to the South African PPCM cohort, the 6 months recovery rate is better in the German cohort
Of the 151 recruited patients, 6 months of follow‐up data was available for 129 patients (56 SA‐PPCM and 73 G‐PPCM) (Figure 1 A and B). G‐PPCM displayed a higher rate of recovery at follow‐up compared with SA‐PPCM (G‐PPCM: 90%, n = 66/73; SA‐PPCM: 70%, n = 39/56; P = 0.0053) (Figure 1 ). In addition, there were more G‐PPCM with full cardiac recovery compared with SA‐PPCM (G‐PPCM: 52%, n = 38/73; SA‐PPCM: 32%, n = 18/56; P = 0.0314) (Figure 1 ). In turn, almost three times more SA‐PPCM were in terminal heart failure or had died compared with G‐PPCM (SA‐PPCM: 30%, n = 17/56, mortality rate: 14%, n = 8/56 died; G‐PPCM: 10%, n = 7/73, mortality rate: 0%, n = 0/73) (Figure 1 ). Most clinical characteristics were similar between recovered and non‐recovered patients of both cohorts, with only LVEF being lower and left ventricular end‐systolic diameter being larger in patients who did not recover (Table 2).
Table 2.
Baseline characteristics for patients with recovery of left ventricular ejection fraction vs. patients with non‐recovery of left ventricular ejection fraction (n = 129)
| Characteristic | Recovered PPCM (n = 105) | Non‐recovered PPCM (n = 24) | ||||
|---|---|---|---|---|---|---|
| All (n = 105) | SA (n = 39) | G (n = 66) | All (n = 24) | SA (n = 17) | G (n = 7) | |
| Clinical | ||||||
| Age (years) | 32 ± 6 | 29 ± 6§§§ | 34 ± 5$$ | 30 ± 5 | 29 ± 5 | 32 ± 6 |
| Parity, median (range) | 2 (1–7) | 2 (1–6) | 2 (1–7) | 2 (0–4) | 2 (0–4) | 3 (1–4) |
| BMI (kg/m2) | 26 (17–50) | 26 (17–43) | 26 (19–50) | 26(18–38) | 24 (18–33) | 27 (18–38) |
| Systolic blood pressure (mmHg) | 110 (82–168) | 110 (82–168) | 111 (86–145) | 11 (80–160) | 110 (80–160) | 110 (90–140) |
| Diastolic blood pressure (mmHg) | 75 (50–110) | 75 (50–110) | 75 (50–100) | 70 (60–101) | 70 (60–100) | 74 (60–101) |
| Heart rate (bpm) | 89 ± 16 | 95 ± 18 | 86 ± 14$$ | 97 ± 17 | 101 ± 15 | 92 ± 18 |
| NYHA functional class, n (%) | ||||||
| I/II | 35 (34) | 23 (59)§§§ , # | 12 (19) | 8 (34) | 5 (29) | 3 (43) |
| III/IV | 68 (66) | 16 (41) | 52 (81) | 16 (66) | 12 (71) | 4 (57) |
| Haemoglobin (g/dL) | 12 ± 2 | 12 ± 2 | 12 ± 2 | 12 ± 2 | 11 ± 2 | 12 ± 2 |
| Echocardiography | ||||||
| LVEDD/BSA (mm/m2) | 33 ± 5 | 35 ± 5§§§ | 31 ± 4 | 35 ± 6 | 35 ± 6 | 36 ± 7 |
| LVESD/BSA (mm/m2) | 27 ± 4** | 29 ± 5 | 26 ± 4 | 31 ± 6 | 31 ± 6 | 33 ± 8 |
| Ejection fraction (%) | 28 ± 9** | 32 ± 9§§§ , £££ , # | 25 ± 8 | 22 ± 10 | 25 ± 9 | 15 ± 7 |
| E velocity (cm/s) | 87 ± 34 | 87 ± 42 | 86 ± 25 | 94 ± 30 | 96 ± 32 | 86 ± 12 |
| A velocity (cm/s) | 52 ± 26 | 44 ± 26 | 61 ± 24 | 58 ± 23 | 59 ± 25 | 50 ± 5 |
| E/A (ratio) | 2.2 ± 2.0 | 2.8 ± 2.5 | 1.6 ± 0.76 | 1.9 ± 1.1 | 1.9 ± 1.2 | 2.8 ± 0.0 |
| Co‐morbidities, n (%) | ||||||
| Chronic hypertension | 29 (30) | 9 (23) | 20 (35) | 4 (17) | 2 (11) | 2 (33) |
| Hypercholesterolaemia | 9 (9) | 1 (3) | 8 (12) | 0 (0) | 0 (0) | 0 (0) |
| HIV | 12 (12) | 12(31)§§§ | 0 (0)$$$ | 6 (25) | 6 (35) | 0 (0) |
| Family history of CVD | 24 (25) | 2 (5)§§§ | 22 (38) | 4 (18) | 3 (17) | 1 (20) |
| Onset of the clinical symptoms, n (%) | ||||||
| Prepartum | 3 (3) | 2 (5) | 1 (2) | 2 (9) | 1 (6) | 1 (20) |
| <1 week postpartum | 19 (19) | 2 (5)§§ | 17 (26) | 2 (9) | 1 (6) | 1 (20) |
| ≥1 week postpartum | 80 (78) | 35 (90)§ | 45 (71) | 18 (82) | 15 (88) | 3 (60) |
| Caesarian section, n (%) | 34 (44) | 12 (30)§§ | 22 (63)$$ | 5 (31) | 3 (21)€ | 2 (100) |
Continuous data were expressed as mean ± standard deviation or median and range, according to normality of distribution; categorical variables were expressed as frequencies (percentages). BMI, body mass index; BSA, body surface area; CVD, cardiovascular disease; G, Germany; LVEDD, left ventricular end‐diastolic diameter; LVESD, lest ventricular end‐systolic diameter; NYHA, New York Heart Association; PPCM, peripartum cardiomyopathy; SA, South Africa.
P < 0.05.
P < 0.01 ‘All recovered’ vs. ‘All non‐recovered’.
P < 0.01, using Student's t‐test for Gaussian distributed data and the Mann–Whitney U test where at least one column was not normally distributed for comparison of ‘All recovered’ vs. ‘All non‐recovered’.
P < 0.05.
P < 0.01.
P < 0.001 ‘SA recovered’ vs. ‘G recovered’.
P < 0.05.
P < 0.01.
P < 0.001 ‘G recovered’ vs. ‘SA non‐recovered’.
P < 0.001 ‘SA recovered’ vs. ‘G non‐recovered’.
P < 0.05 ‘SA recovered’ vs. ‘SA non‐recovered’.
P < 0.05.
P < 0.001 ‘SA‐non‐recovered’ vs. ‘G non‐recovered’ using Kruskal–Wallis test and Dunn's multiple comparison test for continuous data and χ 2 test for comparison of categorical variables.
3.3. Baseline cardiac function, heart dimensions, and heart rate predict outcome in German and South African peripartum cardiomyopathy
Comparing clinical and medical history between survivors and PPCM patients who either died or underwent LVAD implantation revealed that an increased heart rate, a higher NYHA functional class, and treatment with dobutamine were associated with an adverse outcome in both collectives, whereas treatment with bromocriptine and treatment with beta‐blocker were associated with a better outcome (Table 3). However, these results could not be confirmed by logistic regression analyses, due to the low number of patients with poor outcome. Interestingly, HIV seems not to be associated with poor outcome in the SA cohort (Supporting Information, Table S2).
Table 3.
Baseline characteristics for survivors and non‐survivors/LVAD patients (n = 151)
| Clinical characteristic | Survivors (n = 141) | Non‐survivors and LVAD (n = 10) | P‐value |
|---|---|---|---|
| Age (years) | 31 ± 6 | 31 ± 6 | 0.6186 |
| Parity, median (range) | 2 (1–7) | 2 (0–4) | 0.6918 |
| BMI (kg/m2) | 26 (17–52) | 27 (23–33) | 0.6570 |
| Systolic blood pressure (mmHg) | 112 (82–168) | 103 (80–136) | 0.2141 |
| Diastolic blood pressure (mmHg) | 75 (50–110) | 70 (60–100) | 0.8601 |
| Heart rate (bpm) | 90 ± 16 | 106 ± 10 | 0.0110 |
| NYHA functional class, n (%) | |||
| I/II | 50 (36) | 0 (0) | 0.0165 |
| III/IV | 88 (64) | 10 (100) | |
| Haemoglobin (g/dL) | 11 ± 2 | 12 ± 2 | 0.5454 |
| Echocardiography | |||
| LVEDD/BSA (mm/m2) | 33 ± 5 | 35 ± 7 | 0.8705 |
| LVESD/BSA (mm/m2) | 28 ± 5 | 30 ± 7 | 0.4092 |
| Ejection fraction (%) | 27 ± 9 | 28 ± 17 | 0.9065 |
| E velocity (cm/s) | 88 ± 34 | 96 ± 29 | 0.6173 |
| A velocity (cm/s) | 54 ± 27 | 57 ± 21 | 0.8055 |
| E/A (ratio) | 2.2 ± 1.8 | 1.8 ± 0.3 | 0.9693 |
| Deceleration time (ms) | 104 ± 93 | 162 ± 36 | 0.2961 |
| Co‐morbidities, n (%) | |||
| Chronic hypertension | 37 (28) | 0 (0) | 0.1120 |
| Hypercholesterolaemia | 11 (8) | 0 (0) | 1.0000 |
| HIV | 18 (13) | 3 (30) | 0.1504 |
| Family history of CVD | 31 (24) | 3 (33) | 0.4503 |
| Onset of the clinical symptoms, n (%) | |||
| Prepartum | 6 (4) | 1 (10) | 0.3937 |
| <1 week postpartum | 25 (19) | 2 (20) | 1.0000 |
| ≥1 week postpartum | 103 (77) | 7 (70) | |
| Caesarian section, n (%) | 47 (47) | 3 (33) | 0.5004 |
| Medical therapy, n (%) | |||
| Beta‐blocker | 125 (89) | 5 (50) | 0.0052 |
| ACE‐inhibitors/ARB | 126 (89) | 7 (70) | 0.1002 |
| Bromocriptine | 94 (67) | 3 (30) | 0.0341 |
| Dobutamine | 1 (1) | 2 (20) | 0.0115 |
| Biomarkers, median (range) | |||
| Galectin‐3 (ng/mL) | 7.97 (2.11–42.5) | 14.70 (10.1–37.1) | 0.0002 |
| sST2 (ng/mL) | 27.11 (2.79–297.6) | 55.39 (33.6–191.6) | 0.0037 |
| PINP (ng/mL) | 14.78 (2.40–57.0) | 8.39 (2.40–17.3) | 0.0117 |
| PIIINP (ng/mL) | 117.2 (8.49–305.1) | 161.6 (78.9–277.2) | 0.0965 |
| PINP/PIIINP | 0.126 (0.01–1.36) | 0.054 (0.01–0.122) | 0.0035 |
| OPN (pg/mL) | 41 271 (355.3–201 216) | 84 285 (20 267–329 213) | 0.0257 |
Continuous data were expressed as mean ± standard deviation or median and range, according to normality of distribution. Comparison between the two groups was performed using Student's t‐test for Gaussian distributed data and the Mann–Whitney U test where at least one column was not normally distributed. Categorical variables are presented as frequencies (percentages) and compared using Fisher's exact tests. ACE‐inhibitors/ARB, angiotensin‐converting enzyme inhibitors/angiotensin II receptor blocker; BMI, body mass index; BSA, body surface area; CVD, cardiovascular disease; LVAD, left ventricular assist device; LVEDD, left ventricular end‐diastolic diameter; LVESD, lest ventricular end‐systolic diameter; NYHA, New York Heart Association; OPN, osteopontin; PIIINP, procollagen type‐III N‐terminal propeptide; PINP, procollagen type‐I N‐terminal propeptide; sST2, soluble ST2.
3.4. Comparison of circulating biomarkers for fibrosis in healthy pregnancy‐matched South African and German controls
Because circulating biomarker levels may vary between subjects with different ethnic backgrounds, blood samples from pregnancy‐matched and postpartum‐matched healthy controls with comparable ethnic background were recruited for each cohort (SA controls and G controls). Levels of Gal3 and PINP, as well as the ratio between PINP and PIIINP, were higher, levels of sST2 and PIIINP were similar, and total OPN levels were lower in pregnancy‐matched SA controls compared with pregnancy‐matched G controls (Supporting Information, Table S1 ). Due to these differences in circulating biomarker profiles between pregnancy‐matched healthy controls of SA and G ethnicity, all biomarker measurements in PPCM were always compared with their respective pregnancy‐matched control collectives.
3.5. Galectin‐3 and soluble ST2 in South African and German peripartum cardiomyopathy patients
Plasma Gal3 levels were not different between SA controls and SA‐PPCM at baseline and follow‐up (Figure 2 A). In G‐PPCM, Gal3 levels were increased at baseline compared with G controls (Figure 2 A). Serum sST2 levels were not statistically different in SA‐PPCM and in G‐PPCM at baseline and follow‐up compared with respective controls (Figure 2 B).
Figure 2.
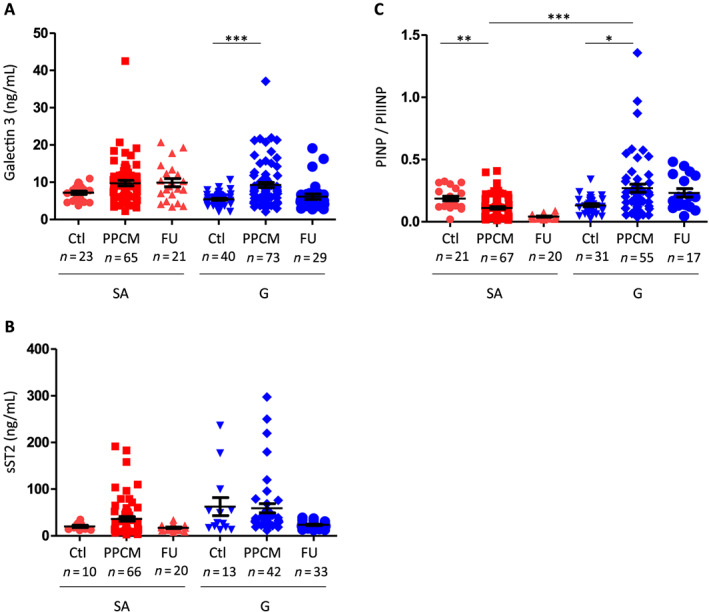
Galectin‐3, soluble ST2 (sST2), osteopontin levels, and ratio of procollagen type‐I N‐terminal propeptide (PINP) to procollagen type‐III N‐terminal propeptide (PIIINP) levels in German (G) and South African (SA) controls and peripartum cardiomyopathy (PPCM) patients at baseline and follow‐up (FU). Bar graphs display (A) galectin‐3 plasma and (B) sST2 serum levels in G‐PPCM and SA‐PPCM patients at baseline and after 6 months of FU as well as in their respective controls. (C) Ratio of PINP to PIIINP levels in G and SA controls and PPCM patients at baseline and FU. The FU data are only represented but were not compared with the control and PPCM groups, as described in the Methods section. A number of subjects are indicated, * P < 0.05, ** P < 0.01, and *** P < 0.001 using Kruskal–Wallis test and Dunn's multiple comparison test.
3.6. PINP, PIIINP, and PINP/PIIINP ratio in South African and German peripartum cardiomyopathy patients
Procollagen type‐I N‐terminal propeptide did not differ between PPCM patients and controls in both collectives nor between G‐PPCM and SA‐PPCM (Supporting Information, Table S3).
Procollagen type‐III N‐terminal propeptide levels were increased at baseline in SA‐PPCM patients compared with their controls (Supporting Information, Table S3). In G‐PPCM, PIIINP levels were lower compared with G controls (Supporting Information, Table S3). Accordingly, the ratio of PINP to PIIINP (PINP/PIIINP) was significantly lower at baseline in SA‐PPCM compared with SA‐controls, while it was higher at baseline in G‐PPCM, compared with G controls (Figure 2 C).
3.7. Total osteopontin and cleaved osteopontin in South African and German peripartum cardiomyopathy patients
Circulating levels of total OPN were elevated in both cohorts at baseline compared with their healthy controls (Figure 3 A). Western blot analyses showed that the thrombin‐cleaved N‐terminal OPN fragment was elevated in PPCM patients not treated with anticoagulation therapy, whereas it was comparable with healthy postpartum controls in PPCM patients treated with anticoagulation therapy (Figure 3 B and C).
Figure 3.
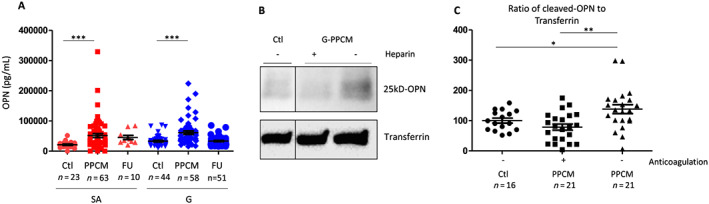
Total and cleaved N‐terminal osteopontin (OPN) levels in German (G) and South African (SA) peripartum cardiomyopathy (PPCM) patients and respective controls and in relation to anticoagulation therapy. Bar graphs display (A) total OPN plasma levels in G‐PPCM and SA‐PPCM patients at baseline and after 6 months of follow‐up (FU) as well as in their respective controls. The follow‐up data are only represented but were not compared with the control and PPCM groups, as described in the Methods section. Western blots from (B) serum samples and (C) quantitative protein levels of 25 kDa of cleaved N‐terminal OPN normalized for transferrin content. A number of subjects are indicated, * P < 0.05, ** P < 0.01, and *** P < 0.001 vs. Ctrl using one‐way ANOVA with Bonferroni post hoc test.
3.8. Analyses of the role of ethnicity among the South African collective
Patients from the SA cohort were from two different ethnic groups, with 45 Black African patients (62%) and 27 coloured patients (37%). The coloured patient population is from a mixed ancestry (a population group of admixed ethnicity including Indigenous African European and Asian origins), and the Black African patients are non‐admixed Indigenous African women (a population group of native or Indigenous Africans with various ethnicities ranging from Zulu to Xhosa). PINP levels were lower in SA Black African patients when compared with other SA‐PPCM from mixed ancestry (P = 0.0416). Interestingly, both groups presented with no difference in baseline and follow‐up cardiac function (Supporting Information, Table S4).
3.9. Serum markers for fibrosis may predict adverse outcome in South African peripartum cardiomyopathy patients
During the 6 months of follow‐up period, eight patients from the SA cohort had died, and two patients from the G cohort underwent LVAD implantation. All non‐surviving SA‐PPCM and LVAD G‐PPCM presented with heart failure NYHA class III/IV (P = 0.0156) at time of diagnosis, but baseline LVEF was not different compared with mean LVEF of the whole PPCM cohort (Table 3). Significant differences in the baseline biomarker levels between deceased/LVAD patients and all other PPCM patients were seen in plasma Gal3 (P = 0.0002), serum sST2 (P = 0.0037), and plasma OPN (P = 0.0257) levels, which were all elevated in deceased/LVAD patients (Table 3). Serum PINP levels and PINP/PIIINP ratio were significantly decreased in the non‐survivors/LVAD vs. survivors (P = 0.0117 and P = 0.0035), whereas PIIINP levels were not different between the two groups. Interestingly, significant differences in the baseline biomarker levels (Gal3, sST2, PINP, and OPN) between recovered patients and non‐recovered PPCM patients were only seen in SA cohort (Supporting Information, Table S5). In addition, higher NT‐proBNP levels seem to be associated with mortality in SA‐PPCM (1654 ± 1444 ng/L in survivors vs. 4332 ± 3308 ng/L in non‐survivors, P = 0.0173). Because no G‐PPCM in this cohort died, this association could not be performed in the G cohort.
4. Discussion
The present study is the first to directly compare PPCM patients of African or Caucasian origin in a prospective manner with regard to baseline clinical presentation, treatment, outcome, and biomarker profiles. The study confirmed previous observations15 that African descent PPCM patients seem to have a lower recovery rate, despite an initial better cardiac function and lower NYHA class. It also showed that clinical presentation differs with regard to heart rate (higher in SA‐PPCM patients) and co‐morbidities, that is, markedly higher HIV infection rate but lower rate of hypertension associated with pregnancy and hypercholesterolaemia, compared with G‐PPCM.
Beside potential influences by the genetic background, the higher infection rate of HIV, which is a well‐described difference between these two populations (2016. Global Aids Update 2016. http://www.unaids.org/en/resources/documents/2016/Global‐AIDS‐update‐2016), might be another explanation for worse outcome in SA‐PPCM. However, previous analyses between African HIV‐positive and HIV‐negative PPCM patients17 revealed no influence of HIV infection on the outcome of PPCM patients, which was confirmed in the present study.
Another explanation might derive from differences in diagnosis and treatment. In fact, G‐PPCM appear to be diagnosed earlier after delivery, a feature known to increase the chance for early treatment and for recovery.24 In addition, G‐PPCM had access to device therapy, which are lifesaving tools and which may also explain better recovery and lower adverse events and mortality in the G cohort. Finally, the vast majority of G‐PPCM (96%) were treated according to the BOARD system,25 that is, with beta‐blocker, angiotensin‐converting enzyme inhibitors/angiotensin II receptor blocker, bromocriptine, and anticoagulation (LMWH), while substantially fewer patients in the SA cohort (26%) obtained this treatment. In SA, bromocriptine is often not prescribed if formula milk cannot be provided by the local clinic. Mixed feeding is not encouraged in HIV‐positive mothers as it facilitates HIV transmission.
Nevertheless, we cannot exclude a different disease pathogenesis between the two populations. We thus analysed circulating biomarkers associated with cardiac remodelling, inflammation, and fibrosis, that is, Gal3, sST2, PINP, PIIINP, and OPN, in comparison with respective healthy postpartum controls from each ethnic background.
Procollagen type‐III N‐terminal propeptide appeared significantly up‐regulated at diagnosis in SA‐PPCM but not in G‐PPCM; Gal3 and sST2 showed high overlaps between PPCM patients and respective controls. Thus, Gal3 and sST2 seem not to be suited as diagnostic markers, and for PIIINP, further data are needed to explore its value as a potential diagnostic marker for PPCM specifically of African ethnics. All measured biomarkers except PIINP appeared to differentiate between the survivors and non‐survivors groups or LVAD implantation. However, it is important to note that information on prognosis derive mainly from SA‐PPCM patients, as the number of patients with adverse outcome in the G‐PPCM was very low and further analyses in larger cohorts also of different ethnic background are needed to confirm a potential value of Gal3, sST2, PINP, and OPN as prognostic biomarkers.
The differential and completely opposite expression of collagen I and III in both cohorts is interesting and pinpoints possible ethnicity‐specific pathomechanisms between African and non‐African patients.
Because of PPCM incidence being the highest in Nigeria, Haiti, and SA, we thought for decades that PPCM was a ‘Black’ ethnicity linked disease. This assumption is wrong as PPCM is associated with different ethnic groups.2 However, the role of ethnicity in the pathogenesis of PPCM has never been studied. In the ARIC study, the authors showed that Black patients will preferentially develop eccentric hypertrophy rather than concentric hypertrophy, which is mainly presented by White patients.26 It has been suggested that eccentric remodelling in Black patients involves cardiomyocyte death and replacement fibrosis, which is characterized by an increase of collagen III.27 On the other hand, concentric left ventricular remodelling is consecutive to inflammation, cardiomyocytes hypertrophy, and reactive fibrosis,28 which preferentially promote collagen I to collagen III expression.29
Thus, the collagen profiling might explain different recovery rate in the two collectives as the consequence of different remodelling in both populations suffering from the same disease. According to this hypothesis, lower recovery rates in the SA collective might be due to more cardiac tissue loss and replacement fibrosis, while better recovery and reversibility of the disease in the G‐PPCM collective are associated with transient reactive fibrosis. However, more sophisticated imaging data would be needed to confirm the nature of cardiac fibrosis in PPCM patients.
Osteopontin has been shown to promote myocardial stiffness in heart failure patients.11 Furthermore, OPN promotes cardiac fibrosis via up‐regulation of microRNA‐21 in fibroblasts.30 Here, we report that OPN is up‐regulated in PPCM patients from both collectives at baseline. More recently, especially the thrombin‐cleaved N‐terminal OPN was shown to induce myocardial fibrosis by enhancing the synthesis of PIIINP.12 In the present study, we observed that plasma levels of thrombin‐cleaved N‐terminal OPN were reduced in PPCM patients treated with anticoagulation (please note that anticoagulation included only LMWH, direct oral anticoagulants, and Vitamin K antagonists but not platelet aggregation inhibitors). Better outcomes in G‐PPCM may be explained at least in part by consistent application of anticoagulation, leading to lower levels of the profibrotic PIIINP, pointing to lower fibrotic activity. In turn, as thrombin‐cleaved OPN induces PIIINP and anticoagulation was not used in most SA‐PPCM patients, this may explain the higher levels of PIIINP observed in SA‐PPCM patients, which might subsequently contribute to their lower recovery rate. Therefore, different anticoagulation treatment regimens between G‐PPCM and SA‐PPCM could also explain differences in outcome between the two collectives. A recent study showed no benefit of an anticoagulation therapy in heart failure patients.31 However, the condition in PPCM patients cannot be compared with general heart failure patients because (i) the physiology of the peripartum phase per se increases coagulation activity (as a protection from extensive bleeding at delivery) and (ii) the pathophysiology of PPCM further increases the thrombotic risk due to heart failure and impairment in the vasculature.3 In this regard, with the observed increased thrombin‐dependent cleavage of OPN, our data identify a novel prothrombotic pathomechanism in PPCM patients that is specifically targeted by LMWH therapy. This potential novel pathomechanism and the potential benefit of LMWH therapy need confirmation in larger cohorts and eventually in randomized multicentre trial.
In conclusion, at diagnosis, SA‐PPCM and G‐PPCM patients present different clinical and biomarker profiles. These can be attributed to ethnical differences and to differences regarding health care access (earlier diagnosis in G‐PPCM). Differences in baseline biomarkers profiles between the two cohorts support the notion of ethnical differences. Outcome also differs markedly with substantially better outcome in G‐PPCM compared with SA‐PPCM patients despite initial more severe disease presentation in G‐PPCM. Besides genetic and ethnic aspects, earlier diagnosis, different medical treatment regimens, and access to device therapy in G‐PPCM could contribute to the better clinical outcome in G‐PPCM. The present data also suggest a novel pathomechanism of PPCM, which may have an impact on the outcome of PPCM patients by regulating fibrosis. This pathomechanism includes elevated circulating OPN levels, its processing in a profibrotic fragment by thrombin, and a subsequent up‐regulation of PIIINP. Anticoagulation therapy may be able to brake this cycle and thereby not only prevent thrombosis but also contribute to better recovery of PPCM patients, a feature supported by the high use of anticoagulation therapy and the better outcome of G‐PPCM patients compared with SA‐PPCM patients.
4.1. Limitations
Because of the low incidence of PPCM, we included patients from the G‐PPCM registry who were treated in different centres from all over Germany. Therefore, especially in the G cohort, clinical data were partially missing in some patients. Also, due to the limited amount of blood samples available, especially during the follow‐up, not all biomarkers could be measured in all patients. Furthermore, the C‐terminal PICP, closely related to collagen I formation, was not assessed in our study.
Conflict of interest
None declared.
Funding
Financial support was provided by the South African National Research Foundation, the Claude Leon Foundation, the South African Medical Research Council, and the German Research Foundation (DFG Hi 842/4‐3, Rebirth, KFO311) and the BMBF.
Supporting information
Table S1. Circulating levels of Galectin 3, PINP, PINP/PIIINP and OPN but not sST2 and PIIINP differ between German and South African postpartum controls
Table S2. HIV is not involved in SA‐PPCM patient's baseline cardiac function and outcome and doesn't influence fibrosis‐related biomarkers circulating levels
Table S3. PINP and PIIINP in German and South African controls and PPCM patients presenting postpartum
Table S4. Role of ethnicity in patient's characteristics within SA‐cohort
Table S5. Biomarkers levels in German and South African PPCM patients according to their LVEF recovery
Acknowledgements
We are grateful to Tasneem Adam, Martina Kasten, and Meike Jungesblut for their help with data, biobanking, and biomarkers measurement. We thank Bestbion dx GmbH for providing ST‐2 ELISA‐Kits for analysing the German cohort free of charge.
Azibani, F. , Pfeffer, T. J. , Ricke‐Hoch, M. , Dowling, W. , Pietzsch, S. , Briton, O. , Baard, J. , Abou Moulig, V. , König, T. , Berliner, D. , Libhaber, E. , Schlothauer, S. , Anthony, J. , Lichtinghagen, R. , Bauersachs, J. , Sliwa, K. , and Hilfiker‐Kleiner, D. (2020) Outcome in German and South African peripartum cardiomyopathy cohorts associates with medical therapy and fibrosis markers. ESC Heart Failure, 7: 512–522. 10.1002/ehf2.12553.
Contributor Information
Karen Sliwa, Email: karen.sliwa-hahnle@uct.ac.za.
Denise Hilfiker‐Kleiner, Email: hilfiker.denise@mh-hannover.de.
References
- 1. Bauersachs J, Arrigo M, Hilfiker‐Kleiner D, Veltmann C, Coats AJ, Crespo‐Leiro MG, De Boer RA, van der Meer P, Maack C, Mouquet F, Petrie MC, Piepoli MF, Regitz‐Zagrosek V, Schaufelberger M, Seferovic P, Tavazzi L, Ruschitzka F, Mebazaa A, Sliwa K. Current management of patients with severe acute peripartum cardiomyopathy: practical guidance from the Heart Failure Association of the European Society of Cardiology Study Group on peripartum cardiomyopathy. Eur J Heart Fail 2016; 18: 1096–1105. [DOI] [PubMed] [Google Scholar]
- 2. Sliwa K, Mebazaa A, Hilfiker‐Kleiner D, Petrie MC, Maggioni AP, Laroche C, Regitz‐Zagrosek V, Schaufelberger M, Tavazzi L, van der Meer P, Roos‐Hesselink JW, Seferovic P, van Spandonck‐Zwarts K, Mbakwem A, Bohm M, Mouquet F, Pieske B, Hall R, Ponikowski P, Bauersachs J. Clinical characteristics of patients from the worldwide registry on peripartum cardiomyopathy (PPCM): EURObservational Research Programme in conjunction with the Heart Failure Association of the European Society of Cardiology Study Group on PPCM. Eur J Heart Fail 2017; 19: 1131–1141. [DOI] [PubMed] [Google Scholar]
- 3. Hilfiker‐Kleiner D, Sliwa K. Pathophysiology and epidemiology of peripartum cardiomyopathy. Nat Rev Cardiol 2014; 11: 364–370. [DOI] [PubMed] [Google Scholar]
- 4. Tarone G, Balligand JL, Bauersachs J, Clerk A, De Windt L, Heymans S, Hilfiker‐Kleiner D, Hirsch E, Iaccarino G, Knoll R, Leite‐Moreira AF, Lourenco AP, Mayr M, Thum T, Tocchetti CG. Targeting myocardial remodelling to develop novel therapies for heart failure: a position paper from the Working Group on Myocardial Function of the European Society of Cardiology. Eur J Heart Fail 2014; 16: 494–508. [DOI] [PubMed] [Google Scholar]
- 5. Haghikia A, Rontgen P, Vogel‐Claussen J, Schwab J, Westenfeld R, Ehlermann P, Berliner D, Podewski E, Hilfiker‐Kleiner D, Bauersachs J. Prognostic implication of right ventricular involvement in peripartum cardiomyopathy: a cardiovascular magnetic resonance study. ESC Heart Fail 2015; 2: 139–149. [DOI] [PMC free article] [PubMed] [Google Scholar]
- 6. Hilfiker‐Kleiner D, Kaminski K, Podewski E, Bonda T, Schaefer A, Sliwa K, Forster O, Quint A, Landmesser U, Doerries C, Luchtefeld M, Poli V, Schneider MD, Balligand JL, Desjardins F, Ansari A, Struman I, Nguyen NQ, Zschemisch NH, Klein G, Heusch G, Schulz R, Hilfiker A, Drexler H. A cathepsin D‐cleaved 16 kDa form of prolactin mediates postpartum cardiomyopathy. Cell 2007; 128: 589–600. [DOI] [PubMed] [Google Scholar]
- 7. Zannad F, Alla F, Dousset B, Perez A, Pitt B. Limitation of excessive extracellular matrix turnover may contribute to survival benefit of spironolactone therapy in patients with congestive heart failure: insights from the randomized aldactone evaluation study (RALES). Rales Investigators Circulation 2000; 102: 2700–2706. [DOI] [PubMed] [Google Scholar]
- 8. Felker GM, Fiuzat M, Thompson V, Shaw LK, Neely ML, Adams KF, Whellan DJ, Donahue MP, Ahmad T, Kitzman DW, Pina IL, Zannad F, Kraus WE, O'Connor CM. Soluble ST2 in ambulatory patients with heart failure: association with functional capacity and long‐term outcomes. Circ Heart Fail 2013; 6: 1172–1179. [DOI] [PMC free article] [PubMed] [Google Scholar]
- 9. Motiwala SR, Szymonifka J, Belcher A, Weiner RB, Baggish AL, Sluss P, Gaggin HK, Bhardwaj A, Januzzi JL. Serial measurement of galectin‐3 in patients with chronic heart failure: results from the ProBNP Outpatient Tailored Chronic Heart Failure Therapy (PROTECT) study. Eur J Heart Fail 2013; 15: 1157–1163. [DOI] [PubMed] [Google Scholar]
- 10. Oh K, Seo MW, Kim YW, Lee DS. Osteopontin potentiates pulmonary inflammation and fibrosis by modulating IL‐17/IFN‐γ‐secreting T‐cell ratios in bleomycin‐treated mice. Immune Netw 2015; 15: 142–149. [DOI] [PMC free article] [PubMed] [Google Scholar]
- 11. Lopez B, Gonzalez A, Lindner D, Westermann D, Ravassa S, Beaumont J, Gallego I, Zudaire A, Brugnolaro C, Querejeta R, Larman M, Tschope C, Diez J. Osteopontin‐mediated myocardial fibrosis in heart failure: a role for lysyl oxidase? Cardiovasc Res 2013; 99: 111–120. [DOI] [PubMed] [Google Scholar]
- 12. Uchinaka A, Hamada Y, Mori S, Miyagawa S, Saito A, Sawa Y, Matsuura N, Yamamoto H, Kawaguchi N. SVVYGLR motif of the thrombin‐cleaved N‐terminal osteopontin fragment enhances the synthesis of collagen type III in myocardial fibrosis. Mol Cell Biochem 2015; 408: 191–203. [DOI] [PubMed] [Google Scholar]
- 13. Brar SS, Khan SS, Sandhu GK, Jorgensen MB, Parikh N, Hsu JW, Shen AY. Incidence, mortality, and racial differences in peripartum cardiomyopathy. Am J Cardiol 2007; 100: 302–304. [DOI] [PubMed] [Google Scholar]
- 14. Sliwa K, Forster O, Libhaber E, Fett JD, Sundstrom JB, Hilfiker‐Kleiner D, Ansari AA. Peripartum cardiomyopathy: inflammatory markers as predictors of outcome in 100 prospectively studied patients. Eur Heart J 2006; 27: 441–446. [DOI] [PubMed] [Google Scholar]
- 15. McNamara DM, Elkayam U, Alharethi R, Damp J, Hsich E, Ewald G, Modi K, Alexis JD, Ramani GV, Semigran MJ, Haythe J, Markham DW, Marek J, Gorcsan J 3rd, Wu WC, Lin Y, Halder I, Pisarcik J, Cooper LT, Fett JD, Investigators I. Clinical outcomes for peripartum cardiomyopathy in North America: results of the IPAC Study (Investigations of Pregnancy‐Associated Cardiomyopathy). J Am Coll Cardiol 2015; 66: 905–914. [DOI] [PMC free article] [PubMed] [Google Scholar]
- 16. Goland S, Modi K, Bitar F, Janmohamed M, Mirocha JM, Czer LS, Illum S, Hatamizadeh P, Elkayam U. Clinical profile and predictors of complications in peripartum cardiomyopathy. J Card Fail 2009; 15: 645–650. [DOI] [PubMed] [Google Scholar]
- 17. Sliwa K, Forster O, Tibazarwa K, Libhaber E, Becker A, Yip A, Hilfiker‐Kleiner D. Long‐term outcome of peripartum cardiomyopathy in a population with high seropositivity for human immunodeficiency virus. Int J Cardiol 2011; 147: 202–208. [DOI] [PubMed] [Google Scholar]
- 18. Sliwa K, Skudicky D, Bergemann A, Candy G, Puren A, Sareli P. Peripartum cardiomyopathy: analysis of clinical outcome, left ventricular function, plasma levels of cytokines and Fas/APO‐1. J Am Coll Cardiol 2000; 35: 701–705. [DOI] [PubMed] [Google Scholar]
- 19. Irizarry OC, Levine LD, Lewey J, Boyer T, Riis V, Elovitz MA, Arany Z. Comparison of clinical characteristics and outcomes of peripartum cardiomyopathy between African American and Non‐African American women. JAMA Cardiol 2017; 2: 1256–1260. [DOI] [PMC free article] [PubMed] [Google Scholar]
- 20. Lang RM, Badano LP, Mor‐Avi V, Afilalo J, Armstrong A, Ernande L, Flachskampf FA, Foster E, Goldstein SA, Kuznetsova T, Lancellotti P, Muraru D, Picard MH, Rietzschel ER, Rudski L, Spencer KT, Tsang W, Voigt JU. Recommendations for cardiac chamber quantification by echocardiography in adults: an update from the American Society of Echocardiography and the European Association of Cardiovascular Imaging. Eur Heart J Cardiovasc Imaging 2015; 16: 233–270. [DOI] [PubMed] [Google Scholar]
- 21. Hilfiker‐Kleiner D, Haghikia A, Berliner D, Vogel‐Claussen J, Schwab J, Franke A, Schwarzkopf M, Ehlermann P, Pfister R, Michels G, Westenfeld R, Stangl V, Kindermann I, Kuhl U, Angermann CE, Schlitt A, Fischer D, Podewski E, Bohm M, Sliwa K, Bauersachs J. Bromocriptine for the treatment of peripartum cardiomyopathy: a multicentre randomized study. Eur Heart J 2017; 38: 2671–2679. [DOI] [PMC free article] [PubMed] [Google Scholar]
- 22. Haghikia A, Podewski E, Libhaber E, Labidi S, Fischer D, Roentgen P, Tsikas D, Jordan J, Lichtinghagen R, von Kaisenberg CS, Struman I, Bovy N, Sliwa K, Bauersachs J, Hilfiker‐Kleiner D. Phenotyping and outcome on contemporary management in a German cohort of patients with peripartum cardiomyopathy. Basic Res Cardiol 2013; 108: 366. [DOI] [PMC free article] [PubMed] [Google Scholar]
- 23. Sliwa K, Hilfiker‐Kleiner D, Petrie MC, Mebazaa A, Pieske B, Buchmann E, Regitz‐Zagrosek V, Schaufelberger M, Tavazzi L, van Veldhuisen DJ, Watkins H, Shah AJ, Seferovic PM, Elkayam U, Pankuweit S, Papp Z, Mouquet F, McMurray JJ, Heart Failure Association of the European Society of Cardiology Working Group on Peripartum C . Current state of knowledge on aetiology, diagnosis, management, and therapy of peripartum cardiomyopathy: a position statement from the Heart Failure Association of the European Society of Cardiology Working Group on peripartum cardiomyopathy. Eur J Heart Fail 2010; 12: 767–778. [DOI] [PubMed] [Google Scholar]
- 24. Hilfiker‐Kleiner D, Haghikia A, Nonhoff J, Bauersachs J. Peripartum cardiomyopathy: current management and future perspectives. Eur Heart J 2015; 36: 1090–1097. [DOI] [PMC free article] [PubMed] [Google Scholar]
- 25. Arrigo M, Blet A, Mebazaa A. Bromocriptine for the treatment of peripartum cardiomyopathy: welcome on BOARD. Eur Heart J 2017; 38: 2680–2682. [DOI] [PubMed] [Google Scholar]
- 26. Fernandes‐Silva MM, Shah AM, Hegde S, Goncalves A, Claggett B, Cheng S, Nadruz W, Kitzman DW, Konety SH, Matsushita K, Mosley T, Lam CS, Borlaug BA, Solomon SD. Race‐related differences in left ventricular structural and functional remodeling in response to increased afterload: the ARIC Study. JACC Heart Fail 2017; 5: 157–165. [DOI] [PMC free article] [PubMed] [Google Scholar]
- 27. van den Borne SW, Diez J, Blankesteijn WM, Verjans J, Hofstra L, Narula J. Myocardial remodeling after infarction: the role of myofibroblasts. Nat Rev Cardiol 2010; 7: 30–37. [DOI] [PubMed] [Google Scholar]
- 28. Paulus WJ, Waddingham MT. Racial tension in hypertension: divergent effects of African and European ancestry on cardiac remodeling. JACC Heart Fail 2017; 5: 166–168. [DOI] [PubMed] [Google Scholar]
- 29. Sharma UC, Pokharel S, van Brakel TJ, van Berlo JH, Cleutjens JP, Schroen B, Andre S, Crijns HJ, Gabius HJ, Maessen J, Pinto YM. Galectin‐3 marks activated macrophages in failure‐prone hypertrophied hearts and contributes to cardiac dysfunction. Circulation 2004; 110: 3121–3128. [DOI] [PubMed] [Google Scholar]
- 30. Lorenzen JM, Schauerte C, Hubner A, Kolling M, Martino F, Scherf K, Batkai S, Zimmer K, Foinquinos A, Kaucsar T, Fiedler J, Kumarswamy R, Bang C, Hartmann D, Gupta SK, Kielstein J, Jungmann A, Katus HA, Weidemann F, Muller OJ, Haller H, Thum T. Osteopontin is indispensible for AP1‐mediated angiotensin II‐related miR‐21 transcription during cardiac fibrosis. Eur Heart J 2015; 36: 2184–2196. [DOI] [PMC free article] [PubMed] [Google Scholar]
- 31. Zannad F, Anker SD, Byra WM, Cleland JGF, Fu M, Gheorghiade M, Lam CSP, Mehra MR, Neaton JD, Nessel CC, Spiro TE, van Veldhuisen DJ, Greenberg B. Rivaroxaban in patients with heart failure, sinus rhythm, and coronary disease. N Engl J Med 2018; 379: 1332–1342. [DOI] [PubMed] [Google Scholar]
Associated Data
This section collects any data citations, data availability statements, or supplementary materials included in this article.
Supplementary Materials
Table S1. Circulating levels of Galectin 3, PINP, PINP/PIIINP and OPN but not sST2 and PIIINP differ between German and South African postpartum controls
Table S2. HIV is not involved in SA‐PPCM patient's baseline cardiac function and outcome and doesn't influence fibrosis‐related biomarkers circulating levels
Table S3. PINP and PIIINP in German and South African controls and PPCM patients presenting postpartum
Table S4. Role of ethnicity in patient's characteristics within SA‐cohort
Table S5. Biomarkers levels in German and South African PPCM patients according to their LVEF recovery