Abstract
Background
Stromal and immune cells play essential roles in the development of breast cancer (BC). This study was conducted to identify prognosis-related genes from the tumor microenvironment.
Material/Methods
The gene expression profiles of 622 BC samples were downloaded from TCGA (The Cancer Genome Atlas) database. Stromal and immune scores were calculated by using the ESTIMATE (Estimation of STromal and Immune cells in MAlignant Tumours using Expression data) algorithm. Then, differentially expressed genes (DEGs) between the high score group and the low score group were screened. The intersecting DEGs were selected through Venn diagrams, and survival analysis was conducted. Functional and pathway enrichment analyses were performed using the DAVID (Database for Annotation, Visualization and Integrated Discovery), and a protein–protein interaction (PPI) network was constructed with the STRING database and Cytoscape. These genes were validated for prognostic value by use of the KM (Kaplan-Meier) plotter tool.
Results
The low immune score group was associated with a poor prognosis. However, there was no difference in the prognosis between the high and low stromal score groups. A total of 248 intersecting DEGs were found in BC, and 61 genes were significantly associated with the prognosis of BC patients in the TCGA database. These genes were enriched in the immune response, components of the plasma membrane, and receptor activity. Furthermore, in the validation group, 31 of 61 genes were significantly associated with prognosis.
Conclusions
Our bioinformatics analysis identified 31 tumor microenvironment-related genes as potential prognostic predictors for breast cancer patients. Some of these genes that have not been widely investigated previously, such as CXCL9, GPR18, S1PR4, SASH3, and PYH1N1, might be additional predictive factors for BC patients.
MeSH Keywords: Breast Neoplasms, Prognosis, Tumor Microenvironment
Background
Breast cancer (BC) is the most common malignant tumor in women and presents nearly 1.7 million new cases worldwide each year [1]. Despite advancements in therapeutic strategies, including surgery, chemotherapy, radiotherapy, and molecular targeted therapy, some patients with BC still have a poor prognosis [2]. Furthermore, BC is a highly heterogeneous disease and can be divided into 4 main molecular subtypes – Luminal A, Luminal B, HER2-enriched, and Basal-like – which makes it difficult to assess the survival of each individual [3]. Although previous studies have identified numerous genes of prognostic value in BC, with the development of bioinformatics, emerging algorithms have created conditions for discovering potentially meaningful genes from a different perspective.
There is growing evidence that tumors not only consist of neoplastic cells but also present a significantly altered surrounding stroma. In the cancer-associated stroma, many types of stromal cells can create a receptive microenvironment and influence cancer progression and metastasis [4]. For example, cancer-associated fibroblasts are able to regulate the chemoresistance of pancreatic cancer cells and increase invasive behaviors. In the tumor immune microenvironment, tumor-infiltrating lymphocytes (TILs) are frequently observed, and increased TILs are often associated with a good outcome in many cancers, including BC [5–8]. Moreover, many studies have shown that the quantity and proportion of stromal and immune cells in tumor tissue are closely associated with clinical characteristics and prognosis [9–11]. Therefore, it is necessary to thoroughly understand the significance of genes related to the tumor microenvironment for accurate evaluation and treatment. A groundbreaking achievement in this area is that Yoshihara invented a new algorithm – ESTIMATE (Estimation of STromal and Immune cells in MAlignant Tumor tissues using Expression data) – to predict the level of infiltrating stromal and immune cells in the tumor microenvironment using gene expression profile [12]. By analyzing the defined gene expression signature of immune and stromal cells, immune and stromal scores are believed to anticipate the infiltration of tumor-associated normal cells. Recently, several studies have reached important conclusions in various tumors, such as melanoma [13], colon cancer [14], glioblastoma [15], and breast cancer [16,17]. However, the method of screening prognostic genes and validation cohort used in our study is different from previous research in BC and could lead to different results. This study also can provide more meaningful information about prognostic genes in BC.
In our study, we analyzed the TCGA database of BC cohorts and calculated the stromal and immune scores of BC using the ESTIMATE algorithm. Prognosis-related genes were screened by mining gene expression data. Furthermore, we validated these relevant genes by using multiple GEO (Gene Expression Omnibus) BC cohorts in the KM plotter platform.
Material and Methods
Data acquisition
First, gene expression and clinical data on survival and outcome for BC patients were downloaded from The Cancer Genome Atlas (TCGA) data portal. Clinical data, such as stage and molecular subtype (PAM50), were obtained from the University of California Santa Cruz (UCSC) Xena database (TCGA Breast Cancer, Phenotypes). Then, we used the online software KM plotter to assess the correlation between expression of DEGs and the overall survival of breast cancer patients. The KM plotter contains all the datasets of breast cancer from GEO, of which 1402 patients have OS survival data [18].
Calculation of the scores and screening of differentially expressed genes
Stromal scores and immune scores of breast cancer samples were calculated using the ESTIMATE R package (https://bioinformatics.mdanderson.org/public-software/estimate/). The gene expression profile was analyzed using the limma package of R software [19]. An FDR <0.05 and a |log2 fold change (FC)| >1 were chosen as the cut-off criteria. A heatmap was used to show gene expression levels according to stromal/immune scores. Venn diagrams (http://bioinfogp.cnb.csic.es/tools/venny/index.html) were drawn to identify the overlapping genes.
Functional and pathway enrichment analyses
To further explore the biological significance of the DEGs, the Database for Annotation, Visualization and Integrated Discovery (DAVID) Version 6.8 was used [20]. By Gene Ontology (GO) enrichment and Kyoto Encyclopedia of Genes and Genomes (KEGG) pathway analyses, we identified potentially relevant biological function annotations. A false discovery rate <0.05 was considered statistically significant.
PPI network construction and module analysis
We evaluated the protein–protein interaction (PPI) data using the Search Tool for the Retrieval of Interacting Genes (STRING, http://string.embl.de/) database [21]. Cytoscape software was used to visualize the protein interaction network relationships [22]. Only experimentally validated interactions with a combined score >0.4 were considered significant. Molecular Complex Detection (MCODE), a plug-in used to produce the best results for calculating correlation levels, was subsequently utilized to identify clusters in the network.
Survival analysis
The key genes were identified as intersecting between the immune differential group and the stromal differential group. We also collected data on the survival times of the patients in our study based on the information provided in the TCGA database and the GEO dataset. Then, the effect of individual genes on OS was studied with Kaplan-Meier (KM) survival analysis. The relationship was verified by the log-rank test.
Results
Comparison of stromal and immune scores by BC molecular subtype and stage
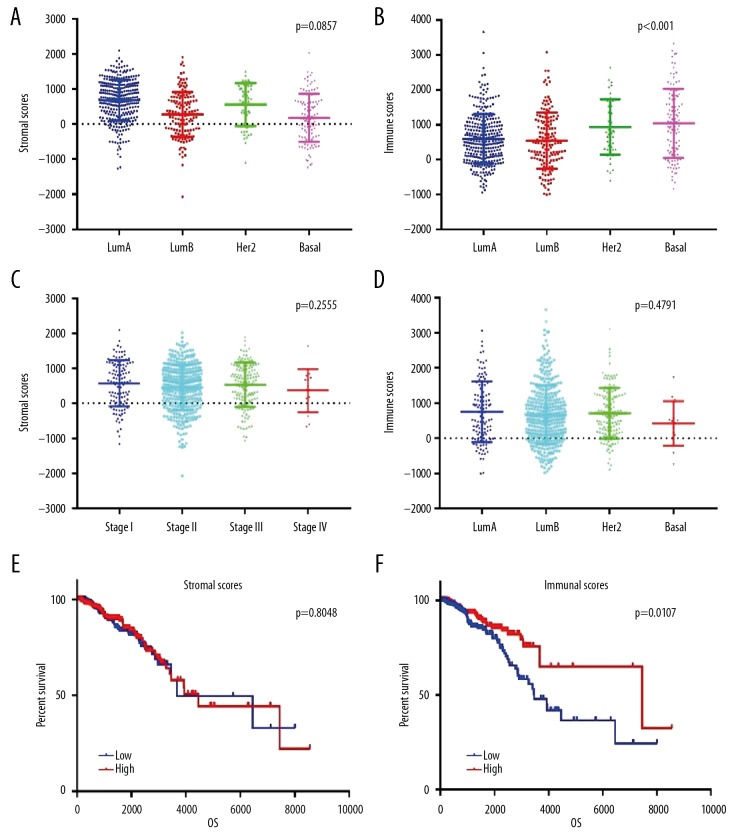
In this study, BC patients’ gene expression profiles and clinical data were downloaded from the TCGA database. The 622 BC tissue samples were categorized into 317 Luminal A, 149 Luminal B, 49 Her2-enriched, and 107 Basal-like tissue samples. All included patients had complete gene expression data and clinical follow-up information. Through the ESTIMATE algorithm, we found that stromal scores varied from −2027.44 to 2099.46, and immune scores varied from −1002.17 to 3661.55. The average stromal scores of Luminal A patients ranked the highest among all 4 subtypes, followed by those of the Her2-enriched and Luminal B subtypes. Basal-like subtype patients had the lowest stromal scores (Figure 1A, p=0.0857). However, the Basal-like patients scored the highest on immune cells, followed by Her2-enriched and Luminal A patients. Luminal B patients had the lowest immune scores. There was a significant association between molecular subtype and immune score (Figure 1B, p<0.0001).
Figure 1.
Comparison of stromal and immune scores in different subtypes and clinical stagesof BC and differences in prognosis. (A) Stromal scores of different BC subtypes. Scatter dot plot shows no association between BC subtypes and stromal scores (n=622, p=0.0857). (B) Immune scores of different BC subtypes. Scatter dot plot shows a significant association between BC subtypes and immune scores (n=622, p<0.001). (C) Distribution of stromal scores in different clinical stages of BC. Scatter dot plot shows no significant association between clinical stages and stromal scores (n=622, p=0.2555). (D) Distribution of immune scores in different clinical stages of BC. Scatter dot plot shows no significant association between clinical stages and immune scores (n=622, p=0.4791). (E, F) In total, 622 BC patients were stratified into a high score group (n=311) or a low score group (n=311) according to the median score. The Kaplan-Meier survival curve demonstrates that the low immune score group was associated with decreased OS (p=0.0107). However, there was no difference in the prognosis between the high and low stromal score groups.
Based on the TNM classification, the enrolled patients included 114 stage I cases, 361 stage II cases, 133 stage III cases, and 14 stage IV cases. We further compared the stromal and immune scores in different stages of BC. The results showed no significant difference between the stromal/immune score and clinical stage (Figure 1C, p=0.2555, Figure 1D, p=0.4791). Interestingly, there was no significant difference in stromal and immune scores between stage I and stage III, but the scores of stage IV patients were slightly lower than those of stage I to III patients.
To investigate the possible relationship between stromal/immune scores and survival, we assigned 622 BC patients into a high score group (n=311) or a low score group (n=311) according to the median score. We found that the low immune score group was associated with decreased OS (Figure 1F, p=0.0107). However, there was no difference in the prognosis between the high and low stromal score groups (Figure 1E, p=0.8048).
Identification of DEGs in BC based on stromal and immune scores
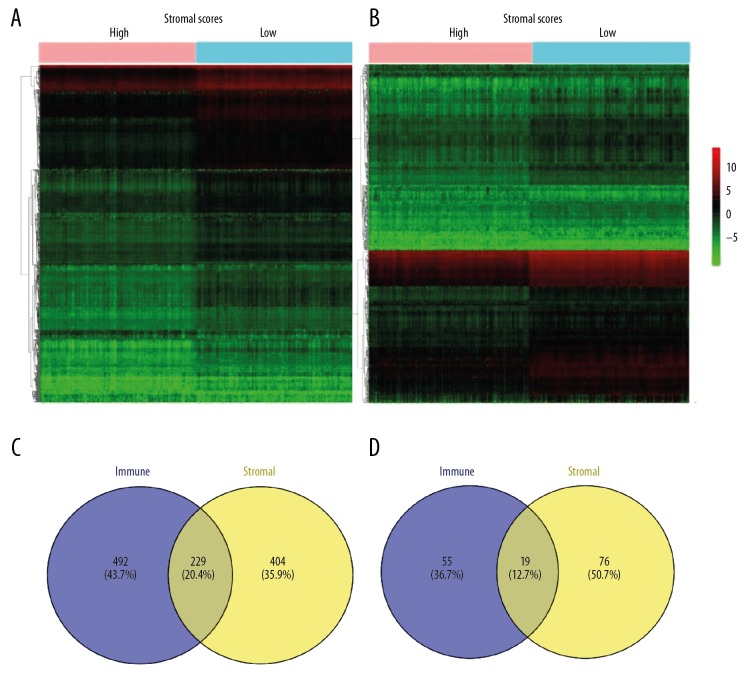
To determine the correlation of gene expression data with immune scores, the DEGs between the high and low score groups were screened using the TCGA database. As shown in Figure 2A and 2B, the heatmap demonstrated noticeable gene expression differences when the high stromal/immune score group was compared to the low stromal/immune score group. A total of 728 DEGs were identified in a comparison of the stromal score in the high and low groups, including 632 upregulated DEGs and 96 downregulated DEGs (fold change >2, p<0.05). Correspondingly, for grouping comparisons based on the immune scores, in the high score group, 721 genes were upregulated, and 74 genes were downregulated (fold change >2, p<0.05). In addition, Venn diagrams revealed 229 overexpressed genes and 19 underexpressed genes in common between the 2 scoring systems (Figure 2C and 2D). Because these common genes are signatures of stromal and immune cells, which play critical roles in the tumor microenvironment, we decided to analyze these DEGs further.
Figure 2.
Comparison of gene expression data of BC in 2 groups based on immune and stromal scores. (A) Heatmap of the DEGs in the high stromal score group vs. the low stromal score group. (B) Heatmap of the DEGs in the high immune score group vs. the low immune score group. (C, D) Identification of 248 intersecting DEGs in the 2 groups (stromal score differential genes and immune score differential genes) through a Venn diagram. In total, 229 DEGs were upregulated, and 19 DEGs were downregulated.
Survival analysis of the intersecting DEGs
Next, we explored the potential prognostic values of the selected DEGs in patients with BC by evaluating the correlation between gene expression and overall survival using the R package “survival”. Based on the TCGA database (n=622), 61 DEGs were found to be significantly associated with OS in the log-rank test (p<0.05), and these genes are shown in Table 1. The top 5 genes according to the p-value are SHISAL2A, KLRB1, STAP1, TESPA1, and CD3E. Interestingly, SHISAL2A belongs to the Shisa family and has been involved in head development by inhibiting Wnt and FGF signaling, which has never been reported to be associated with tumorigenesis. The proteins encoded by second to fourth genes are involved in the maturation and/or regulation of NK cells (KLRB1), B cells (STAP1) and T cells (TESPA1 and CD3E), respectively.
Table 1.
Sixty-one genes with prognostic value of BC from the TCGA database.
| Gene symbol | p-Value | Gene symbol | p-Value | Gene symbol | p-Value |
|---|---|---|---|---|---|
| SHISAL2A | 0.000121 | CLEC4C | 0.015453 | CD96 | 0.026761 |
| KLRB1 | 0.000694 | FCRLA | 0.015839 | MS4A1 | 0.029929 |
| STAP1 | 0.00158 | CNR2 | 0.01691 | CD37 | 0.03036 |
| TESPA1 | 0.00188 | CD48 | 0.016949 | IL16 | 0.030744 |
| CD3E | 0.002165 | SH2D1A | 0.017004 | PLAC8 | 0.03193 |
| CD52 | 0.002987 | DTHD1 | 0.017275 | CLEC9A | 0.032143 |
| HLA-DQB2 | 0.00355 | CD3D | 0.017318 | GZMM | 0.033129 |
| GPR171 | 0.004005 | CD6 | 0.018551 | THEMIS | 0.033556 |
| S1PR4 | 0.004801 | CXCL9 | 0.018646 | SLFN12L | 0.033599 |
| GPR18 | 0.006277 | AC119396 | 0.018725 | TNFSF14 | 0.036213 |
| GIMAP7 | 0.007104 | APBB1IP | 0.018846 | IL12B | 0.037189 |
| LILRB5 | 0.007626 | CD69 | 0.019766 | GIMAP1 | 0.039087 |
| HLA-DQA2 | 0.007722 | CD19 | 0.020359 | CCR4 | 0.03943 |
| BLK | 0.008201 | LRRC2 | 0.020361 | TLR10 | 0.040327 |
| TRAT1 | 0.008909 | GZMK | 0.021225 | SASH3 | 0.040599 |
| CD5 | 0.009205 | CCR5 | 0.021587 | IL7R | 0.044158 |
| CD2 | 0.009343 | SCML4 | 0.02246 | CXCR3 | 0.044471 |
| TNFRSF13B | 0.010198 | PYHIN1 | 0.024964 | ITK | 0.045308 |
| GRAP2 | 0.011712 | CD226 | 0.026306 | CCL11 | 0.047872 |
| MMP1 | 0.013542 | JCHAIN | 0.026745 | CD3G | 0.049904 |
| CD40LG | 0.013619 |
Protein–protein interactions between survival-related intersecting DEGs
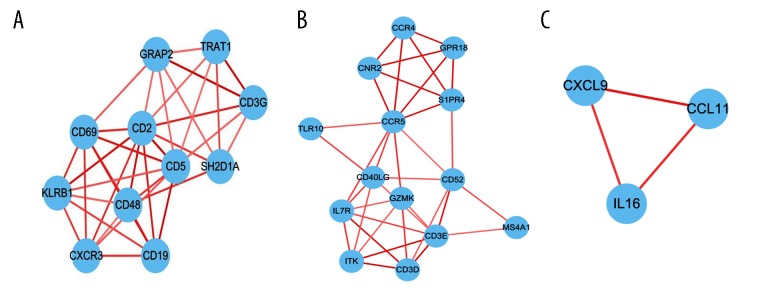
The Search Tool for the Retrieval of Interacting Genes/Proteins (STRING) database and Cytoscape software were utilized to construct the PPI network, which included 240 edges and 61 nodes. We identified 3 significant modules based on the degree of importance using the cluster analysis of MCODE. In module 1 (Figure 3A), 36 edges and 11 nodes comprised the network; Module 2 (Figure 3B) contained 35 edges and 14 nodes; and Module 3 (Figure 3C) comprised 3 edges and 3 nodes.
Figure 3.
Module analysis of the PPI network. A total of 61 survival-related DEGs in the TCGA were analyzed with STRING and Cytoscape. The color of the line reflects the combined score of interacting proteins. (A) Module rank 1. (B) Module rank 2. (C) Module rank 3.
Functional enrichment analysis of prognostic genes in the TCGA
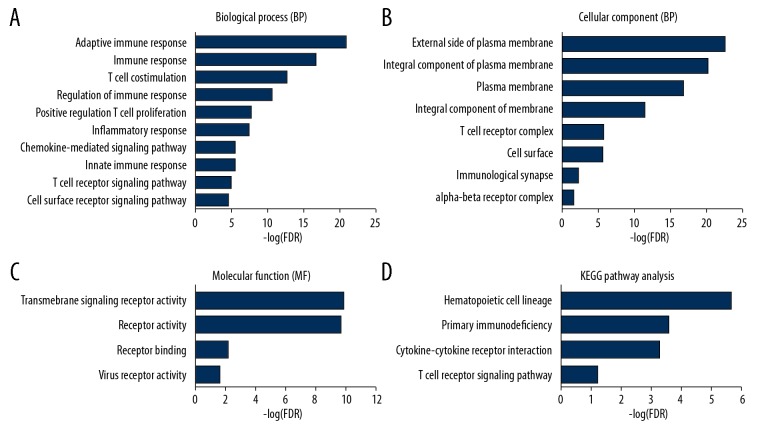
Through the DAVID database, we found 33 GO terms with a false discovery rate less than 0.05, which included 21 GO terms related to biological processes (Figure 4A, only the top 10 are listed), 8 GO terms related to cellular components (Figure 4B), and 4 GO terms related to molecular functions (Figure 4C). These terms are believed to be involved in the immune response, components of the plasma membrane, and receptor activity. The functional and signaling pathway enrichment of the DEGs was analyzed using KEGG. As shown in Figure 4D, the signaling pathway analysis revealed that these prognostic-related DEGs are enriched in the hematopoietic cell lineage, primary immunodeficiency, the cytokine-cytokine receptor interaction, and the T cell receptor signaling pathway.
Figure 4.
(A–D) Functional enrichment analysis of the survival-related DEGs in breast cancer. To investigate the functions and pathways of the candidate DEGs, the DAVID online database was used to perform the functional enrichment analysis.
Validation of prognostic genes in the GEO cohort
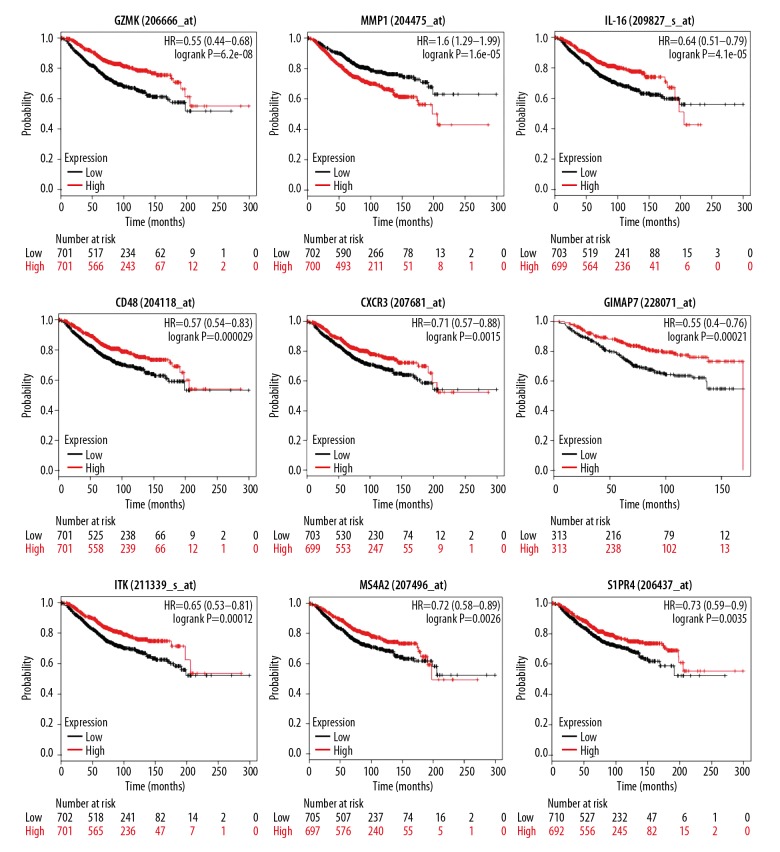
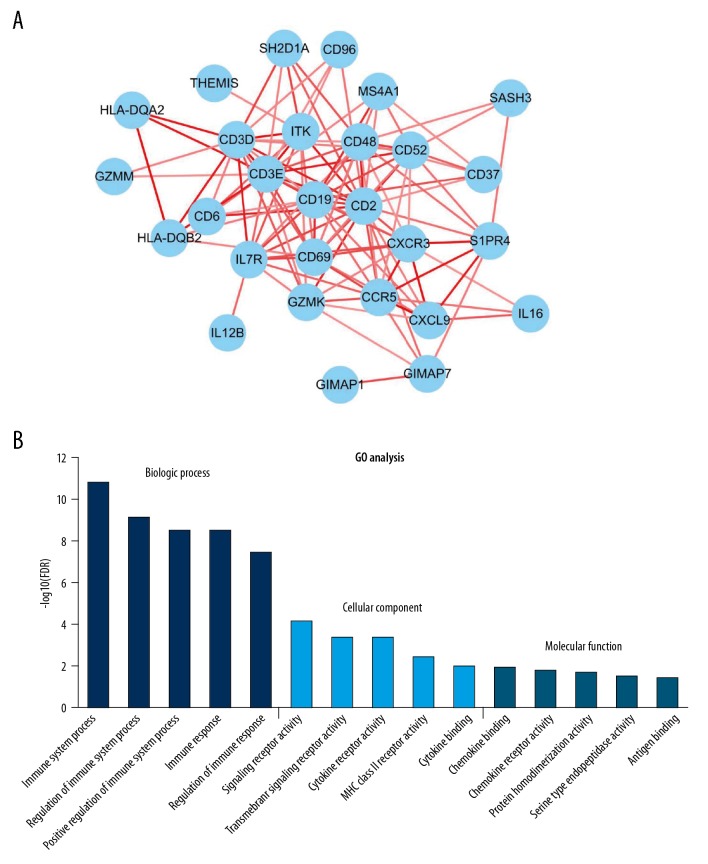
To validate the prognostic values of the DEGs, the online tool KM plotter was used to investigate the correlation between the expression level of 31 genes and the OS of breast cancer patients. The KM plotter online tool contains complete OS data and gene expression profiles of 1402 patients from dozens of independent datasets. As a result, a total of 31 genes were associated with the prognosis of BC patients (Figure 5, Table 2). In these 31 genes, most genes encode proteins found on the surface of immune cells and participate in activation and differentiation of these cells. Interestingly, BC patients with low expression of these genes, except for MMP1, have a poor prognosis. Given that these genes play a significant role in BC prognosis, we constructed a PPI network (Figure 6A) and performed functional enrichment analysis (Figure 6B).
Figure 5.
Independent validation of 61 prognostic genes by Kaplan-Meier curves in the GEO cohort. Kaplan-Meier curves of selected survival-associated genes. Patients were divided into high expression (red line) and low expression (blue line) groups based on their gene expression by the median value.
Table 2.
Thirty-one genes with prognostic value in both TCGA and GEO datasets.
| Categories | Gene symbols |
|---|---|
| Chemokines | CXCR3, CXCL9, CCR5 |
| Cell surface | CD2, CD3D, CD3E, CD6, CD19, CD37, CD48, CD52, CD96, HLA-DQA2, HLA-DQB2, MS4A1 |
| Cellular receptors | CD69, GRP18 |
| Serine proteases | GZMK, GZMM |
| GTP-binding superfamily | GIMAP1, GIMAP7 |
| Interleukin | IL16, IL7R, IL12B |
| Signaling lymphocyte-activation molecule | SH2D1A, SASH3 |
| Matrix metallopeptidases | MMP1 |
| T cell regulation | THEMIS, ITK |
| Unknown classification | PYHIN1, S1PR4 |
Genes in bold and skewed have been reported to be associated with breast cancer prognosis.
Figure 6.
(A, B) PPI network and GO analysis of survival-related genes in both the TCGA and GEO cohorts. A total of 29 of 31 prognostic DEGs are included in the PPI network. GO analysis shows the top results.
Discussion
In general, BC is not usually viewed as highly immunogenic cancer. However, recent studies have revealed that the BC tumor microenvironment is rich in immune infiltrates with distinct functions [23]. Furthermore, previous studies have shown that the number of TILs is an independent prognostic factor for improved overall survival and distant relapse-free survival in TNBC [24,25]. In 2014, scoring methods for stromal TILs as recommended by the International TILs Working Group were feasible in clinical practice [26]. Moreover, stromal cancer-associated fibroblasts of BC are involved in the entire phase of tumor progression, including metastasis [27]. In short, screening valuable genes from immune and stromal cells in tumor tissues may be a target of cancer treatment. In the present study, we identified 31 tumor microenvironment-related genes that are significantly associated with survival in BC patients by comparing the stromal and immune scores of tumors and validated these genes in multiple GEO datasets (Figure 7).
Figure 7.
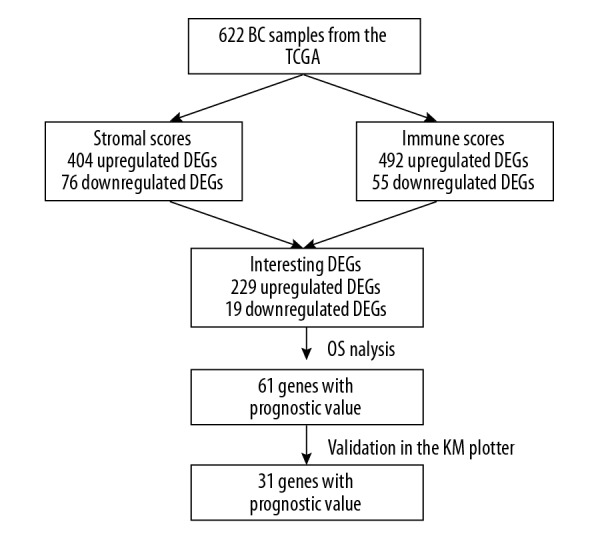
An overview of the workflow.
First, we compared the stromal and immune scores of different molecular subtypes in BC with the ESTIMATE algorithm and found that the Basal-like subtype had the highest immune score among the 4 subtypes. One possible reason for this finding is that the presence of high levels of TILs is common in the HER-2-enriched and Basal-like subtypes [28]. In contrast, stromal cells in the Luminal B and Basal-like subtypes have a lower proportion, which is associated with the expression levels of stromal-related genes. However, the exact reason for this difference remains to be clarified. Moreover, the immune and stromal scores did not seem to be correlated with the clinical stage, which suggests that the cell composition in the microenvironment is relatively stable during tumor development.
Second, we identified these DEGs by comparing the high score group and the low score group and further analyzed 248 overlapping DEGs involved in both immune and stromal scores. Then, a survival analysis was performed by using the TCGA database, and 61 genes with significance were obtained. Functional and enrichment analyses showed that the DEGs are mainly involved in the immune response, plasma membrane, and transmembrane signaling receptor activity. Additionally, KEGG pathway analysis revealed that these DEGs are significantly enriched in the hematopoietic cell lineage, primary immunodeficiency, and the cytokine-cytokine receptor interaction. For example, CXCL9, CD96, and CD28 are involved in T cell activation and proliferation during the immune response. Moreover, a previous study also demonstrated that some of these DEGs are related to BC-associated stromal cell initiation and progression. For pathway analysis, some of the genes contained in our selected DEGs are cytokine receptors, which play key roles in chemotaxis, angiogenesis, and inflammatory processes. Based on the PPI network, we successfully built 3 important protein–protein interaction modules, all of which are involved in the immune response, which is similar to that in glioblastoma [15].
Finally, the KM plotter platform, which includes multiple independent GEO datasets, was used to verify these 61 genes. Consequently, we found that 31 genes were associated with patients’ outcomes in both TCGA and GEO datasets. Of the 31 DEGs identified, 21 genes (MS4A1, HLA-DQA2, HLA-DQB2, GIMAP1, GIMAP7, CD2, CD3D, CD3E, CD5, CD6, CD19, CD37, CD52, CD69, CD48, IL16, IL7R, CCR5, SH2D1A, THEMIS, and ITK) are involved in the immune response or the regulation of immune cells, and most of them are immune cell surface molecules. Surprisingly, only a few of these genes, such as CD2, GZMK, CD69, MMP1, IL-16, and IL7R, are associated with BC prognosis. Among the remaining genes, some have previously been reported to be involved in the occurrence, development, and metastasis of malignant tumors, such as IL12B, CD37, ITK, SASH3, and SIPR4. However, most of these prognostic genes have not been thoroughly investigated in BC.
Among the genes that have not been reported to be associated with BC prognosis, we paid special attention to CXCL9 and GPR18, which are highly interconnected according to the PPI network. Previous studies have demonstrated that CXCL9 can mediate the recruitment of tumor-suppressive T cells and natural killer (NK) cells in several malignancies, which is associated with a higher lymphocytic infiltrate and more favorable prognosis [29–31]. However, CXCL9 can also mediate the chemotaxis of tumor-promoting cells, such as regulatory T cells, and their expression is associated with a worse prognosis in some cancers, such as nasopharyngeal carcinoma [32] and prostate cancer [33]. Narita el at. found that CXCL9 is a significant predictor for BCs compared to healthy controls [34], but it was confirmed for the first time in our study that high CXCL9 expression in BC indicates a good prognosis. GPR18 belongs to the G protein-coupled receptor family, which is involved in the development and progression of many tumors [35]. Qin reported that highly expressed GPR18 has intrinsic constitutive activity and can play a role in the inhibition of apoptosis in melanoma metastases [36]. However, we found that GPR18 is a protective factor for BC patients, which is consistent with the results of liver cancer patients [37]. S1PR4, a member of the endothelial differentiation G-protein-coupled receptor gene family, is a critical node in the PPI network and is involved in cell signaling in many different cell types. Recent studies demonstrated that S1PR4 can mediate ERK1/2 activation and plays an important role in tumor cell invasion and metastasis in prostate cancer and ER-negative BC [38]. In our study, the prognosis for patients with high expression level of S1PR4 was better, which is different from the conclusion of basic research. Therefore, more clinical studies are needed to determine whether S1PR4 is a valuable prognostic biomarker for BC.
In addition, we were also interested in SASH3 and PYHIN1. Through a previous literature review, we found only a few articles about SASH3. The protein encoded by this gene may function as a signaling adapter protein in lymphocytes. Importantly, there is evidence that it is closely related to the progression of head and neck squamous cell carcinoma and lung adenocarcinoma [39,40]. Although these conclusions are based on big data analysis, it can provide theoretical support for further basic research in BC. PYHIN1, also known as IFIX, is a member of the hematopoietic interferon (IFN)-inducible nuclear protein with the 200-amino-acid repeat (HIN-200) family. Ding found that the expression of IFIX was reduced in most human BCs and cell lines. Moreover, IFIXα, the longest isoform of IFIX, showed tumor-suppressor activity in a BC xenograft model [41]. The present study is the first to show that high PYHIN1 expression can improve the OS of patients with BC.
Through big data analysis, our study provides further evidence of the prognostic value of immune- and stromal-related genes for BC, and the immune and stromal scores were compared in different molecular subtypes and different TNM stages. The results of the present study have clinical and research implications, providing 31 genes with prognostic value. It is worth noting that these genes show their influence only on growth and progression at the cellular level, but support from clinical data is lacking. Therefore, our study further confirms previous results.
However, limitations of the present study should be noted. First, it was a retrospective study based on public databases. The performance of these prognostic DEGs might be more reliable if they were verified in a real-world cohort, but this was too time-consuming and expensive to implement in the present study. Second, this study analyzed only the association between immune/stromal-related gene expression and prognosis but did not consider the effect of the clinicopathological characteristics of BC because the purpose of our study was to find new genes with prognostic value to provide ideas for subsequent basic research. Thirdly, the expression levels of all genes were derived from transcriptome sequencing, which may be different from the actual protein expression due to epigenetic modification. Therefore, further experimental and clinical studies are needed to validate the predictive efficacy of our findings.
Conclusions
In summary, our bioinformatics analysis identified 31 tumor microenvironment-related genes as potential prognostic predictors for BC patients. Immune and stromal signature genes play an important role in BC. The results showed that some of these genes that have not been widely investigated previously might be additional predictive factors for BC patients. Moreover, the study provides a set of useful targets for future investigation into the tumor microenvironment and biomarkers.
Acknowledgements
We thank MD Anderson Cancer Center for developing the tool “ESTIMATE”, which is used to predict the presence of infiltrating stromal/immune cells in tumor tissue.
Abbreviations
- TCGA
The Cancer Genome Atlas
- GEO
Gene Expression Omnibus
- BC
breast cancer
- DEG
differentially expressed genes
- TIL
tumor-infiltrating lymphocytes
- CXCL9
C-X-C motif chemokine ligand 9
- GPR18
G protein-coupled receptor 18
- S1PR4
sphingosine-1-phosphate receptor 4
- SASH3
SAM and SH3 domain containing 3
- PYHIN1
pyrin and HIN domain family member 1
Footnotes
Availability of data and material
All the gene expression data and clinical data used in this study are available to the public from the GEO database (GSE20685) and TCGA Breast Cancer.
Conflict of interests
None.
Source of support: Departmental sources
References
- 1.Ferlay J, Soerjomataram I, Dikshit R, et al. Cancer incidence and mortality worldwide: Sources, methods and major patterns in GLOBOCAN 2012. Int J Cancer. 2015;136(5):E359–86. doi: 10.1002/ijc.29210. [DOI] [PubMed] [Google Scholar]
- 2.Foster TS, Miller JD, Boye ME, et al. The economic burden of metastatic breast cancer: A systematic review of literature from developed countries. Cancer Treat Rev. 2011;37(6):405–15. doi: 10.1016/j.ctrv.2010.12.008. [DOI] [PubMed] [Google Scholar]
- 3.Cancer Genome Atlas Network. Comprehensive molecular portraits of human breast tumours. Nature. 2012;490(7418):61–70. doi: 10.1038/nature11412. [DOI] [PMC free article] [PubMed] [Google Scholar]
- 4.Quail DF, Joyce JA. Microenvironmental regulation of tumor progression and metastasis. Nat Med. 2013;19(11):1423–37. doi: 10.1038/nm.3394. [DOI] [PMC free article] [PubMed] [Google Scholar]
- 5.Fridman WH, Pages F, Sautes-Fridman C, Galon J. The immune contexture in human tumours: impact on clinical outcome. Nat Rev Cancer. 2012;12(4):298–306. doi: 10.1038/nrc3245. [DOI] [PubMed] [Google Scholar]
- 6.Fu Q, Chen N, Ge C, et al. Prognostic value of tumor-infiltrating lymphocytes in melanoma: A systematic review and meta-analysis. Oncoimmunology. 2019;8(7):1593806. doi: 10.1080/2162402X.2019.1593806. [DOI] [PMC free article] [PubMed] [Google Scholar]
- 7.Santoiemma PP, Powell DJ., Jr Tumor infiltrating lymphocytes in ovarian cancer. Cancer Biol Ther. 2015;16(6):807–20. doi: 10.1080/15384047.2015.1040960. [DOI] [PMC free article] [PubMed] [Google Scholar]
- 8.Berntsson J, Svensson MC, Leandersson K, et al. The clinical impact of tumour-infiltrating lymphocytes in colorectal cancer differs by anatomical subsite: A cohort study. Int J Cancer. 2017;141(8):1654–66. doi: 10.1002/ijc.30869. [DOI] [PMC free article] [PubMed] [Google Scholar]
- 9.Kemi N, Eskuri M, Herva A, et al. Tumour-stroma ratio and prognosis in gastric adenocarcinoma. Br J Cancer. 2018;119(4):435–39. doi: 10.1038/s41416-018-0202-y. [DOI] [PMC free article] [PubMed] [Google Scholar]
- 10.Zhou ZJ, Xin HY, Li J, et al. Intratumoral plasmacytoid dendritic cells as a poor prognostic factor for hepatocellular carcinoma following curative resection. Cancer Immunol Immunother. 2019;68(8):1223–33. doi: 10.1007/s00262-019-02355-3. [DOI] [PMC free article] [PubMed] [Google Scholar]
- 11.Becht E, de Reynies A, Giraldo NA, et al. Immune and stromal classification of colorectal cancer is associated with molecular subtypes and relevant for precision immunotherapy. Clin Cancer Res. 2016;22(16):4057–66. doi: 10.1158/1078-0432.CCR-15-2879. [DOI] [PubMed] [Google Scholar]
- 12.Yoshihara K, Shahmoradgoli M, Martinez E, et al. Inferring tumour purity and stromal and immune cell admixture from expression data. Nat Commun. 2013;4:2612. doi: 10.1038/ncomms3612. [DOI] [PMC free article] [PubMed] [Google Scholar]
- 13.Yang S, Liu T, Nan H, et al. Comprehensive analysis of prognostic immune-related genes in the tumor microenvironment of cutaneous melanoma. J Cell Physiol. 2020;235(2):1025–35. doi: 10.1002/jcp.29018. [DOI] [PubMed] [Google Scholar]
- 14.Alonso MH, Ausso S, Lopez-Doriga A, et al. Comprehensive analysis of copy number aberrations in microsatellite stable colon cancer in view of stromal component. Br J Cancer. 2017;117(3):421–31. doi: 10.1038/bjc.2017.208. [DOI] [PMC free article] [PubMed] [Google Scholar]
- 15.Jia D, Li S, Li D, et al. Mining TCGA database for genes of prognostic value in glioblastoma microenvironment. Aging (Albany NY) 2018;10(4):592–605. doi: 10.18632/aging.101415. [DOI] [PMC free article] [PubMed] [Google Scholar]
- 16.Bai F, Jin Y, Zhang P, et al. Bioinformatic profiling of prognosis-related genes in the breast cancer immune microenvironment. Aging (Albany NY) 2019;11(21):9328–47. doi: 10.18632/aging.102373. [DOI] [PMC free article] [PubMed] [Google Scholar]
- 17.Li W, Sang M, Hao X, et al. Gene expression and DNA methylation analyses suggest that immune process-related ADCY6 is a prognostic factor of luminal-like breast cancer. J Cell Biochem. 2019 doi: 10.1002/jcb.29633. [Epub ahead of print] [DOI] [PubMed] [Google Scholar]
- 18.Gyorffy B, Lanczky A, Eklund AC, et al. An online survival analysis tool to rapidly assess the effect of 22,277 genes on breast cancer prognosis using microarray data of 1,809 patients. Breast Cancer Res Treat. 2010;123(3):725–31. doi: 10.1007/s10549-009-0674-9. [DOI] [PubMed] [Google Scholar]
- 19.Ritchie ME, Phipson B, Wu D, et al. limma powers differential expression analyses for RNA-sequencing and microarray studies. Nucleic Acids Res. 2015;43(7):e47. doi: 10.1093/nar/gkv007. [DOI] [PMC free article] [PubMed] [Google Scholar]
- 20.Huang da W, Sherman BT, Lempicki RA. Systematic and integrative analysis of large gene lists using DAVID bioinformatics resources. Nat Protoc. 2009;4(1):44–57. doi: 10.1038/nprot.2008.211. [DOI] [PubMed] [Google Scholar]
- 21.Szklarczyk D, Franceschini A, Wyder S, et al. STRING v10: protein-protein interaction networks, integrated over the tree of life. Nucleic Acids Res. 2015;43(Database issue):D447–52. doi: 10.1093/nar/gku1003. [DOI] [PMC free article] [PubMed] [Google Scholar]
- 22.Shannon P, Markiel A, Ozier O, et al. Cytoscape: A software environment for integrated models of biomolecular interaction networks. Genome Res. 2003;13(11):2498–504. doi: 10.1101/gr.1239303. [DOI] [PMC free article] [PubMed] [Google Scholar]
- 23.Burugu S, Asleh-Aburaya K, Nielsen TO. Immune infiltrates in the breast cancer microenvironment: Detection, characterization and clinical implication. Breast Cancer. 2017;24(1):3–15. doi: 10.1007/s12282-016-0698-z. [DOI] [PubMed] [Google Scholar]
- 24.Adams S, Gray RJ, Demaria S, et al. Prognostic value of tumor-infiltrating lymphocytes in triple-negative breast cancers from two phase III randomized adjuvant breast cancer trials: ECOG 2197 and ECOG 1199. J Clin Oncol. 2014;32(27):2959–66. doi: 10.1200/JCO.2013.55.0491. [DOI] [PMC free article] [PubMed] [Google Scholar]
- 25.Loi S, Michiels S, Salgado R, et al. Tumor infiltrating lymphocytes are prognostic in triple negative breast cancer and predictive for trastuzumab benefit in early breast cancer: Results from the FinHER trial. Ann Oncol. 2014;25(8):1544–50. doi: 10.1093/annonc/mdu112. [DOI] [PubMed] [Google Scholar]
- 26.Salgado R, Denkert C, Demaria S, et al. The evaluation of tumor-infiltrating lymphocytes (TILs) in breast cancer: Recommendations by an International TILs Working Group 2014. Ann Oncol. 2015;26(2):259–71. doi: 10.1093/annonc/mdu450. [DOI] [PMC free article] [PubMed] [Google Scholar]
- 27.Jung YY, Kim HM, Koo JS. The role of cancer-associated fibroblasts in breast cancer pathobiology. Histol Histopathol. 2016;31(4):371–78. doi: 10.14670/HH-11-700. [DOI] [PubMed] [Google Scholar]
- 28.Stanton SE, Disis ML. Clinical significance of tumor-infiltrating lymphocytes in breast cancer. J Immunother Cancer. 2016;4:59. doi: 10.1186/s40425-016-0165-6. [DOI] [PMC free article] [PubMed] [Google Scholar]
- 29.Bronger H, Singer J, Windmuller C, et al. CXCL9 and CXCL10 predict survival and are regulated by cyclooxygenase inhibition in advanced serous ovarian cancer. Br J Cancer. 2016;115(5):553–63. doi: 10.1038/bjc.2016.172. [DOI] [PMC free article] [PubMed] [Google Scholar]
- 30.Wendel M, Galani IE, Suri-Payer E, Cerwenka A. Natural killer cell accumulation in tumors is dependent on IFN-gamma and CXCR3 ligands. Cancer Res. 2008;68(20):8437–45. doi: 10.1158/0008-5472.CAN-08-1440. [DOI] [PubMed] [Google Scholar]
- 31.Gorbachev AV, Kobayashi H, Kudo D, et al. CXC chemokine ligand 9/monokine induced by IFN-gamma production by tumor cells is critical for T cell-mediated suppression of cutaneous tumors. J Immunol. 2007;178(4):2278–86. doi: 10.4049/jimmunol.178.4.2278. [DOI] [PubMed] [Google Scholar]
- 32.Hsin LJ, Kao HK, Chen IH, et al. Serum CXCL9 levels are associated with tumor progression and treatment outcome in patients with nasopharyngeal carcinoma. PLoS One. 2013;8(11):e80052. doi: 10.1371/journal.pone.0080052. [DOI] [PMC free article] [PubMed] [Google Scholar]
- 33.Tan S, Wang K, Sun F, et al. CXCL9 promotes prostate cancer progression through inhibition of cytokines from T cells. Mol Med Rep. 2018;18(2):1305–10. doi: 10.3892/mmr.2018.9152. [DOI] [PMC free article] [PubMed] [Google Scholar]
- 34.Narita D, Seclaman E, Anghel A, et al. Altered levels of plasma chemokines in breast cancer and their association with clinical and pathological characteristics. Neoplasma. 2016;63(1):141–49. doi: 10.4149/neo_2016_017. [DOI] [PubMed] [Google Scholar]
- 35.Lappano R, Jacquot Y, Maggiolini M. GPCR modulation in breast cancer. Int J Mol Sci. 2018;19(12) doi: 10.3390/ijms19123840. pii: E3840. [DOI] [PMC free article] [PubMed] [Google Scholar]
- 36.Qin Y, Verdegaal EM, Siderius M, et al. Quantitative expression profiling of G-protein-coupled receptors (GPCRs) in metastatic melanoma: the constitutively active orphan GPCR GPR18 as novel drug target. Pigment Cell Melanoma Res. 2011;24(1):207–18. doi: 10.1111/j.1755-148X.2010.00781.x. [DOI] [PubMed] [Google Scholar]
- 37.Qiao GJ, Chen L, Wu JC, Li ZR. Identification of an eight-gene signature for survival prediction for patients with hepatocellular carcinoma based on integrated bioinformatics analysis. Peer J. 2019;7:e6548. doi: 10.7717/peerj.6548. [DOI] [PMC free article] [PubMed] [Google Scholar]
- 38.Lee CF, Dang A, Hernandez E, et al. Activation of sphingosine kinase by lipopolysaccharide promotes prostate cancer cell invasion and metastasis via SphK1/S1PR4/matriptase. Oncogene. 2019;38(28):5580–98. doi: 10.1038/s41388-019-0833-3. [DOI] [PubMed] [Google Scholar]
- 39.Sanati N, Iancu OD, Wu G, et al. Network-based predictors of progression in head and neck squamous cell carcinoma. Front Genet. 2018;9:183. doi: 10.3389/fgene.2018.00183. [DOI] [PMC free article] [PubMed] [Google Scholar]
- 40.Li L, Peng M, Xue W, et al. Integrated analysis of dysregulated long non-coding RNAs/microRNAs/mRNAs in metastasis of lung adenocarcinoma. J Transl Med. 2018;16(1):372. doi: 10.1186/s12967-018-1732-z. [DOI] [PMC free article] [PubMed] [Google Scholar]
- 41.Ding Y, Wang L, Su LK, et al. Antitumor activity of IFIX, a novel interferon-inducible HIN-200 gene, in breast cancer. Oncogene. 2004;23(26):4556–66. doi: 10.1038/sj.onc.1207592. [DOI] [PubMed] [Google Scholar]


