

Summary
The humanized NOD/SCID/IL‐2 receptor γ‐chainnull (NSG) mouse model has been widely used for the study of HIV pathogenesis. Here, NSG mice with transgenic expression of human stem cell factor (SCF), granulocyte–macrophage colony‐stimulating factor (GM‐CSF) and interleukin (IL)‐3 (NSG‐SGM3) were injected with peripheral blood leukocytes (PBL mice) from two HIV‐infected (HIV+) patients who were under anti‐retroviral therapy (ART; referred as HIV+ mice) or one HIV‐seronegative healthy volunteer (HIV−). Such mice are either hu‐PBL‐NSG‐SGM3 HIV+ or HIV− mice, depending on the source of PBL. The kinetics of HIV replication and T cell responses following engraftment were evaluated in peripheral blood and secondary lymphoid tissues. High HIV replication and low CD4 : CD8 ratios were observed in HIV+ mice in the absence of anti‐retroviral therapy (ART). Consistent with high activation and skewed differentiation of T cells from the HIV‐infected donor, HIV+ mice exhibited a higher T cell co‐expression of human leukocyte antigen D‐related (HLA‐DR) and CD38 than HIV− mice, as well as a shifted differentiation to a CCR7−CD45RA+ terminal effector profile, even in the presence of ART. In addition, HIV replication and the activation/differentiation disturbances of T cells were associated with decreased plasma levels of IL‐17A. Thus, this hu‐PBL‐NSG‐SGM3 mouse model recapitulates some immune disturbances occurring in HIV‐infected patients, underlying its potential use for studying pathogenic events during this infection.
Keywords: CD38, HIV, HLA‐DR, IL‐17A, NSG‐SGM3, PD‐1, T cell
hu‐PBL‐NSG‐SGM3 mouse model recapitulates some immune disturbances occurring in HIV‐infected patients
Introduction
The study of immunological events occurring during HIV infection is limited by the low availability of animal models. The humanized non‐obese diabetic/severe combined immunodeficiency/interleukin 2 (NOD/SCID/IL‐2) receptor γ‐chainnull (NSG) mouse model has been used for the study of HIV pathogenesis 1. Mouse humanization depends on the cellular origin, delivery routes and the time of engraftment 2. Regarding the cell origin, human CD34+ hematopoietic stem cells (HSC) derived from cord blood, fetal liver or mobilized peripheral blood can be injected into newborn or young NSG mice, with subsequent reconstitution of most immune cell populations 3, 4. In addition, adult NSG mice can be humanized by injection of human peripheral blood leukocytes [NSG mice humanized with human peripheral blood mononuclear cells (PBMC) (hu‐PBL‐NSG mice)], allowing the temporal circulation of these cells in blood, secondary lymphoid organs and inflamed tissues 5, 6, 7. Furthermore, several transgenic strains of NSG mice have been developed, where human cytokines such as human stem cell factor (SCF), granulocyte–macrophage colony‐stimulating factor (GM‐CSF) and IL‐3, have been introduced to promote cell engraftment following HSC injection 2.
A major limitation of the hu‐PBL‐NSG mouse model is the short window for monitoring, as these mice develop xenogeneic graft‐versus‐host disease (GVHD) within a few weeks after cell engraftment, due to human T cell recognition of murine major histocompatibility complex (MHC) molecules 6. Nonetheless, this model has the advantage of being simple and accessible, particularly considering that PBL are more easily acquired 8. In addition, the hu‐PBL‐NSG mouse model allows the injection of primary cells directly from patients, which is useful for the study of cell‐ or pathogen‐intrinsic conditions of the donor. For instance, hu‐PBL‐NSG mice support HIV replication and mimic some features of disease 9, 10, highlighting their usefulness for the study of immunological and virological events of HIV infection.
During HIV infection, T cells undergo several phenotypical and functional alterations, such as high activation, exhaustion, skewed differentiation, low cytokine production and cytotoxicity and loss of specific effector subsets 11, 12. These alterations are incompletely restored by anti‐retroviral therapy (ART) 13. To evaluate whether some of these T cell alterations are evidenced in hu‐PBL‐NSG mice during HIV infection and the effect of ART‐induced viral suppression, in this study NSG mice with transgenic expression of human SCF, GM‐CSF and IL‐3 (NSG‐SGM3) 14, 15, 16 were injected with PBL from an HIV‐infected donor who was under suppressive ART. We explored the kinetics of HIV replication and the elicited T cell responses following engraftment and compared them with those in mice injected with PBL from a healthy donor. Together, our results indicate that hu‐PBL‐NSG‐SGM3 mice recapitulate some T cell disturbances, such as high activation and skewed differentiation, that were also seen in the HIV‐infected donor. A defect in IL‐17A production was also observed. These data support the use of this humanized mouse model to recapitulate some T cell alterations that are present in HIV‐infected patients, even in the context of ART‐induced viral suppression.
Methods
Ethics statement
All animal care and procedures were performed according to protocols reviewed and approved by the Institutional Animal Care and Use Committee (IACUC) at the University of Maryland School of Medicine. The collection of blood from an HIV‐infected patient was approved by the Institutional Review Board of University of Maryland School of Medicine (certificate number HP‐00040021). Cells from the HIV‐seronegative donor were isolated from a leukopack obtained from New York Blood Center. All experiments followed the principles expressed in the Declaration of Helsinki. The individuals signed the informed consent.
Collection of human PBL
In this study, we included two HIV‐infected patients under suppressive ART, as well as one HIV‐seronegative healthy volunteer. The characteristics of the individuals included are shown in Table 1. From each individual, 50 ml of venous blood was collected and anti‐coagulated with ethylenediamine tetraacetic acid (EDTA). PBL were isolated from the cellular fraction through a Ficoll density gradient (GE Healthcare, Chicago, IL, USA), washed with RPMI‐1640 supplemented with 10% fetal bovine serum (FBS) (both from gibco, St Louis, mo, usa) and cryopreserved in FBS containing 10% dimethyl sulfoxide (DMSO). PBL were thawed in a preheated serological bath at 37°C. Then, cells were rapidly transferred to 15‐ml polystyrene tubes containing 10 ml of cold medium to remove excess DMSO. Finally, cells were washed with medium and counted. Cell viability was ≥ 90% (Trypan blue exclusion staining) before injection into mice.
Table 1.
Characteristics of the study donors
| Donor | Years since diagnosis | Years since ART beginning | Current ART regimen | CD4+ T cell count (cells/µl) | CD8+ T cell count (cells/µl) | CD4:CD8 ratio | Viral load (HIV RNA copies/ml) |
|---|---|---|---|---|---|---|---|
| Seronegative | n.a. | n.a. | n.a. | 535 | 393 | 1·36 | n.a. |
| HIV+ #1 | 33 | 20 | Emtricitabine/Tenofovir disoproxil fumarate | 619 | 1426 | 0·43 | < 20 |
| HIV+ #2 | 29 | 29 | Bictegravir/emtricitabine/Tenofovir alefanamide | 1124 | 3394 | 0·33 | < 20 |
ART = anti‐retroviral therapy; n.a. = not available.
Generation of humanized mice
NOD.Cg‐Prkdcscid Il2rgtm1Wjl Tg(CMV‐IL3,CSF2,KITLG)1Eav/MloySzJ (NSG‐SGM3) mice were purchased from The Jackson Laboratory (JAX stock #013062). Figure 1a describes the experimental design as follows: 6–8‐week‐old mice were engrafted with 3·5 × 106 human PBL from HIV‐infected patients (n = 12 + seven mice) or a healthy individual (n = 10 mice), via intraperitoneal injection, in a volume of 200 μl. Mice were maintained with husbandry conditions and microbiological monitoring practices and were observed daily for morbidity and mortality, as previously reported 17. At week 3 post‐engraftment, mice were checked for human leukocyte reconstitution by flow cytometry (see below). Nine mice, engrafted with cells derived from an HIV‐infected patient, were treated with combined ART, consisting of tenofovir disoproxil fumarate (200 mg/tablet) plus emtricitabine (300 mg/tablet) (Truvada; Gilead Sciences, Foster City, CA, USA) and raltegravir (400 mg/tablet; Isentress; Merck, Kenilworth, NJ, USA), administered in drinking water. Human‐equivalent doses of tenofovir, emtricitabine and raltegravir were 61·7, 40·7 and 164 mg/kg/day, respectively, calculated according to Km values of 37 and 3 for humans and mice, respectively 18. Importantly, the same ART regimen was administered for 2 weeks to seven of the mice engrafted with cells derived from a healthy individual, without signs of toxicity (data not shown). Mice were serially bled from the retro‐orbital vein for cytometric and viral load analyses, and at weeks 6 and 7 post‐engraftment mice were euthanized by CO2 asphyxiation, followed by cervical dislocation for obtaining secondary lymphoid organs (LN). Plasma was collected for quantification of HIV RNA copy number by an in‐house real‐time reverse transcription–polymerase chain reaction (RT‐PCR), using HIV gag primers SK38/SK39 and SYBR green dyes, as previously reported 17, 19. The assay has a sensitivity of 150 HIV RNA copies/40 μl plasma.
Figure 1.
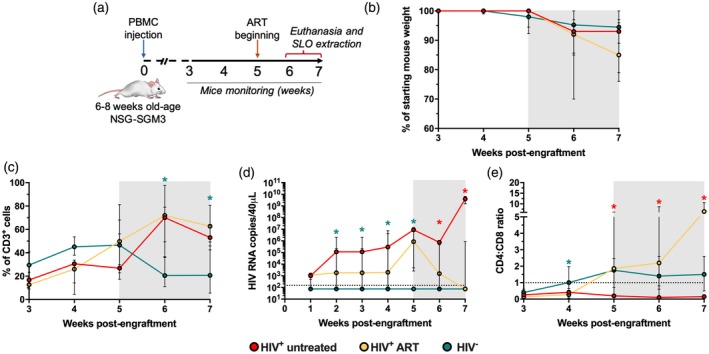
Non‐obese diabetic/severe combined immunodeficient/interleukin‐2 (NOD/SCID/IL‐2) (NSG‐SGM3) mice humanized with human peripheral blood mononuclear cells (PBMC) (hu‐PBL‐NSG‐SGM3) support HIV replication. (a) Study design. (b) Mouse body weight loss throughout monitoring time, normalized to the percentage of starting weight. (c,d) Frequency of CD3+ cells among total blood mononuclear cells (c), viral load (d) and CD4 : CD8 ratio (e) in hu‐PBL‐NSG‐SGM3 HIV+ untreated (n = 3), HIV+ anti‐retroviral therapy (ART) (n = 9) and HIV− mice (n = 10) throughout monitoring time. (c–e) *P ≤ 0·04 versus the other mouse groups, Kruskal–Wallis test. (b–e) The gray box indicates ART administration. (d) The dashed line indicates the limit of detection of the assay. (e) The dashed line indicates a CD4 : CD8 ratio = 1.
Flow cytometry
Peripheral blood, spleen and readily observable axillary and/or mesenteric lymph node (ALN and MLN, respectively) mononuclear cells were obtained from mice. Tissue samples were collected at necropsy and processed immediately in a 70‐μm‐pore size nylon cell strainer (Corning, New York, NY, USA), followed by mononuclear cell isolation through a Ficoll density gradient (GE Healthcare). Remaining red blood cells were lysed with ACK buffer (Quality Biological Inc., Gaithersburg, MD, USA). For phenotypical analyses, whole blood samples were incubated for 30 min at room temperature with optimized doses of the following anti‐human antibodies: CD3‐fluorescein isothiocyanate (FITC) (clone HIT3a; BD Biosciences, San Jose, CA, USA), CD4‐BV421 (clone RPA‐T4; BD Biosciences), CD8‐Alexa Fluor (AF) 700 (clone OKT8; Thermo Fisher, Waltham, MA, USA), human leukocyte antigen D‐related (HLA‐DR)‐antigen‐presenting cells (APC)‐eFluor 780 (clone LN3; Thermo Fisher), CD38‐phycoerythrin (PE) eFluor 610 (clone HIT2; Thermo Fisher), programmed cell death 1 (PD‐1)‐BV510 (clone EH12.1; BD), inducible T cell co‐stimulator (ICOS) AF647 (clone DX29, BD), CCR7‐PE (clone 3D12; Thermo Fisher) and CD45RA‐PE cyanin 7 (Cy7) (clone HI100; Biolegend, San Diego, CA, USA). After incubation, red cells from peripheral blood were lysed with BD FACS Lysing Solution (BD Biosciences), and all samples were washed twice with fluorescence activated cell sorter (FACS) buffer [1% FBS in ×1 phosphate‐buffered saline (PBS)]. Finally, cells were fixed with 1% paraformaldehyde in ×1 PBS, and acquired on a FACSAria II cytometer (BD Biosciences) within an hour of completing the staining. Data were analyzed with FlowJo software version 8.7 (Tree Star, Inc., Ashland, OH, USA).
Measurement of IL‐17A in plasma
The levels of IL‐17A in plasma were measured with the BD Biosciences cytometric bead array (CBA) human IL‐17A Flex Set, with a limit of detection of 0·3 pg/ml. The concentrations of IL‐17A were calculated by interpolation of the mean fluorescence intensities of the samples to a standard curve using 4‐parameter logistic regression with GraphPad Prism software version 7.0. Standard curves with R 2 > 0·99 and P < 0·0001 were obtained.
Statistical analysis
GraphPad Prism software version 7.0 was used for statistical analysis. Data are presented as medians and interquartile ranges. The Mann–Whitney test was used for comparison of two independent data. The Kruskal–Wallis and Dunn’s post‐hoc test was used for comparison of three or more groups. The degree of correlation between variables was determined with Spearman’s test. In all the analyses, a value equal to half the limit of detection of the assay was assigned to samples with non‐detectable viral load or IL‐17A. In all cases, a P‐value < 0·05 was considered significant.
Results
HIV replication in hu‐PBL‐NSG‐SGM3 mice
We evaluated a humanized mouse model of HIV infection, where PBL from an HIV‐infected patient who was under suppressive ART was injected into adult NSG‐SGM3 mice (hu‐PBL‐NSG‐SGM3 mice; Fig. 1a). To evaluate the effect of ART on the dynamics of viral replication and T cell response, the majority of hu‐PBL‐NSG‐SGM3 mice received ART following human cell engraftment. Animals which received cells from an HIV‐infected patient and remained untreated are referred to as ‘HIV+ untreated’, whereas those which received ART are referred to as ‘HIV+ ART’. We also included mice injected with PBL isolated from a HIV‐seronegative healthy individual (HIV− mice).
A feature of this model is the development of xenogeneic GVHD. As expected following 5 weeks post‐cell engraftment, hu‐PBL‐NSG‐SGM3 mice exhibited progressive weight loss, a common sign of GVHD 6, 20, which was comparable between HIV+ untreated, HIV+ ART and HIV− mice (Fig. 1b). We also observed the progressive development of other signs of GVHD, such as hair loss, hunched posture and reduced mobility, but only one mouse from the HIV+ untreated group died, possibly from GVHD at week 7 post‐engraftment, and its lymphoid organs were not evaluated.
Following engraftment, there was a sustained increase in the proportion of CD3+ cells among total blood leukocytes in the three groups of mice (Fig. 1c). However, after 5 weeks’ post‐engraftment, there was a decrease of CD3+ cells in HIV− mice (Fig. 1c), and their proportion was significantly lower than in mice that received PBL from an HIV‐infected patient at weeks 6 and 7 post‐engraftment. This heterogeneity could be related to the differentiation profile of T cells that can vary between the donors evaluated (see below), as well as intrinsic inter‐donor variability 5. When we determined the kinetics of HIV replication in hu‐PBL‐NSG‐SGM3 mice and the effect of ART, detectable viral load at week 1 post‐engraftment was observed in 11 of 12 HIV+ mice and the levels stabilized following 3 weeks post‐engraftment in the absence of therapy (Fig. 1d). As expected, ART administration resulted in a progressive decrease of viral load (Fig. 1d), whereas there was undetectable viral replication in HIV− mice (Fig. 1d). Finally, the increase in viral load coincided with a persistent low CD4 : CD8 ratio in HIV+ untreated mice, with a negative correlation between both parameters (rho ≤ −0·7, P ≤ 0·01), whereas this ratio was above 1 in HIV+ ART and HIV− mice (Fig. 1e).
Higher T cell activation in hu‐PBL‐NSG‐SGM3 HIV+ mice
We evaluated the T cell activation phenotype by the co‐expression of HLA‐DR and CD38 11, as well as PD‐1 and ICOS, which are induced after T cell receptor (TCR) stimulation 21, 22. First, we evaluated the expression of these markers in cells from the seronegative and HIV‐infected donors before they were injected into NSG‐SGM3 mice. As shown in Fig. 2a, compared with the seronegative donor, the HIV‐infected subject exhibited higher proportions of HLA‐DR+CD38+ and ICOS+CD4+ and CD8+ T cells, whereas CD4+ T cells had a higher expression of PD‐1. Next, we evaluated the activation profile of circulating T cells in hu‐PBL‐NSG‐SGM3. We observed massive T cell activation from week 3 post‐engraftment in HIV− mice, which was maintained throughout monitoring time (Fig. 2b–e). In HIV− mice, CD8+ T cells exhibited higher co‐expression of HLA‐DR and CD38 than CD4+ T cells (P ≤ 0·0003, Mann–Whitney test). Interestingly, HIV+ mice exhibited higher T cell activation levels than HIV− mice (Fig. 2b–e), but ART induced a decrease of HLA‐DR+CD38+ T cells, reaching levels similar to those in HIV− mice at weeks 6 and 7 post‐engraftment (Fig. 2b–e). Moreover, consistent with the high expression of PD‐1 in HLA‐DR/CD38‐expressing cells 23, 24, a high proportion of circulating T cells expressed PD‐1 that progressively decreased in HIV− mice but was maintained in HIV+ untreated and ART mice (Fig. 2b–e). Finally, HIV+ untreated and ART mice exhibited higher frequencies of ICOS+ T cells compared with HIV− mice (Fig. 2b–e).
Figure 2.
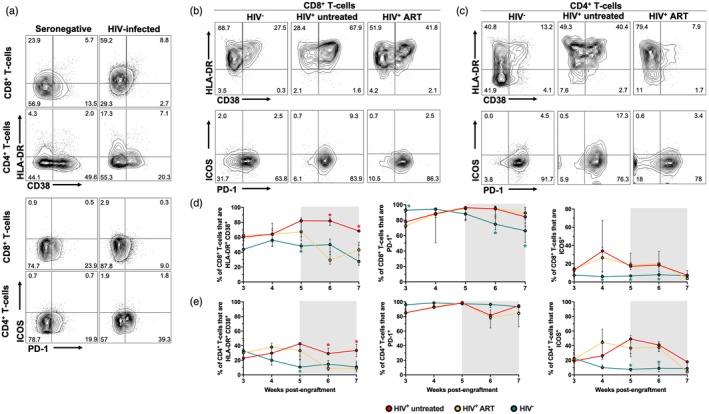
Higher T cell activation in non‐obese diabetic/severe combined immunodeficient/interleukin‐2 (NOD/SCID/IL‐2) receptor ‐chainnull (NSG) mice transgenic for human stem cell factor (SCF) (NSG‐SGM3) mice humanized with human peripheral blood mononuclear cells (PBMC) (hu‐PBL‐NSG‐SGM3) HIV+ mice. (a) Expression of human leukocyte antigen D‐related (HLA‐DR) and CD38 and programmed cell death 1 (PD‐1) and inducible T cell co‐stimulator (ICOS) in CD8+ and CD4+ T cells from the seronegative and HIV‐infected donors. (b,c) Representative contour plots of the expression of HLA‐DR and CD38 and PD‐1 and ICOS in circulating CD8+ (b) and CD4+ T cells (c) from hu‐PBL‐NSG‐SGM3 HIV−, HIV+ untreated and HIV+ anti‐retroviral therapy (ART) mice at week 7 post‐engraftment. (d,e) Frequencies of HLA‐DR+CD38+, PD‐1+ and ICOS+CD8+ (d) and CD4+ T cells (e) from hu‐PBL‐NSG‐SGM3 HIV− (n = 10), HIV+ untreated (n = 3) and HIV+ ART (n = 9) mice throughout monitoring time. (c–e) *P ≤ 0·03 versus the other mouse groups, Kruskal–Wallis test. (d,e) The gray box indicates ART administration.
Skewed T cell differentiation in hu‐PBL‐NSG‐SGM3 HIV+ mice
Next, we evaluated the differentiation profile of T cells, by evaluating the expression of CCR7 and CD45RA, which define naive (CCR7+CD45RA+), central memory (CCR7+CD45RA−), effector memory (CCR7−CD45RA−) and terminal effector cells that re‐express CD45RA (TEMRA; CCR7−CD45RA+) 25. Similar to previous reports 26, 27, the HIV‐infected patient exhibited a lower proportion of naive CD4+ T cells, with a higher frequency of effector cells before injection into mice (Fig. 3a). Interestingly, we also observed a shift to terminal differentiation CD8+ T cells, with an increased proportion of TEMRA cells (Fig. 3a). Consistent with the xenogeneic reaction in hu‐PBL‐NSG‐SGM3 mice 20, 28, HIV− mice exhibited a massive differentiation of CD4+ and CD8+ T cells to an effector memory profile, with the consequent decrease of naive cells (Fig. 3b–e). A low proportion of central memory and TEMRA cells was also observed in HIV− mice (Fig. 3b–e). It is worth mentioning that increased apoptosis of effector T cells may explain the decrease in the frequencies of total T cells in HIV− mice that we showed in Fig. 1c 29, 30. Remarkably, similar to the skewed differentiation of CD8+ T cells to TEMRA cells that we observed in the HIV‐infected donor (Fig. 3a), HIV+ mice showed a massive differentiation to TEMRA T cells (Fig. 3b–e) and had a higher proportion of naive cells compared with HIV− mice (Fig. 3b–e). Moreover, the differentiation to effector memory cells was lower in HIV+ mice than in HIV− mice (Fig. 3b–e). Notably, we only observed an effect of ART in HIV+ mice for the case of naive CD4+ T cells, which decreased to levels similar to HIV− mice after the initiation of ART (Fig. 3e).
Figure 3.
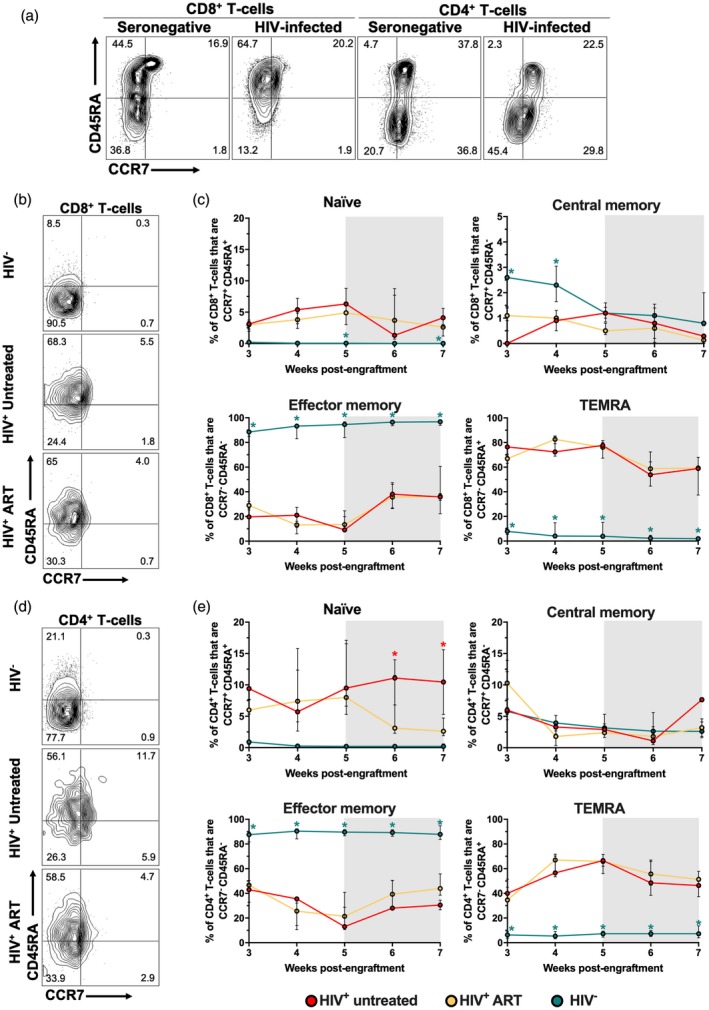
Skewed differentiation of T cells in non‐obese diabetic/severe combined immunodeficient/interleukin‐2 (NOD/SCID/IL‐2) receptor ‐chainnull (NSG) mice transgenic for human stem cell factor (SCF) (NSG‐SGM3) mice humanized with human peripheral blood mononuclear cells (PBMC) (hu‐PBL‐NSG‐SGM3) HIV+ mice. (a) Expression of CCR7 and CD45RA in CD8+ and CD4+ T cells from the seronegative and HIV‐infected donors. (b,d) Representative contour plots of the expression of CCR7 and CD45RA in circulating CD8+ (b) and CD4+ (d) T cells from hu‐PBL‐NSG‐SGM3 HIV−, HIV+‐untreated and HIV+ anti‐retroviral therapy (ART) mice at week 7 post‐engraftment. (c,e) Frequencies of CCR7+CD45RA+ (naive), CCR7+iCD45RA− (central memory), CCR7−CD45RA− (effector memory) and CCR7−CD45RA+ (TEMRA) CD8+ (c) and CD4+ (e) T cells from hu‐PBL‐NSG‐SGM3 HIV− (n = 10), HIV+ untreated (n = 3) and HIV+ ART (n = 9) mice throughout monitoring time. (c,e) *P ≤ 0·04 versus the other mouse groups, Kruskal–Wallis and Dunn’s post‐hoc test. (c,e) The gray box indicates ART administration.
To further evaluate the usefulness of the hu‐PBL‐NSG‐SGM3 mice to model T cell alterations occurring in HIV‐infected individuals, we included a second HIV+ donor and injected his PBL into NSG‐SGM3 mice. In a group of humanized mice, we also administered ART. Compared with mice humanized with cells from the first HIV+ donor (Fig. 1c–e), a similar kinetics of engraftment and viral reactivation was observed in this new group of animals (Supporting information, Fig. S1a,b), although the CD4 : CD8 ratios were persistently lower than 1 (Supporting information, Fig. S1c). However, before injection into mice, CD4+ and CD8+ T cells from the second donor showed a lower proportion of activated and PD‐1+ cells and a higher proportion of effector memory cells (Supporting information, Fig. S1d), compared with the cells from the first donor (Fig. 2a). After injection of the cells from the second HIV+ donor into mice, there was an increase in the proportion of HLA‐DR+ CD38+ T cells (Supporting information, Fig. S1e), although the frequencies were lower than those observed in mice engrafted with cells from the first HIV+ donor (Fig. 2d,e). The expression of PD‐1 also increased with the time of monitoring time cells (Supporting information, Fig. S1f), but the peak of expression was delayed compared with mice engrafted with cells from the first HIV+ donor (Fig. 2d,e). Finally, mice injected with cells from the second HIV+ donor exhibited a preferential expansion of effector memory T cells (Supporting information, Fig. S1g) instead of TEMRA cells, as observed in mice engrafted with cells from the first HIV+ donor (Fig. 3c,e). Finally, we did not observe any differences between the hu‐PBL‐NSG‐SGM3 untreated and ART mice after engraftment with cells from the second HIV+ donor. Altogether, these results indicate that hu‐PBL‐NSG‐SGM3 mice reproduce donor‐specific patterns and kinetics of T cells in the context of HIV reactivation.
Alterations of T cells in spleen and lymph nodes from hu‐PBL‐NSG‐SGM3 HIV+ mice
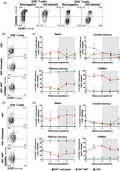
Subsequently, we evaluated the activation and differentiation profile of T cells in spleen and lymph nodes (LN) from hu‐PBL‐NSG‐SGM3 mice. Of note, no lymph nodes could be identified in some mice. As shown in Fig. 4a, there was a slight tendency towards lower frequencies of total T cells in spleen and LN from HIV− mice compared with HIV+ mice, consistent with our blood results (Fig. 1c). Similarly, HIV+ untreated mice had lower CD4 : CD8 ratios compared with HIV+ ART and HIV− mice, supporting the virus‐induced depletion of CD4+ T cells 9, 10. Interestingly, the three groups of mice exhibited comparable proportions of HLA‐DR+CD38+CD8+ T cells in secondary lymphoid organs (Fig. 4c). Remarkably, the frequency of activated CD8+ T cells in HIV− mice was higher in spleen than in blood (Fig. 2), so that a possible cell redistribution in this organ in HIV− mice may be hindering the differences with the HIV+ mice. Indeed, higher frequencies of HLA‐DR+CD38+CD4+ T cells were observed in spleen compared with LN in HIV− mice (Supporting information, Fig. S2a), supporting this assumption. Moreover, similar to blood results, HIV+ ART mice had higher proportions of PD‐1+CD8+ T cells compared with HIV− mice (Fig. 4d), whereas they were comparable between mice and secondary lymphoid organs in the case of CD4+ T cells (Supporting information, Fig. S2b). Finally, when we evaluated the differentiation stage of CD8+ T cells in lymphoid tissues, we observed an increased proportion of effector memory cells at the expense of low frequencies for the other subsets in HIV− mice, both in spleen and LN (Fig. 4e–h). In contrast, HIV+ mice showed a dominant effector memory and TEMRA cell response (Fig. 4g,h) and a higher proportion of naive cells than HIV− mice, both in spleen and LN (Fig. 4e), coinciding with those results obtained from blood samples (Fig. 3). Similar results were obtained for CCR7/CD45RA‐expressing CD4+ T cells (Supporting information, Fig. S2c–f). Finally, to evaluate if T cells were similarly distributed between blood and secondary lymphoid organs, we established an association between the frequencies of T cells in blood and spleen or LN in all the mice included. Interestingly, we observed strong positive correlations between blood and both secondary lymphoid organs in the proportion of CD3+ cells (rho = 0·79, P < 0·0001 and rho = 0·61, P = 0·02, blood versus spleen and blood versus LN, respectively), the CD4 : CD8 ratio (rho = 0·83, P < 0·0001 and rho = 0·71, P = 0·005, blood versus spleen and blood versus LN, respectively), as well as in the frequencies of effector memory (rho = 0·91, P < 0·0001 and rho = 0·76, P < 0·0001, blood versus spleen and blood versus LN, respectively) and TEMRA cells (rho = 0·77, P < 0·0001 and rho = 0·60, P = 0·02, blood versus spleen and blood versus LN, respectively). Altogether, these results indicate that T cells distribute from blood to secondary lymphoid organs in hu‐PBL‐NSG‐SGM3, and in the case of HIV+ mice they exhibit alterations in their activation and differentiation programs similar to those found in circulating cells.
Figure 4.
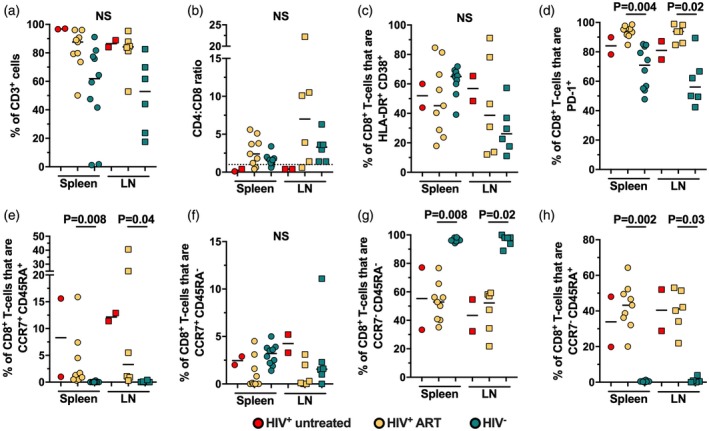
High activation and skewed differentiation of T cells in secondary lymphoid tissues from non‐obese diabetic/severe combined immunodeficient/interleukin‐2 (NOD/SCID/IL‐2) receptor ‐chainnull (NSG) mice transgenic for human stem cell factor (SCF) (NSG‐SGM3) mice humanized with human peripheral blood mononuclear cells (PBMC) (hu‐PBL‐NSG‐SGM3) HIV+ mice. Frequency of CD3+ cells among total blood mononuclear cells (a), CD4:CD8 ratio (a), frequency of HLA‐DR+CD38+CD8+ T cells (C), PD‐1+CD8+ T cells (a), CCR7+CD45RA+ (naive; e), CCR7+CD45RA− (central memory; f), CCR7−CD45RA− (effector memory; g) and CCR7−CD45RA+ (TEMRA; h) CD8+ T cells in spleen (circles) and lymph nodes (squares) from hu‐PBL‐NSG‐SGM3 HIV− (n = 10), HIV+ untreated (n = 3) and HIV+ anti‐retroviral therapy (ART) (n = 9) mice. P‐value of the Kruskal–Wallis and Dunn’s post‐hoc test; n.s.: not statistically significant. (b) The dashed line indicates a CD4 : CD8 ratio = 1.
Low levels of IL‐17A in hu‐PBL‐NSG‐SGM3 HIV+ untreated mice
An important immune defect occurring during HIV infection is the loss of IL‐17‐producing T cells 31. To explore if the hu‐PBL‐NSG‐SGM3 mouse model recapitulates the deficiency in IL‐17A secretion during HIV infection, we evaluated plasma levels of IL‐17A in the three groups of mice throughout monitoring time. Interestingly, in contrast to a previous report where low levels of IL‐17A were found in hu‐PBL‐NSG mice 28, we observed a progressive increase of plasma IL‐17A in HIV− mice, which was sustained for up to 7 weeks post‐engraftment (Fig. 5a). Remarkably, HIV+ untreated mice had low to undetectable levels of IL‐17A throughout monitoring time, whereas HIV+ ART mice reached levels similar to those in HIV− mice (Fig. 5a).
Figure 5.
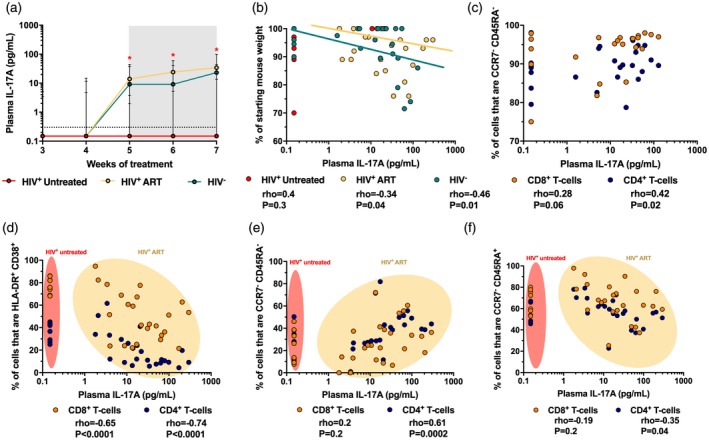
Low levels of interleukin (IL)‐17A in non‐obese diabetic/severe combined immunodeficient/interleukin‐2 (NOD/SCID/IL‐2) receptor ‐chainnull (NSG) mice transgenic for human stem cell factor (SCF) humanized with human peripheral blood mononuclear cells (PBMC) (hu‐PBL‐NSG‐SGM3) HIV+ untreated mice. (a) Plasma levels of IL‐17A in hu‐PBL‐NSG‐SGM3 HIV− (n = 10), HIV+ untreated (n = 3) and HIV+ anti‐retroviral therapy (ART) (n = 9) mice throughout monitoring time. *P ≤ 0·04 versus the other mouse groups, Kruskal–Wallis and Dunn’s post‐hoc test. The gray box indicates anti‐retroviral therapy (ART) administration. The dashed line indicates the limit of detection of the assay. (b) Correlation between plasma levels of IL‐17A and the mouse body weight loss throughout monitoring time, shown as the percentage of starting weight. The rho and P‐value of Spearman’s test are shown for each mouse group. (c) Correlation between plasma levels of IL‐17A and the frequency of CCR7−CD45RA− (effector memory) CD8+ and CD4+ T cells in HIV− mice. (d,f) Correlation between plasma levels of IL‐17A and the frequency of HLA‐DR+CD38+ (d), CCR7−CD45RA− (effector memory; e) and CCR7−CD45RA+ (TEMRA; f) CD8+ and CD4+ T cells in HIV+ untreated and ART mice. (c–f) Data of weeks 5–7 are shown. The rho and P‐value of Spearman’s test are shown for each T cell population.
IL‐17A is associated with weight loss, a common sign of GVHD, in hu‐PBL‐NSG‐SGM3 mice
During immune reactions, IL‐17A promotes inflammation and plays a role in the pathogenesis of autoimmune and chronic inflammatory diseases 32. In addition, IL‐17A plays a role in the development of GVHD 33, 34, 35. Thus, we evaluated if plasma IL‐17A levels were associated with the development of GVHD in hu‐PBL‐NSG‐SGM3 mice. Certainly, we observed a negative correlation between the levels of IL‐17A and the mouse weight throughout time in the HIV‐ group (Fig. 5b), indicating that the cytokine is associated with weight loss, a common sign of GVHD in this model. Interestingly, we obtained a similar correlation in HIV+ ART mice (Fig. 5b), but this was not observed in HIV+ untreated mice, where most of them had undetectable IL‐17A levels throughout monitoring time (Fig. 5b).
Low levels of IL‐17A in hu‐PBL‐NSG‐SGM3 HIV+ mice are associated with high activation and skewed differentiation of T cells
Ultimately, we explored if the lower secretion of IL‐17A in HIV+ mice was associated with higher activation and skewed differentiation of T cells to a late‐stage profile. Among CD4+ and CD8+ T cells, effector populations are an important source of IL‐17A 36, 37. Accordingly, we observed a positive correlation between the frequencies of effector memory CD4+ and CD8+ T cells and plasma levels of IL‐17A (Fig. 5c), indicating that this subset is the most probable source of this cytokine. Next, we explored if higher levels of T cell activation were associated with the reduced levels of plasma IL‐17A in HIV+ mice. We observed a negative correlation between the frequency of HLA‐DR+ CD38+ T cells and plasma levels of IL‐17A (Fig. 5d). Note that even in HIV+ ART mice, those with higher levels of T cell activation had low levels of IL‐17A (Fig. 5d). We did not find this association in HIV− mice (rho = −0·4 and −0·09, P = 0·1 and 0·6, CD4+ and CD8+ T cells, respectively). Finally, we evaluated if the differentiation program of T cells was associated with the levels of plasma IL‐17A in HIV+ mice. We found a positive correlation between the frequencies of effector memory CD4+ but not CD8+ T cells and plasma levels of IL‐17A (Fig. 5e), further suggesting that effector T cells are the source of IL‐17A. Interestingly, we found a negative correlation between the frequencies of TEMRA CD4+ T cells and plasma levels of IL‐17A in HIV+ mice (Fig. 5f), but this association was not seen in HIV− mice (rho = −0·2 and −0·1, P = 0·2 and 0·4, CD4+ and CD8+ T cells, respectively; data not shown).
Discussion
Previous reports have evaluated PBL engraftment in NSG or in similar immunodeficient mouse strains 5, 9, 10, 38. NSG‐SGM3 mice have been also useful for the study of the pathogenesis of viral infectious diseases 39, 40, 41, anaphylaxis 42 and malignancies 14. To our knowledge, this is the first report evaluating hu‐PBL‐NSG‐SGM3 mice in the setting of HIV infection. A feature of this model is the development of xenogeneic GVHD, which depends on the host expression of MHC molecules recognized by engrafted human T cells 6. Of note, in comparison with previous studies 5, 6, 9, we injected a lower number of PBL into NSG‐SGM3 mice in this study, which is reflected in delayed development of GVHD 6, allowing a longer period of time to monitor the mice. hu‐PBL‐NSG‐SGM3 mice successfully reconstituted T cells, supported HIV replication and responded to ART, allowing screening of the animals up to 7 weeks post‐engraftment. Our results are consistent with previous reports where PBL from healthy donors were injected into immunocompromised mice, followed by an HIV challenge 9, 10, 43, 44. Importantly, in the present study, mouse inter‐ and intragroup variability was observed for the viral load levels. However, this variability has been observed when PBL‐humanized immunodeficient mice were infected with different HIV strains, and could be related to the amount of human cells engrafted 5, the replicative capacity of the virus used for humanized mouse infection or the virus loads present in the patient sample, as well as the type of immunodeficient mouse strain 43, 45, 46. Nonetheless, our results indicate that the kinetics of HIV reactivation is comparable between the hu‐PBL‐NSG‐SGM3 mice, as evidenced by the detection of viral RNA in most of the mice at week 1 post‐engraftment and subsequent stabilization, as well as the ART‐induced viral suppression. Importantly, mouse engraftment with PBL from HIV‐infected patients under ART allows the study of viral diversity, the dynamics of virus reactivation in the absence of therapy and the T cell response after ART interruption, as well as novel anti‐viral therapeutics 38.
Consistent with previous reports showing increased T cell activation in hu‐PBL‐NSG mice associated with the development of GVHD 5, 7, hu‐PBL‐NSG‐SGM3 HIV− mice had increased frequencies of circulating HLA‐DR+CD38+ T cells. Similar to a previous report 5, the frequency of activated T cells in lymphoid tissues from HIV− mice was higher than in blood, suggesting that activated T cells are migrating to secondary lymphoid organs in response to the xenogeneic reaction. Importantly, it should be considered that the migration of activated T cells to inflamed tissues such as the skin 6, 7, 20 resembles other GVHD signs such as hair loss 20. Interestingly, we observed a higher T cell activation in hu‐PBL‐NSG‐SGM3 HIV+ mice, similar to what we observed in the patient cells. These results are consistent with the increased T cell activation during HIV infection that persists despite viral suppression induced by ART 47, 48. Lack of immune reconstitution induced by ART is also evidenced in the inverse CD4 : CD8 ratio in the HIV‐infected donor 49. Moreover, our data indicate that T cells are activated by xenogeneic reactions in hu‐PBL‐NSG‐SGM3 mice, but the activation threshold is lower in cells derived from an HIV‐infected patient, similar to what occurs after ex‐vivo polyclonal stimulation 24. Accordingly, T cells from HIV‐infected patients exhibit increased basal phosphorylation of TCR signaling proteins due to persistent activation signals 50 that can result in alterations in the response to secondary challenges, as evidenced in our mouse model.
In addition to a high activation profile of T cells, we observed a deviation to a TEMRA profile in T cells from hu‐PBL‐NSG‐SGM3 HIV+ mice, which was similar to the differentiation profile of CD8+ T cells in the HIV‐infected donor. These results are consistent with the skewed differentiation of T cells during HIV infection towards intermediate–late stages 12 and advance to a replicative‐senescence state, product of persistent activation 51. In addition, we observed an accumulation of naive T cells in HIV+ mice compared with HIV− mice, which can be linked to the inappropriate response and differentiation of this subset after TCR signals due to cell‐intrinsic deficiencies in HIV‐infected patients 50. Importantly, these alterations are incompletely reversed by ART‐induced viral suppression 48. Thus, the hu‐PBL‐NSG‐SGM3 mouse model recapitulates some features of the T cell activation and differentiation response, maintaining the T cell characteristics seen in the HIV‐infected donor, which could be useful for post‐treatment interruption studies.
Among the large immune alterations observed in HIV‐infected patients, the decrease in IL‐17A‐producing T cells plays a critical role in disease pathogenesis 31. This cytokine is mainly produced by CD4+ and CD8+ T cells, γδ T cells, group 3 innate lymphoid cells, natural killer (NK) cells and NK T cells 52, 53. It has several beneficial effects on gastrointestinal mucosa, such as the promotion of the conformation of tight junctions in epithelial cells 54, secretion of anti‐microbial peptides 55 and recruitment of immune cells to sites of mucosal injury 56. In the context of HIV infection, these mucosal effects of IL‐17A help to prevent the disruption of gut barrier and consequent microbial translocation 57, which are associated with disease progression 58. However, during HIV infection, IL‐17A‐producing T cells are lost in the periphery and in the gastrointestinal tract due to direct virus infection or bystander effects 24, 59, 60, 61. Thus, the lower availability of IL‐17A worsens the disruption of the gut barrier and the consequent microbial translocation and immune activation 62. Our data indicate that hu‐PBL‐NSG‐SGM3 mice support IL‐17A secretion, mimicking the deficiency of this cytokine during untreated HIV infection. Although in this study we were not able to determine the direct mechanism of impairment of IL‐17A secretion in HIV+ untreated mice, direct viral effects on IL‐17A‐producing CD4+ T cells are probably involved 59, as HIV+ ART mice had unaltered secretion of this cytokine (Fig. 5a). Moreover, the immune activation state and possibly dysfunction of T cells, as well as an altered differentiation of T cells, were associated with an impaired secretion of IL‐17A in hu‐PBL‐NSG‐SGM3, similar to previous human reports 24, 60. Importantly, we also determined the IL‐17A levels in plasma from the seronegative and HIV‐infected donors and, consistent with previous reports showing low circulating levels of this cytokine in healthy individuals and even in autoimmune diseases 63, 64, 65, the IL‐17A levels in both donors were below the limit of detection of the assay. Nonetheless, in an environment promoting IL‐17A production, such as xenogeneic GVHD, T cells derived from the healthy, but not the HIV‐infected donor, were able to produce IL‐17A. Thus, our findings support that this hu‐PBL‐NSG‐SGM3 model of HIV infection recapitulates the dysfunction of IL‐17A‐producing T cells during HIV infection.
Finally, we observed an association between plasma IL‐17A, probably produced by effector memory T cells and the development of GVHD. Indeed, previous reports have shown that this cytokine may play a role in the development of GVHD by inducing the production of proinflammatory cytokines and T cell cytotoxicity 33, 34, 35. Of note, in the case of mice with undetectable levels of IL‐17A, the secretion of interferon‐γ is most probably responsible for the weight loss and GVHD development, as previously reported 35. Together, these results support the role of IL‐17A in the development of GVHD and highlight the use of hu‐PBL‐NSG‐SGM3 for the study of novel therapeutics and the pathogenesis of this disease and novel therapeutics.
Conclusions
NSG‐SGM3 mice support HIV replication following engraftment with PBL from an HIV‐infected donor. In addition, hu‐PBL‐NSG‐SGM3 HIV+ mice mimic some T cell alterations, such as higher activation and skewed differentiation, which were associated with impaired IL‐17A secretion. Thus, the hu‐PBL‐NSG‐SGM3 mouse model is suitable for the study of some immune alterations of HIV infection and novel anti‐viral or immunomodulatory therapeutics.
Disclosures
The authors declare no conflicts of interest.
Author contributions
F. P.‐C. wrote the initial project, performed experiments, analyzed the results and wrote the first draft manuscript; S. M.‐M. performed experiments and reviewed and edited the manuscript; H. D., J. B., S. K. and R. R. R. reviewed and edited the manuscript; N. A. T. and M. T. R. wrote initial project, reviewed and edited the manuscript; JCZ wrote the initial project, performed experiments, supervised and administered the project, reviewed and edited the manuscript.
Supporting information
Figure S1. Frequency of CD3+ cells among total blood mononuclear cells (A), viral load (B), and CD4:CD8 ratio (C) in hu‐PBL‐NSG‐SGM3 HIV+ untreated (n = 3) and HIV+ ART (n = 4) mice throughout monitoring time. Mice were humanized with cells from a second HIV+ donor. D. Expression of HLA‐DR, CD38, CCR7, CD45RA and PD‐1 in CD4+ and CD8+ T‐cells before injection into mice. E and F. Frequencies of HLA‐DR+ CD38+ (E) and PD‐1+ (F) CD4+ and CD8+ T‐cells in hu‐PBL‐NSG‐SGM3 HIV+ untreated and HIV+ ART mice throughout monitoring time. G. Frequencies of CCR7+ CD45RA+ (naïve), CCR7+ CD45RA‐ (central memory), CCR7‐ CD45RA‐ (effector memory) and CCR7‐ CD45RA+ (TEMRA) CD4+ and CD8+ T‐cells in hu‐PBL‐NSG‐SGM3 HIV+ untreated and HIV+ ART mice throughout monitoring time. The gray box indicates ART administration. In B, the dashed line indicates the limit of detection of the assay. In C, the dashed line indicates a CD4:CD8 ratio = 1.
Figure S2. Frequency of HLA‐DR+ CD38+ CD4+ T‐cells (A), PD‐1+ CD4+ T‐cells (B), CCR7+ CD45RA+ (naïve; C), CCR7+ CD45RA‐ (central memory; D), CCR7‐ CD45RA‐ (effector memory; E) and CCR7‐ CD45RA+ (TEMRA; F) CD4+ T‐cells in spleen (circles) and lymph nodes (squares) from hu‐PBL‐NSG‐SGM3 HIV‐ (n = 10), HIV+ untreated (n = 3) and HIV+ ART (n = 9) mice. P value of the Kruskal‐Wallis and Dunn’s post‐hoc test. NS: Not statistically significant.
Acknowledgements
This work was supported by IHV clinical division internal funds. F. P.‐C. was supported by Universidad de Antioquia, Corporacion Universitaria Remington and Fundacion Sapiencia in Medellin, Colombia for an 8‐month research position at the Institute of Human Virology of the University of Maryland School of Medicine, Baltimore, USA.
References
- 1. Shultz LD, Ishikawa F, Greiner DL. Humanized mice in translational biomedical research. Nat Rev Immunol 2007; 7:118–30. [DOI] [PubMed] [Google Scholar]
- 2. Skelton JK, Ortega‐Prieto AM, Dorner M. A Hitchhiker’s guide to humanized mice: new pathways to studying viral infections. Immunology 2018; 154:50–61. [DOI] [PMC free article] [PubMed] [Google Scholar]
- 3. Ito M, Hiramatsu H, Kobayashi K et al NOD/SCID/γcnull mouse: An excellent recipient mouse model for engraftment of human cells. Blood 2002; 100:3175–82. [DOI] [PubMed] [Google Scholar]
- 4. Shultz LD, Lyons BL, Burzenski LM et al Human lymphoid and myeloid cell development in NOD/LtSz‐scid IL2R gamma null mice engrafted with mobilized human hemopoietic stem cells. J Immunol 2005; 174:6477–89. [DOI] [PubMed] [Google Scholar]
- 5. King M, Pearson T, Shultz LD et al A new Hu‐PBL model for the study of human islet alloreactivity based on NOD‐scid mice bearing a targeted mutation in the IL‐2 receptor gamma chain gene. Clin Immunol 2008; 126:303–14. [DOI] [PubMed] [Google Scholar]
- 6. King MA, Covassin L, Brehm MA et al Human peripheral blood leucocyte non‐obese diabetic–severe combined immunodeficiency interleukin‐2 receptor gamma chain gene mouse model of xenogeneic graft‐versus‐host‐ disease and the role of host major histocompatibility complex. Clin Exp Immunol 2009; 157:104–18. [DOI] [PMC free article] [PubMed] [Google Scholar]
- 7. Covassin L, Laning J, Abdi R et al Human peripheral blood CD4 T cell‐engrafted non‐obese diabetic‐scid IL‐2rgamma(null) H2‐Ab1 (tm1Gru) Tg (human leucocyte antigen D‐related 4) mice: a mouse model of human allogeneic graft‐versus‐host disease. Clin Exp Immunol 2011; 166:269–80. [DOI] [PMC free article] [PubMed] [Google Scholar]
- 8. Brehm MA, Wiles MV, Greiner DL, Shultz LD. Generation of improved humanized mouse models for human infectious diseases. J Immunol Meth 2014; 410:3–17. [DOI] [PMC free article] [PubMed] [Google Scholar]
- 9. Nakata H, Maeda K, Miyakawa T et al Potent anti‐R5 human immunodeficiency virus type 1 effects of a CCR5 antagonist, AK602/ONO4128/GW873140, in a novel human peripheral blood mononuclear cell nonobese diabetic‐SCID, interleukin‐2 receptor gamma‐chain‐knocked‐out AIDS mouse model. J Virol 2005; 79:2087–96. [DOI] [PMC free article] [PubMed] [Google Scholar]
- 10. Kim KC, Choi B‐S, Kim K‐C et al A simple mouse model for the study of human immunodeficiency virus. AIDS Res Hum Retroviruses 2016; 32:194–202. [DOI] [PMC free article] [PubMed] [Google Scholar]
- 11. Paiardini M, Müller‐Trutwin M. HIV‐associated chronic immune activation. Immunol Rev 2013; 254:78–101. [DOI] [PMC free article] [PubMed] [Google Scholar]
- 12. Appay V, Rowland‐Jones SL. Lessons from the study of T‐cell differentiation in persistent human virus infection. Semin Immunol 2004; 16:205–12. [DOI] [PubMed] [Google Scholar]
- 13. Wilson EMP, Sereti I. Immune restoration after antiretroviral therapy: the pitfalls of hasty or incomplete repairs. Immunol Rev 2013; 254:343–54. [DOI] [PMC free article] [PubMed] [Google Scholar]
- 14. Wunderlich M, Chou F‐S, Link KA et al AML xenograft efficiency is significantly improved in NOD/SCID‐IL2RG mice constitutively expressing human SCF, GM‐CSF and IL‐3. Leukemia 2010; 24:1785–8. [DOI] [PMC free article] [PubMed] [Google Scholar]
- 15. Billerbeck E, Barry WT, Mu K, Dorner M, Rice CM, Ploss A. Development of human CD4+FoxP3+ regulatory T cells in human stem cell factor‐, granulocyte‐macrophage colony‐stimulating factor‐, and interleukin‐3‐expressing NOD‐SCID IL2Rγnull humanized mice. Blood 2011; 117:3076–86. [DOI] [PMC free article] [PubMed] [Google Scholar]
- 16. Coughlan AM, Harmon C, Whelan S et al Myeloid engraftment in humanized mice: impact of granulocyte‐colony stimulating factor treatment and transgenic mouse strain. Stem Cells Dev 2016; 25:530–41. [DOI] [PubMed] [Google Scholar]
- 17. Medina‐Moreno S, Dowling TC, Zapata JC et al Targeting of CDK9 with indirubin 3′‐monoxime safely and durably reduces HIV viremia in chronically infected humanized mice. PLOS ONE 2017; 12:1–13. [DOI] [PMC free article] [PubMed] [Google Scholar]
- 18. Nair A, Jacob S. A simple practice guide for dose conversion between animals and human. J Basic Clin Pharm 2016; 7:27–31. [DOI] [PMC free article] [PubMed] [Google Scholar]
- 19. Heredia A, Le N, Gartenhaus RB et al Targeting of mTOR catalytic site inhibits multiple steps of the HIV‐1 lifecycle and suppresses HIV‐1 viremia in humanized mice. Proc Natl Acad Sci USA 2015; 112:9412–7. [DOI] [PMC free article] [PubMed] [Google Scholar]
- 20. Ali N, Flutter B, Sanchez Rodriguez R et al Xenogeneic graft‐versus‐host‐disease in NOD‐scid IL‐2Rγnull mice display a T‐effector memory phenotype. PLOS ONE 2012; 7:1–10. [DOI] [PMC free article] [PubMed] [Google Scholar]
- 21. Rekik R, Belhadj Hmida N, Ben Hmid A, Zamali I, Kammoun N, Ben Ahmed M. PD‐1 induction through TCR activation is partially regulated by endogenous TGF‐β. Cell Mol Immunol 2015; 12:648–9. [DOI] [PMC free article] [PubMed] [Google Scholar]
- 22. Hutloff A, Dittrich AM, Beier KC et al ICOS is an inducible T‐cell co‐stimulator structurally and functionally related to CD28. Nature 1999; 397:263–6. [DOI] [PubMed] [Google Scholar]
- 23. Hoffmann M, Pantazis N, Martin GE et al Exhaustion of activated CD8 T cells predicts disease progression in primary HIV‐1 infection. PLOS Pathog 2016; 12:1–19. [DOI] [PMC free article] [PubMed] [Google Scholar]
- 24. Perdomo‐Celis F, Feria MG, Taborda NA, Rugeles MT. A low frequency of IL‐17‐producing CD8+ T‐cells is associated with persistent immune activation in people living with HIV despite HAART‐induced viral suppression. Front Immunol 2018; 9:1–14. [DOI] [PMC free article] [PubMed] [Google Scholar]
- 25. Sallusto F, Lenig D, Forster R, Lipp M, Lanzavecchia A. Two subsets of memory T lymphocytes with distinct homing potentials and effector functions. Nature 1999; 401:708–12. [DOI] [PubMed] [Google Scholar]
- 26. Roederer M, Dubs JG, Anderson MT, Raju PA, Herzenberg LA, Herzenberg LA. CD8 naive T cell counts decrease progressively in HIV‐infected adults. J Clin Invest 1995; 95:2061–6. [DOI] [PMC free article] [PubMed] [Google Scholar]
- 27. Chen G, Shankar P, Lange C et al CD8 T cells specific for human immunodeficiency virus, Epstein‐Barr virus, and cytomegalovirus lack molecules for homing to lymphoid sites of infection. Blood 2001; 98:156–64. [DOI] [PubMed] [Google Scholar]
- 28. Ehx G, Somja J, Warnatz H‐J et al Xenogeneic graft‐versus‐host disease in humanized NSG and NSG‐HLA‐A2/HHD mice. Front Immunol 2018; 9:1943. [DOI] [PMC free article] [PubMed] [Google Scholar]
- 29. Alderson MR. Fas ligand mediates activation‐induced cell death in human T lymphocytes. J Exp Med 1995; 181:71–7. [DOI] [PMC free article] [PubMed] [Google Scholar]
- 30. Pellegrini M, Belz G, Bouillet P, Strasser A. Shutdown of an acute T cell immune response to viral infection is mediated by the proapoptotic Bcl‐2 homology 3‐only protein Bim. Proc Natl Acad Sci USA 2003; 100:14175–80. [DOI] [PMC free article] [PubMed] [Google Scholar]
- 31. Klatt NR, Brenchley JM. Th17 cell dynamics in HIV infection. Curr Opin HIV AIDS 2010; 5:135–40. [DOI] [PMC free article] [PubMed] [Google Scholar]
- 32. Kim BS, Park YJ, Chung Y. Targeting IL‐17 in autoimmunity and inflammation. Arch Pharm Res 2016; 39:1537–47. [DOI] [PubMed] [Google Scholar]
- 33. Kappel LW, Goldberg GL, King CG et al IL‐17 contributes to CD4‐mediated graft‐versus‐host disease. Blood 2009; 113:945–52. [DOI] [PMC free article] [PubMed] [Google Scholar]
- 34. Carlson MJ, West ML, Coghill JM, Panoskaltsis‐Mortari A, Blazar BR, Serody JS. In vitro differentiated TH17 cells mediate lethal acute graft‐versus‐host disease with severe cutaneous and pulmonary pathologic manifestations. Blood 2009; 113:1365–74. [DOI] [PMC free article] [PubMed] [Google Scholar]
- 35. Yu Y, Wang D, Liu C et al Prevention of GVHD while sparing GVL effect by targeting Th1 and Th17 transcription factor T‐bet and RORγt in mice. Blood 2011; 118:5011–20. [DOI] [PMC free article] [PubMed] [Google Scholar]
- 36. Liu H, Rohowsky‐Kochan C. Regulation of IL‐17 in human CCR6+ effector memory T cells. J Immunol 2008; 180:7948–57. [DOI] [PubMed] [Google Scholar]
- 37. He D, Wu L, Kim HK, Li H, Elmets CA, Xu H. CD8+ IL‐17‐producing T cells are important in effector functions for the elicitation of contact hypersensitivity responses. J Immunol 2006; 177:6852–8. [DOI] [PMC free article] [PubMed] [Google Scholar]
- 38. Kumar P, Ban HS, Kim SS et al T cell‐specific siRNA delivery suppresses HIV‐1 infection in humanized mice. Cell 2008; 134:577–86. [DOI] [PMC free article] [PubMed] [Google Scholar]
- 39. Spengler JR, Lavender KJ, Martellaro C et al Ebola virus replication and disease without immunopathology in mice expressing transgenes to support human myeloid and lymphoid cell engraftment. J Infect Dis 2016; 214(Suppl 3):S308–18. [DOI] [PMC free article] [PubMed] [Google Scholar]
- 40. Spengler JR, McElroy AK, Harmon JR et al Human immune cell engraftment does not alter development of severe acute Rift Valley fever in mice. PLOS ONE 2018; 13:1–10. [DOI] [PMC free article] [PubMed] [Google Scholar]
- 41. Spengler JR, Saturday G, Lavender KJ et al Severity of disease in humanized mice infected with Ebola virus or Reston virus is associated with magnitude of early viral replication in liver. J Infect Dis 2018; 217:58–63. [DOI] [PMC free article] [PubMed] [Google Scholar]
- 42. Bryce PJ, Falahati R, Kenney LL et al Humanized mouse model of mast cell‐mediated passive cutaneous anaphylaxis and passive systemic anaphylaxis. J Allergy Clin Immunol 2016; 138:769–79. [DOI] [PMC free article] [PubMed] [Google Scholar]
- 43. Koyanagi Y, Tanaka Y, Tanaka R et al High levels of viremia in hu‐PBL‐NOD‐scid mice with HIV‐1 infection. Leukemia 1997; 11(Suppl 3):109–12. [PubMed] [Google Scholar]
- 44. Kieffer C, Ladinsky MS, Ninh A, Galimidi RP, Bjorkman PJ. Longitudinal imaging of HIV‐1 spread in humanized mice with parallel 3D immunofluorescence and electron tomography. eLife 2017; 6:1–24. [DOI] [PMC free article] [PubMed] [Google Scholar]
- 45. Mosier DE, Gulizia RJ, MacIsaac PD, Torbett BE, Levy JA. Rapid loss of CD4+ T cells in human‐PBL‐SCID mice by noncytopathic HIV isolates. Science 1993; 260:689–92. [DOI] [PubMed] [Google Scholar]
- 46. Koyanagi Y, Tanaka Y, Kira J et al Primary human immunodeficiency virus type 1 viremia and central nervous system invasion in a novel hu‐PBL‐immunodeficient mouse strain. J Virol 1997; 71:2417–24. [DOI] [PMC free article] [PubMed] [Google Scholar]
- 47. Hunt PW, Martin JN, Sinclair E et al T cell activation is associated with lower CD4+ T cell gains in human immunodeficiency virus‐infected patients with sustained viral suppression during antiretroviral therapy. J Infect Dis 2003; 187:1534–43. [DOI] [PubMed] [Google Scholar]
- 48. Tanko RF, Soares AP, Masson L et al Residual T cell activation and skewed CD8+ T cell memory differentiation despite antiretroviral therapy‐induced HIV suppression. Clin Immunol 2018; 195:127–38. [DOI] [PMC free article] [PubMed] [Google Scholar]
- 49. Serrano‐Villar S, Sainz T, Lee SA et al HIV‐infected individuals with low CD4/CD8 ratio despite effective antiretroviral therapy exhibit altered T cell subsets, heightened CD8+ T cell activation, and increased risk of non‐AIDS morbidity and mortality. PLOS Pathog 2014; 10:1–10. [DOI] [PMC free article] [PubMed] [Google Scholar]
- 50. Schweneker M, Favre D, Martin JN, Deeks SG, Joseph M, McCune JM. HIV‐induced changes in T cell signaling pathways. J Immunol 2008; 180:6490–500. [DOI] [PMC free article] [PubMed] [Google Scholar]
- 51. Appay V, Almeida JR, Sauce D, Autran B, Papagno L. Accelerated immune senescence and HIV‐1 infection. Exp Gerontol 2007; 42:432–7. [DOI] [PubMed] [Google Scholar]
- 52. Veldhoen M. Interleukin 17 is a chief orchestrator of immunity. Nat Immunol 2017; 18:612–21. [DOI] [PubMed] [Google Scholar]
- 53. Srenathan U, Steel K, Taams LS. IL‐17+ CD8+ T cells: differentiation, phenotype and role in inflammatory disease. Immunol Lett 2016; 178:20–6. [DOI] [PMC free article] [PubMed] [Google Scholar]
- 54. Lee JS, Tato CM, Joyce‐Shaikh B et al Interleukin‐23‐independent IL‐17 production regulates intestinal epithelial permeability. Immunity 2015; 43:727–38. [DOI] [PMC free article] [PubMed] [Google Scholar]
- 55. Liang SC, Tan X‐Y, Luxenberg DP et al Interleukin (IL)‐22 and IL‐17 are coexpressed by Th17 cells and cooperatively enhance expression of antimicrobial peptides. J Exp Med 2006; 203:2271–9. [DOI] [PMC free article] [PubMed] [Google Scholar]
- 56. Miyamoto M, Prause O, Sjostrand M, Laan M, Lotvall J, Linden A. Endogenous IL‐17 as a mediator of neutrophil recruitment caused by endotoxin exposure in mouse airways. J Immunol 2003; 170:4665–72. [DOI] [PubMed] [Google Scholar]
- 57. Mudd JC, Brenchley JM. Gut mucosal barrier dysfunction, microbial dysbiosis, and their role in HIV‐1 disease progression. J Infect Dis 2016; 214(Suppl 2):S58–66. [DOI] [PMC free article] [PubMed] [Google Scholar]
- 58. Hunt PW, Sinclair E, Rodriguez B et al Gut epithelial barrier dysfunction and innate immune activation predict mortality in treated HIV infection. J Infect Dis 2014; 210:1228–38. [DOI] [PMC free article] [PubMed] [Google Scholar]
- 59. Brenchley JM, Paiardini M, Knox KS et al Differential Th17 CD4 T‐cell depletion in pathogenic and nonpathogenic lentiviral infections. Blood 2008; 112:2826–35. [DOI] [PMC free article] [PubMed] [Google Scholar]
- 60. Page EE, Greathead L, Metcalf R et al Loss of Th22 cells is associated with increased immune activation and IDO‐1 activity in HIV‐1 infection. J Acquir Immune Defic Syndr 2014; 67:227–35. [DOI] [PubMed] [Google Scholar]
- 61. Cosgrove C, Ussher JE, Rauch A et al Early and nonreversible decrease of CD161++ /MAIT cells in HIV infection. Blood 2013; 121:951–61. [DOI] [PMC free article] [PubMed] [Google Scholar]
- 62. Sandler NG, Douek DC. Microbial translocation in HIV infection: causes, consequences and treatment opportunities. Nat Rev Microbiol 2012; 10:655–66. [DOI] [PubMed] [Google Scholar]
- 63. Kim HO, Kim HS, Youn JC, Shin EC, Park S. Serum cytokine profiles in healthy young and elderly population assessed using multiplexed bead‐based immunoassays. J Transl Med 2011; 9:1–7. [DOI] [PMC free article] [PubMed] [Google Scholar]
- 64. Kyriakou A, Patsatsi A, Vyzantiadis T‐A, Sotiriadis D. Serum levels of TNF‐alpha, IL‐12/23p40, and IL‐17 in plaque psoriasis and their correlation with disease severity. J Immunol Res 2014; 2014:1–10. [DOI] [PMC free article] [PubMed] [Google Scholar]
- 65. Michalak‐Stoma A, Bartosińska J, Kowal M, Juszkiewicz‐Borowiec M, Gerkowicz A, Chodorowska G. Serum levels of selected Th17 and Th22 cytokines in psoriatic patients. Dis Markers 2013; 35:625–31. [DOI] [PMC free article] [PubMed] [Google Scholar]
Associated Data
This section collects any data citations, data availability statements, or supplementary materials included in this article.
Supplementary Materials
Figure S1. Frequency of CD3+ cells among total blood mononuclear cells (A), viral load (B), and CD4:CD8 ratio (C) in hu‐PBL‐NSG‐SGM3 HIV+ untreated (n = 3) and HIV+ ART (n = 4) mice throughout monitoring time. Mice were humanized with cells from a second HIV+ donor. D. Expression of HLA‐DR, CD38, CCR7, CD45RA and PD‐1 in CD4+ and CD8+ T‐cells before injection into mice. E and F. Frequencies of HLA‐DR+ CD38+ (E) and PD‐1+ (F) CD4+ and CD8+ T‐cells in hu‐PBL‐NSG‐SGM3 HIV+ untreated and HIV+ ART mice throughout monitoring time. G. Frequencies of CCR7+ CD45RA+ (naïve), CCR7+ CD45RA‐ (central memory), CCR7‐ CD45RA‐ (effector memory) and CCR7‐ CD45RA+ (TEMRA) CD4+ and CD8+ T‐cells in hu‐PBL‐NSG‐SGM3 HIV+ untreated and HIV+ ART mice throughout monitoring time. The gray box indicates ART administration. In B, the dashed line indicates the limit of detection of the assay. In C, the dashed line indicates a CD4:CD8 ratio = 1.
Figure S2. Frequency of HLA‐DR+ CD38+ CD4+ T‐cells (A), PD‐1+ CD4+ T‐cells (B), CCR7+ CD45RA+ (naïve; C), CCR7+ CD45RA‐ (central memory; D), CCR7‐ CD45RA‐ (effector memory; E) and CCR7‐ CD45RA+ (TEMRA; F) CD4+ T‐cells in spleen (circles) and lymph nodes (squares) from hu‐PBL‐NSG‐SGM3 HIV‐ (n = 10), HIV+ untreated (n = 3) and HIV+ ART (n = 9) mice. P value of the Kruskal‐Wallis and Dunn’s post‐hoc test. NS: Not statistically significant.