

Summary
First discovered on the natural killer (NK) cell, the cell surface inhibitory receptor sialic acid‐binding immunoglobulin‐like lectin‐7 (Siglec‐7) is known for regulating many important biological activities. However, the detail regulatory mechanism for Siglec‐7 expression in NK cells currently remains unclear. In this study, we aimed to investigate how cell surface Siglec‐7 expression is regulated and found that, in both NK cell lines and peripheral NK cells, transcription was the main regulatory step. Furthermore, when NK‐92MI and peripheral NK cells were treated with DNA methyltransferase (DNMT) inhibitor, the CpG island, with 9 CpG sites, in 5′ Siglec‐7 promoter became noticeably hypomethylated, and Siglec‐7 expression increased in both RNA transcript and surface protein. Within this CpG island, we identified both CpG 8 and CpG 9 as two key regulators responsible for Siglec‐7 expression. Additionally, by using histone deacetylases (HDAC) inhibitor, butyric acid, we showed that Siglec‐7 expression was also subjected to the histone modification. And a combined treatment with both 5‐azacytidine and butyric acid showed an additive effect on Siglec‐7 transcript expression in peripheral NK cells.
Keywords: DNA methylation, epigenetics, histone acetylation, natural killer cell, Siglec‐7
In the human peripheral natural killer cells, Siglec‐7 expression can be regulated via DNA methylation. Two CpG sites (8 and 9) within the 5′ promoter region serve as key regulatory sites. When CpG 8 and CpG 9 become hypomethylated, Siglec‐7 expression is upregulated.
Abbreviations
- 5azaC
5‐azacytidine
- NaB
butyric acid
- DNMT
DNA methyltransferase
- HAT
histone acetyltransferase
- HDAC
histone deacetylase
- ITIM
immunoreceptor tyrosine‐based inhibitory motif
- NK cell
natural killer cell
- FoxO1
phosphorylated Forkhead box O1
- Siglec‐7
sialic acid‐binding immunoglobulin‐like lectin‐7
- SAHA
suberoylanilide hydroxamic acid
- VAP
valproic acid
Introduction
Of those diverse functions possessed by surface proteins on the immune cells, mediating extracellular stimuli or signals into the cells is particularly important for them to properly respond against the challenge of immunogens. Originally detected on the natural killer (NK) cell and monocyte as a cell surface receptor, sialic acid‐binding immunoglobulin‐like lectin‐7 (Siglec‐7) is also termed p75/AIRM‐1 or CDw328, belonging to the CD33‐related family of the Siglec proteins. 1 , 2 Functioning as an inhibitory NK surface receptor, Siglec‐7 can also be observed on other peripheral blood cells, like basophil, eosinophil, mast cell and platelet. 5 , 6 Siglec‐7 consists of a three extracellular immunoglobulin‐like domain, a transmembrane region, and a cytoplasmic tail with two tyrosine residues embodied in immunoreceptor tyrosine‐based inhibitory motif (ITIM)‐like motif. 2 Normally, through the binding to particular structures of sialic acids, such as α(2,8)‐linked disialic acids and branched α(2,6)‐sialyl residues, Siglec‐7 can suppress NK effector function by delivering the inhibitory signalling. 8 , 9 Moreover, during tumorigenesis, aberrant sialylated structures are found on the tumour cell surface that are able to engage Siglec‐7 to induce the suppressing signal into NK cells, which results in escape of tumour cells from NK‐mediated immunosurveillance. 10 , 11
A previous study showed that the population ratio in certain NK subsets could be altered by the viral infection. For example, Siglec‐7− NK cells become enriched in HCV‐infected patients, and this enrichment is associated with liver inflammation and fibrosis. 13 For Siglec‐7, in addition to the influence in the human immune system, its expression has been linked to metabolic disorders with the findings indicating that the expression level of Siglec‐7 on NK cells is correlated with obesity and that, in diabetes patients, the function of β‐cells in the pancreatic islets can be regulated by the amount of surface Siglec‐7. 14 , 15
For NK cells, its diversified effector functions and regulatory receptors can be acquired along the course of development and maturation. And this process is tightly regulated by various extrinsic and intrinsic factors, like cytokines and transcription factors, respectively. The transcription factors, such as Ikaros and ETS‐1, regulate the early developmental stages of NK cells. Ikaros is necessary for the generation of NK cells from common lymphoid progenitors, and ETS‐1 is responsible for regulating the expression of activating and inhibitory receptors. 16 , 17 Blimp‐1, Eomes and T‐bet can modulate NK maturation and functions. 18 , 19 For example, T‐bet is required for Blimp‐1 expression, and granzyme B production is regulated by both Blimp‐1 and T‐bet. 21 , 22 Besides those well‐known NK development/maturation‐related transcription factors, phosphorylated Forkhead box O1 (FoxO1) has been identified as a negative regulator for T‐bet expression, suggesting that FoxO1 serves as an upstream master regulator for NK maturation and function diversity. 27
In addition to the transcriptional regulation, epigenetic modifications have been demonstrated to play key roles in regulating NK effector functions. 28 Epigenetics is referred as the functionally relevant modifications onto the genome, which does not involve altering the DNA nucleotide sequence, leading to changes in the gene expression and subsequently the downstream cell phenotype. These epigenetic regulators include DNA methylations, histone modifications and non‐coding RNA regulations. 29 Patterns of DNA methylation are governed and established through the function of a family of DNA methyltransferases (DNMTs) that catalyse the covalent addition of the methyl group to cytosine. In humans, only DNMT3A and DNMT3B catalyse de novo methylation and, therefore, are considered as regulators involved in the stimulation response, differentiation and maturation. 30 , 31 In contrast to the DNA methylation, histone modification is comprised of a more complicated regulatory network to open or close the chromatin structure to achieve gene regulation for activation or inactivation. For example, active transcription is associated with the lysine acetylation of histone 3 and 4. 32 The histone acetylation status is established by the dynamic balance between actions of histone deacetylase (HDAC) and histone acetyltransferase (HAT) to dictate gene activation or not. 33
Peripheral NK cells can be grouped into various subsets defined by either the maturation paths or cell functions, and these subsets can be examined by the presence of representative surface markers, like activating, or inhibitory receptors. Therefore, changes in expression on these surface markers can lead to alterations in the NK function. Siglec‐7 is widely studied as an inhibitory receptor for NK effector, and it does not present on all peripheral NK cells. Interestingly, as mentioned earlier, population distribution of Siglec‐7 can be altered in patients with HCV and HIV infection, 13 , 34 and those with metabolic disorders, 14 , 15 indicating that Siglec‐7 expressions are purposely regulated in these diseases.
Currently, the regulatory mechanism for Siglec‐7 is still unclear in detail. By our previous study, we found that cell surface Siglec‐7 amount was positively correlated to the transcript level, suggesting the main Siglec‐7 regulatory step is via transcription. 35 In this study, we aimed to characterize the regulatory mechanism for Siglec‐7 activation in NK cells by investigating the involvement of transcription factor(s), DNA methylation and histone modification. Our results showed that the expression of candidate nuclear transcription factor FoxO1 did not correlate to the Siglec‐7 expression on peripheral NK cells. However, by utilizing the DNA demethylating reagent 5‐azacytidine (5azaC) and the HDAC inhibitor butyric acid (NaB), we identified two responsible CpG sites located on the 5′ region of the Siglec‐7 promoter for such regulation. On the other hand, we also showed that Siglec‐7 expression was subjected to the regulation of histone modification through the treatment of a HDAC inhibitor. Interestingly, our results showed that peripheral blood NK cells were more sensitive to HDAC inhibitor for Siglec‐7 expression as compared with the sensitivities from three tested NK‐92MI cell lines.
Materials and methods
Cell lines and primary cells
Human NK cell line, NK‐92MI, was purchased from Bioresource Collection and Research Center (Hsinchu, Taiwan), and the NK‐92MI‐S and ‐S7N cells were established in our laboratory as described previously. 35 NK cells were grown in α‐MEM medium, supplemented with 12·5% fetal bovine serum (FBS), 12·5% horse serum, 2 mm l‐glutamine, 2 mm inositol, 0·1 mm 2‐mercaptoethanol, 0·02 mm folic acid, 50 units/ml penicillin and 50 μg/ml streptomycin in a humidified incubator with 5% CO2 at 37°. 293T cell was purchased from ATCC and cultured in DMEM medium with 10% FBS, 50 units/ml penicillin and 50 μg/ml streptomycin. All reagents were purchased from Invitrogen (Carlsbad, CA).
Peripheral blood mononuclear cells from healthy donor blood were purified using Ficoll‐Paque PLUS (GE Healthcare, Little Chalfont, UK), and NK cells were isolated by using EasySep Human NK Cell Enrichment kit (StemCell Technologies, Vancouver, BC, Canada). Obtained peripheral NK cells were subjected to either the treatment of 5azaC (10 μm) or NaB (0·4 mm; Sigma‐Aldrich, St Louis, MO), or the combined treatment of both chemicals, by being plated at 106 cells/ml in the same medium used for NK‐92MI, but with addition of IL‐2 (20 ng/ml) and IL‐15 (10 ng/ml; PeproTech, Rocky Hill, NJ). Accessibility to the donor samples was approved by the Institutional Review Board of National Yang‐Ming University (YM107136E).
Flow cytometric analysis
The expression of receptors and intracellular transcription factor in NK cells was examined by flow cytometry with the commercially available fluorescence‐conjugated antibodies. Antibodies against CD56 and Siglec‐7 (Thermo Fisher Scientific, Waltham, MA) were used for cell surface receptor detection. For FoxO1 detection, intracellular staining was employed by using Intracellular Fixation & Permeabilization Buffer Set (Thermo Fisher Scientific) prior to FoxO1 staining (Cell Signaling, Danvers, MA). In some experiments, cells were sorted in FACSAria (Beckman Coulter, Brea, CA) using CytExpert software (Beckman Coulter). Data analysis was performed with FlowJo software (FlowJo LLC, Ashland, OR).
Real‐time polymerase chain reaction
Total RNA was first isolated from cultured cells and primary cells using TRIzol Reagent (Thermo Fisher Scientific) according to the manufacturer's protocol. A Revert Aid First Strand cDNA Synthesis Kit (Thermo Fisher Scientific) was used to synthesize cDNA from cellular RNA. Target transcripts in the cDNA samples were quantified using TaqMan gene expression assay kits (Applied Biosystems, Foster City, CA) with Siglec‐7 (Hs01100854_m1), DNMT1 (Hs00945875_m1), DNMT3A (Hs01027166_m1), DNMT3B (Hs01003405_m1) and GAPDH (Hs99999905_m1) as primers and probes. For the FoxO1, the KAPA SYBR FAST qPCR Master Mix (KAPA Biosystems, Boston, MA) and primers (5′‐AAGAGCGTGCCCTACTTCAA and 5′‐AGATTTCCCGCTCTTGCCAC) were used. For each target, polymerase chain reaction (PCR) was performed and detected with the StepOnePlus Real‐Time PCR system (Applied Biosystems).
RNA‐sequencing
RNA extraction was performed using TRIzol Reagent and the RNA‐seq libraries were prepared by using MGIEasy RNA library Prep Set, and the sequencing was performed on the BGISEQ‐500 platform (BGI Group, Shenzhen, China) with 100‐bp single‐end reads achieving an average of 2 × 10⁷ reads/sample. Reads were aligned to the GRCh38/hg38 build of the human genome and analysed.
Processing RNA‐Seq data
FastQC software was used to generate the quality‐control reports of individual FASTQ files before and after filtering. High‐quality clean reads were mapped to the reference, and transcript levels of the unigenes were identified by TopHat (http://ccb.jhu.edu/software/tophat/index.shtml) and Cufflinks (http://cole-tranell-lab.github.io/cufflinks/), and normalized by the fragment per kilobase of exon model per million mapped reads (FPKM). Differentially expressed genes between these two different cell types were obtained by applying a false discovery rate cut‐off of 0·05 and an absolute fold‐change of 1·5. To identify significant pathway(s) in which differentially expressed genes were enriched, pathway enrichment analysis was conducted with Ingenuity Pathway Analysis software (IPA; Ingenuity Systems, Redwood City, CA) and KEGG (http://www.kegg.jp/).
Western blot
Nuclear proteins and cytosol proteins were prepared using NE‐PER nuclear and cytoplasmic extraction reagent (Thermo Fisher Scientific) according to the manufacturer's instructions. Total protein extraction and Western blotting were performed as previously described. 36 The antibodies used in this study were anti‐FoxO1, anti‐DNMT3A from Cell Signaling, anti‐DNMT1, anti‐GAPDH from Thermo Fisher Scientific and anti‐LaminA from Sigma‐Aldrich, and anti‐DNMT3B from Novus Biologicals (Centennial, CO). Bound primary antibodies were detected with horseradish peroxide‐conjugated anti‐rabbit or anti‐mouse IgG antibodies (Sigma‐Aldrich), and visualized using Western lighting chemiluminescence reagent plus (PerkinElmer, Waltham, MA).
Bisulphite sequencing PCR methylation analysis
Genomic DNA from NK cell lines, sorted peripheral Siglec‐7+, and Siglec‐7− NK cells, under the condition either with or without 5azaC treatment, was extracted using Novel Genomic DNA mini Kit (NovelGene) according to the manufacturer's instruction. 500 ng of each genomic DNA was bisulphite‐converted using EZ DNA Methylation‐Gold kit (Zymo Research, Tustin, CA) according to the manufacturer's instruction, with an elution volume of 12 μl. The primers hS7meF3 (5′‐GTTTAGAGAGTTGTGAGGATGGGAATAGTG) and hS7meR6 (5′‐CCCCCTTTCTACACAATAAAATCAACACAAC) formed a PCR product with length of 401 bp (−874 to −473), which contains 9 CpG sites by using Platinum Hot Start PCR 2× Master Mix (Invitrogen). PCR products were cloned into pGEM‐T Easy vector (Promega, Madison, WI) following the manufacturer's guideline. Colony PCR assay was performed for the identification of positive clones. A total of 10 positive clones for each sample were selected for sequencing. The bisulphite sequence data for overall methylation level were analysed by following the formula: methylation status (%) = (methylated colonies of 9 CpG sites/10 colonies × 9 CpG sites) × 100%.
For the bisulphite amplicon sequencing, the PCR product was purified with Gel/PCR DNA isolation System (VIOGENE). The purified amplicons were used for library preparation using Celero DNA‐Seq System, and then amplicon sequencing was performed on Illumina MiSeq System with 401‐bp paired‐end reads achieving an average of 1 × 10⁶ reads/sample. Reads were mapped to the fragment of 5′ Siglec‐7, as described above, and analysed. The data for overall methylation level were analysed by the following formula: methylation status (%) = (methylated reads of 9 CpG sites/all reads in 9 CpG sites) × 100%.
Plasmid construction
The Siglec‐7 promoter constructs spanning −937‐+57 of the human Siglec‐7 were generated by PCR amplification, utilizing genomic DNA from NK‐92MI as a template, and PCR primers hS7‐779XhoF1 (5′‐TAGTCTCGAGAATCACAGCCTCAGCTTCCCCG) and hS7‐37HindR2 (5′‐ACTAAAGCTTTCTGTCCTTCCACCCTCTCCCT). Underlined letters indicated XhoI and HindIII recognition sequences, and the resultant PCR products were cloned into pMCS‐Green Renilla Luc vector using T4 DNA Ligation Kit (Promega). The point mutation of CpG sites was generated by site‐direct mutagenesis by Protech Technology Enterprise (Taipei, Taiwan).
In vitro methylation, transfection and luciferase assay
The methylated plasmids were generated by incubating 1 μg of plasmid DNA with 4 units/μl of M.SssI (New England BioLabs, Ipswich, MA) in reaction buffer supplemented with 1600 μm S‐adenosylmethionine according to manufacturer's instruction. The purified methylated and unmethylated plasmid were then transfected into 293T cells. These cells were seeded for 24 hr prior to transfection in 96‐well plate at 104 cells/well, using TurboFect reagents (Thermo Fisher Scientific). Briefly, transfection was carried out in triplicate in serum‐free antibiotic‐free conditions, with a total of 100 ng of pMCS‐Green Renilla Luc, with or without 5′ region of Siglec‐7, and equal amount of pCMV‐Red Firefly Luc plasmid as an internal control reporter. Luciferase assay was performed using the Pierce Renilla‐Firefly Luciferase Dual Assay kit (Thermo Fisher Scientific) and was detected using TECAN 200/200Pro microplate reader (Tecan, Switzerland).
Statistical analysis
Data were analysed with Prism 6.0 software (GraphPad Software, San Diego, CA), using the Student's t‐test to report significant differences between groups, or using paired t‐test to compare two subsets from the same donors. The appropriate test was chosen based on data distribution, variance and experimental set up. *P < 0·05, **P < 0·01, ***P < 0·005, and ns, not significant.
Results
Positive correlation between Siglec‐7 cell surface expression and the Siglec‐7 transcript level in human peripheral NK cells
In our previous study, we reported a relationship between the cell surface presence of Siglec‐7 and NK cytotoxicity. Briefly, we found that NK‐92MI cells lost significant cytotoxicity capability after long‐term in vitro culture, and the resulting cell population exhibited a dominant Siglec‐7+ expressing phenotype (designated as NK‐92MI‐S). More interestingly, from this NK‐92MI‐S cell population, we were able to isolate a Siglec‐7− sub‐population (NK‐92MI‐S7N), which possessed high cytotoxicity to kill a leukemia cell line that even parental NK‐92MI cells cannot. 35 Moreover, our result suggested that the expression level of cell surface Siglec‐7 is regulated at the transcription step as the cell surface expression was positively correlated with the transcript level in these three cell lines, in which NK‐92MI‐S possessed the highest Siglec‐7 expression, followed by parental NK‐92MI, and then NK‐92MI‐S7N. 35
To investigate whether Siglec‐7 expression in the peripheral NK cells shares the same correlation observed in three NK‐92MI cells, we analysed 15 cases from healthy donors. For each donor, we isolated NK cells, and examined the Siglec‐7+ expression (Fig. 1a, left panel). We found that most donors had dominant Siglec‐7 expressing NK population (Fig. 1a, right panel). Next, to test whether such Siglec‐7 expression was transcription‐correlated, we compared the expression of Siglec‐7 transcripts between sorted Siglec‐7+ and Siglec‐7− peripheral NK cells. The result showed that increased Siglec‐7 transcript levels were observed in these Siglec‐7+ NK cells (Fig. 1b), suggesting that cell surface Siglec‐7 expression was regulated at the transcription step either by activation of transcriptional activator(s) or epigenetics.
Figure 1.
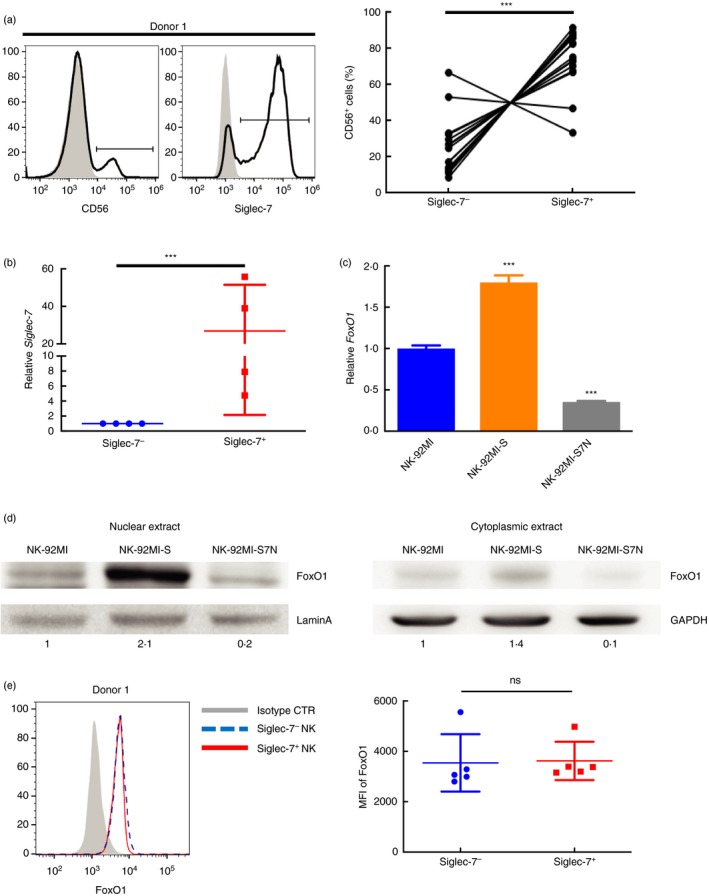
Correlation in the cellular expression between FoxO1 and Siglec‐7 in three NK‐92MI cell lines, and peripheral Siglec‐7+ and Siglec‐7− NK cells. (a) Representative staining of peripheral blood from a healthy donor for the gating strategy to identify CD56+ natural killer (NK) cells and levels of Siglec‐7 expression (left), and the distribution of NK population for the Siglec‐7 subset is shown as a percentage of positive cells (right). ***P < 0·005, paired Student's t‐test. (b) Real‐time polymerase chain reaction (PCR) analysis of Siglec‐7 transcripts in sorted Siglec‐7−CD56+ and Siglec‐7+CD56+ cells from four healthy donors. Siglec‐7 expression in Siglec‐7+ subset was related to that in Siglec‐7− cells, and all expressions were normalized to GAPDH. ***P < 0·005, paired Student's t‐test. (c) Relative expression of FoxO1 among three NK cell lines, and the results were compared with those of parental cells (arbitrarily set as 1·0). The results were representative of three experiments. Data are presented as mean ± SD of triplicates. ***P < 0·005, Student's t‐test. (d) Western blot comparing nuclear and cytoplasmic FoxO1 levels among three NK cells, and the results were normalized with LaminA and GAPDH, respectively, as indicated at the bottom. These representative data were from one of three independent experiments. (e) Comparison of nuclear FoxO1 expression between sorted Siglec‐7−CD56+ and Siglec‐7+CD56+ cells from five healthy donors by performing flow cytometric analysis. The shaded area represented the results from cells incubated with isotype control, and the blue and red lines represented the results from indicated cells (left). The representative of mean fluorescence intensity (MFI) of NK subsets (right). ns, not significant, paired Student's t‐test.
Transcriptome profiling of three NK‐92MI cell lines
Based on the similarity between the NK‐92MI cell lines and human peripheral NK cells in terms of the Siglec‐7 protein and transcript relationship, we first aimed to identify the transcriptional regulator(s) responsible for Siglec‐7 expression in NK cells by using RNA‐seq to obtain the differentially expressed gene profiles from NK‐92MI, ‐S and ‐S7N cells. For a RNA‐seq quality control, we first compared individual Siglec‐7 mRNA expression profiles from three tested NK cells for the RNA‐seq with that acquired from real‐time‐quantitative (RT‐q)PCR in our previous study. And we found out the expressions of Siglec‐7 were comparable between RNA‐seq and RT‐qPCR results.
Our RNA‐seq result showed that 3079 genes were expressed differentially between NK‐92MI‐S and parental NK‐92MI cells, in which 2135 were upregulated and 944 were downregulated in NK‐92MI‐S (Fig. S1a). For the NK‐92MI‐S7N, while comparing with parental cells, 618 differentially expressed genes were identified, with 165 upregulated and 453 downregulated (Fig. S1b). Of these differentially expressed genes, a group of 19 overlay ones were transcription factors, 8 of which were known to be expressed in the haematopoietic‐related cell/tissue. And therefore, these genes were designated as candidates for the Siglec‐7 activation (Fig. S1b).
To narrow down the candidate number, we examined the 5′ promoter region of Siglec‐7 for the putative binding site of these candidates and excluded all of them but FoxO1 (Fig. S1b), which was upregulated in NK‐92MI‐S (Fig. S1c). The relative transcript levels of FoxO1 among three examined NK cells were re‐confirmed by RT‐qPCR (Fig. 1c). We found that the nuclear presence of FoxO1 was significantly higher in NK‐92MI‐S as compared with those in parental and Siglec‐7− NK‐92MI‐S7N (Fig. 1d).
Based on the correlation between high level of nuclear FoxO1 and the elevated expressions of Siglec‐7 transcript and protein, it is possible that FoxO1 was responsible regulator for the Siglec‐7 activation in NK cells. To re‐examine this in peripheral NK cells, we compared the nuclear FoxO1 levels between peripheral Siglec‐7+ and Siglec‐7− NK cells. The result showed that, unlike NK‐92MI model, the FoxO1 expression displayed no significant difference between sorted Siglec‐7+ and Siglec‐7− NK cells from five healthy donors (Fig. 1e), indicating in the peripheral NK cells that a change in FoxO1 expression was not responsible for the Siglec‐7 expression. Additionally, we also investigated whether overexpression of FoxO1 affects Siglec‐7 gene expression by the luciferase reporter assay. 293T cells were co‐transfected with luciferase reporter construct bearing Siglec‐7 −2700~+57‐bp promoter region and the FoxO1 overexpression plasmid. We found that there was no difference in the reporter activity between the overexpression and mock control (data not shown).
Effects of the DNA methylation on both Siglec‐7 activation and 5′ promoter methylation status in NK‐92MI cells
It has been demonstrated that epigenetic modifications are an important contributing factor for the NK developmental progress and effector functions by regulating the expression of activating and inhibitory receptors. 28 Through CpG island DataBase and Analytical Tool (DBCAT), we identified that one CpG island, consisting of 9 CpG sites, was located within the 5′ region of Siglec‐7 (data not shown). Additionally, RNA‐seq results showed the NK‐92MI‐S cells possessed the lowest levels of the DNMT1, DNMT3A and DNMT3B transcripts among three cell lines (data not shown), which was re‐confirmed by Western blotting and RT‐q‐PCR (Figs 2a and S2). Taken together, these results suggested that DNA methylation might be involved in regulating Siglec‐7 activation. To examine this notion, we treated NK cells with nucleotide analogues DNMT inhibitors, 5azaC, prior to the detection of surface Siglec‐7. We observed that Siglec‐7 levels significantly increased after 96‐hr treatment in NK‐92MI and ‐S7N, and these increases lasted even after 192‐hr treatment as opposed to the slight increase observed in NK‐92MI‐S cells (Fig. 2b,c). Next, we performed RT‐qPCR to examine how 5azaC affected the Siglec‐7 transcription in these NK cells. We found that for both NK‐92MI and ‐S7N cells, Siglec‐7 expressions were greatly induced starting from 24 hr and kept increasing at 72 hr (Fig. 2d).
Figure 2.
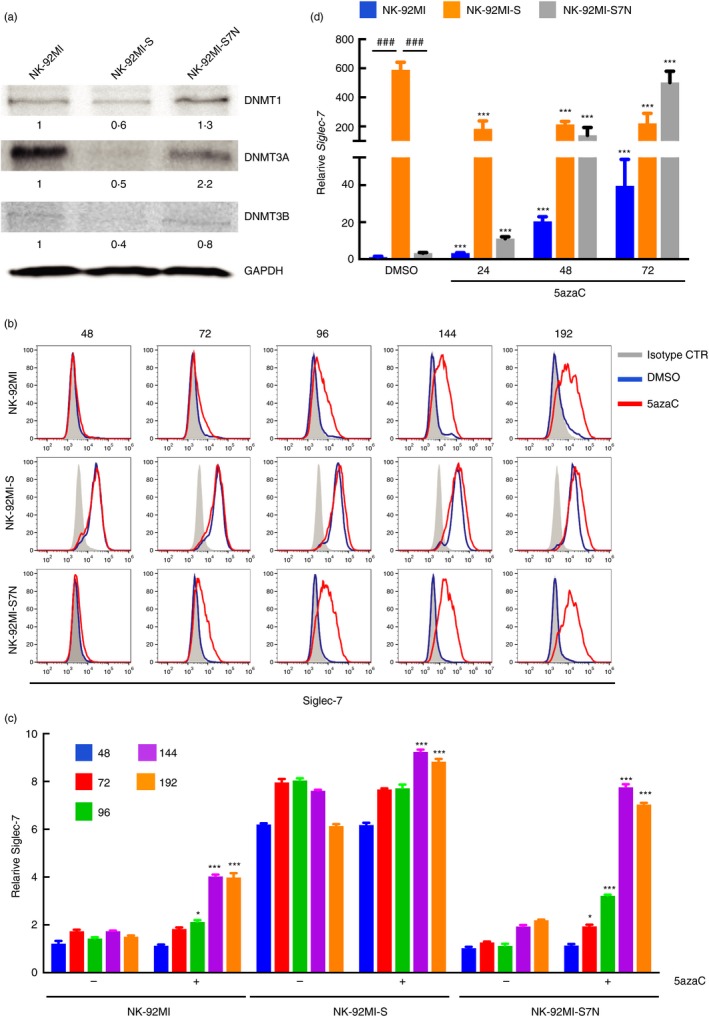
Inhibition of the DNA methyltransferase (DNMT) activity promoted Siglec‐7 expression in natural killer (NK) cells. (a) Three NK cells were examined by immunoblotting for the protein expression of DNMT1, DNMT3A and DNMT3B, with GAPDH as a loading control. Relative amount was used to compare the protein level from each group, and was shown at the bottom by setting the reference protein at 1. Representative data were from one of three independent experiments. (b) Representative flow cytometric staining pattern along a time course (as indicated) for the NK cell surface Siglec‐7 comparison in expression after the inhibition of methylation with 5‐azacytidine (5azaC) treatments in three NK‐92MI cell lines. The shaded area represented the results obtained from cells incubated with isotype control, and the blue and red lines indicated control and treated groups, respectively. (c) Column chart of relative MFI of Siglec‐7 expression. For each cell line, data were first normalized to the isotype control, and presented in the time course manner for with or without 5azaC treatment. *P < 0·05; ***P < 0·005, Student's t‐test. The result shown was representative of three independent experiments. (d) Column chart presenting real‐time polymerase chain reaction (PCR) analysis of Siglec‐7 transcripts in NK cells, as indicated, with or without 5azaC treatments from the indicated time point. All the expression was first normalized to GAPDH and, for each cell, the expression level of Siglec‐7 transcript from different time points was compared with that of untreated DMSO control. ***P < 0·005 comparison within the same cell type; ### P < 0·005 comparison between parental, NK‐92MI‐S and ‐S7N, Student's t‐test.
We then profiled the DNA methylation status at the −874~−473 region, which contained 9 CpG sites, within the Siglec‐7 5′ promoter among three NK cell lines by using bisulphite sequencing to quantify the CpG methylation status. Our result showed that NK‐92MI‐S, with highest levels of Siglec‐7 transcript and protein expressions, possessed the lowest overall methylation status (Fig. 3a). We further analysed the methylation status on each individual CpG site, and found that the CpG sites 1, 2, 3, 6, 8 and 9 were relatively hypomethylated in NK‐92MI‐S cells as opposed to those sites in two other cells. Surprisingly, the CpG 8 site in the NK‐92MI‐S cells was extremely hypomethylated (Fig. 3b). Next, we investigated how 5azaC treatment impacted the overall DNA methylation statuses among these three cells, and observed that their overall DNA methylation levels were all significantly decreased (Fig. 3c). Furthermore, while inspecting all the CpG sites, we found that CpG sites 1, 3, 4, 5, 8 and 9 all showed decreases in methylation from three cell lines after 5azaC treatment (Fig. 3d). Based on these results that DNA methylation status on Siglec‐7 promoter region was greatly impacted by 5azaC treatment and became hypomethylated, it suggested such change could very likely lead to the Siglec‐7 activation in these NK‐92MI cell lines (Figs 2 and 3).
Figure 3.
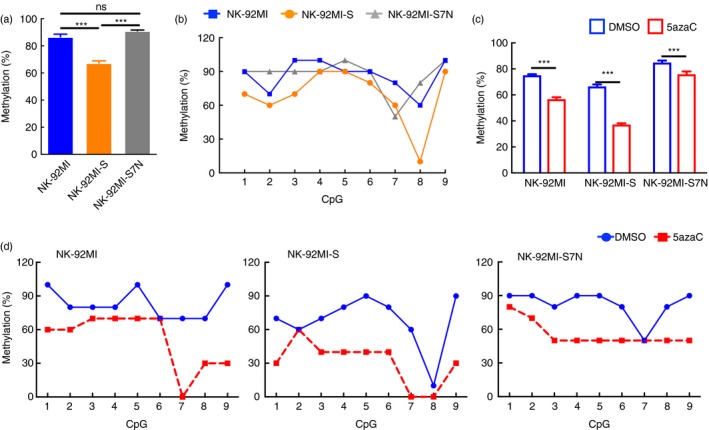
Profiling of changes in methylation status on every CpG site located in the 5′ region of Siglec‐7 after the treatment of methylation inhibitor. (a) Bisulphite sequencing analysis was performed to determine the overall methylation status from the Siglec‐7 promoter region in the natural killer (NK) cells. The data were shown as mean ± SD of triplicates. The result shown was the representative of three independent experiments. ***P < 0·005, Student's t‐test. (b) Data were represented as percentage for the methylation condition of each CpG site, as indicated, in three NK cell lines. Representative data from one of four independent experiments. (c) Overall methylation status of 5′ Siglec‐7 region in the presence and absence of 5‐azacytidine (5azaC) in NK cells. The data were shown as mean ± SD of triplicates. The result shown was representative of three independent experiments. ***P < 0·005, Student's t‐test. (d) Data were represented as percentage of methylation condition of each CpG site in three NK cell lines under the treatment with or without 5azaC, as indicated. Representative data from one of three independent experiments.
The identification of CpG 8 and 9 as two key regulatory sites for the Siglec‐7 activation in NK cells
To further solidify the demethylation effect on these CpG sites in the Siglec‐7 promoter for Siglec‐7 activation, we cultured purified human NK cells, instead of NK‐92MI, in the presence of 5azaC or not. The result showed that without 5azaC treatment, the population of Siglec‐7+ NK cells in the control group was significantly decreased after 144 hr of in vitro culture, as compared with that of the 5azaC treatment group, which maintained the similar Siglec‐7 level from 96‐ to 168‐hr period (Fig. 4a). Next, we measured the change of Siglec‐7 transcripts upon 5azaC treatment. Similar to the results obtained from NK‐92MI cells, the Siglec‐7 transcripts significantly increased with 5azaC stimulation (Fig. 4b).
Figure 4.
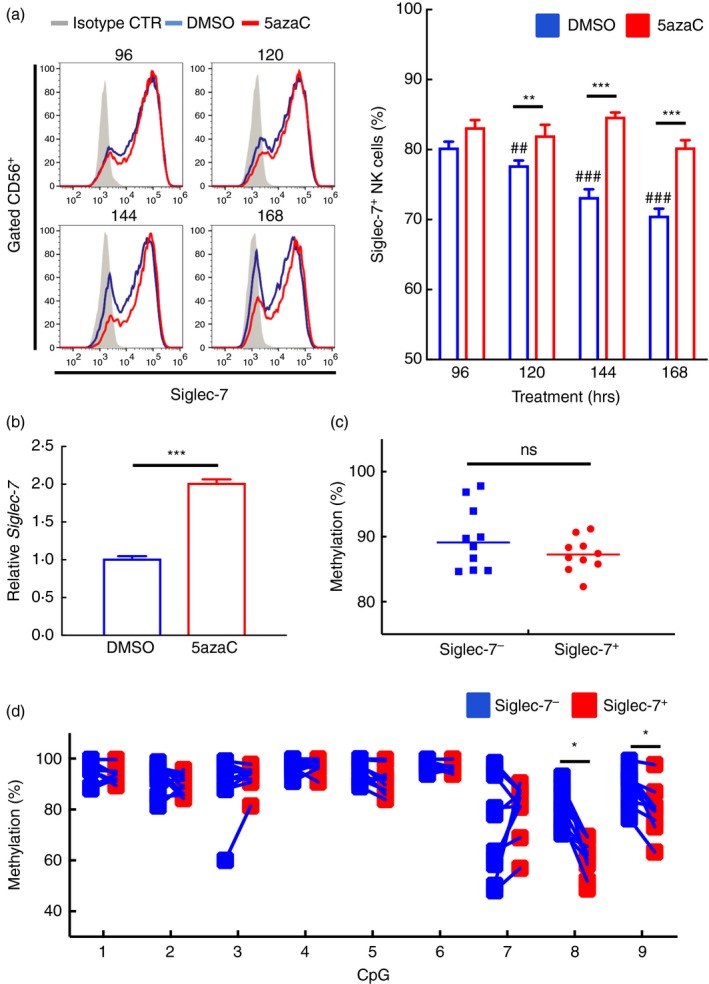
Peripheral natural killer (NK) cell responses in Siglec‐7 5′ promoter methylation status, transcriptional activation and cell surface expression after the 5‐azacytidine (5azaC) treatment. (a) Representative flow cytometric staining pattern for Siglec‐7 expression on the enriched NK cells with 5azaC treatments along the time course, as indicated. The shaded area represented the result from cells incubated with isotype control, and the blue and red lines indicated control and treated groups, respectively. Representative data from one of three independent experiments (left panel). Data were represented in the percentage of Siglec‐7+CD56+ cells with treatment at different time points, as indicated (right panel). The result shown was presented as mean ± SD of triplicates and a representative of three independent experiments. Comparison between the indicated time point and the DMSO group, **P < 0·01; ***P < 0·005 (treated group); ## P < 0·01; ### P < 0·005 (control group), Student's t‐test. (b) Relative expression of Siglec‐7 in peripheral NK cells with 5azaC treatment for 120 hr, and the result was compared with that of untreated control group (arbitrarily set as 1·0). This result was representative of three experiments. Data are presented as mean ± SD of triplicates. ***P < 0·005, Student's t‐test. (c) Data were represented as percentage of the overall methylation levels of 5′ Siglec‐7 promoter region in sorted Siglec‐7− and Siglec‐7+ NK cells from 10 healthy donors. P = 0·124, using paired Student's t‐test. (d) Data were represented as percentage of methylated levels of each CpG site, as indicated, of sorted Siglec‐7− and Siglec‐7+ NK cells from 10 donors. *P < 0·05, paired Student's t‐test.
To more directly address the role of these 9 CpG sites on Siglec‐7 promoter for the activation in peripheral NK cells, we sorted Siglec‐7+ and Siglec‐7− peripheral NK cells, and compared the methylation levels of the Siglec‐7 5′ promoter region by performing amplicon next‐generation sequencing analysis after bisulphite PCR. The overall methylation status of 9 CpG sites in Siglec‐7+ and ‐7− showed no significant difference (Fig. 4c). However, while examining individual CpG methylation status, we found that the levels of methylation in CpG 8 and 9, but not other CpG sites, were significantly higher in Siglec‐7− than in Siglec‐7+ NK cells from 10 healthy donors (Fig. 4d), with the highest decrease observed at CpG site 8 (Fig. S3). A combination of the methylation status results from both NK‐92MI cell lines and peripheral NK cells indicated that CpG sites 8 and 9 could be the regulatory sites for the Siglec‐7 activation in NK cells (Figs 3 and 4).
To examine how the Siglec‐7 transcription was regulated by methylation, we generated a luciferase reporter vector harboring −933~+57 5′ region of Siglec‐7 (WT) in pMCS‐Green Renilla Luc, which was sufficient for initiating the transcription activity after transfection (Fig. 5a). When the reporter plasmid containing this Siglec‐7 promoter was treated with M.SssI for methylation, the gene activity was greatly reduced, suggesting the transcription activity of Siglec‐7 was subjected to the regulation of methylation (Fig. 5a).
Figure 5.
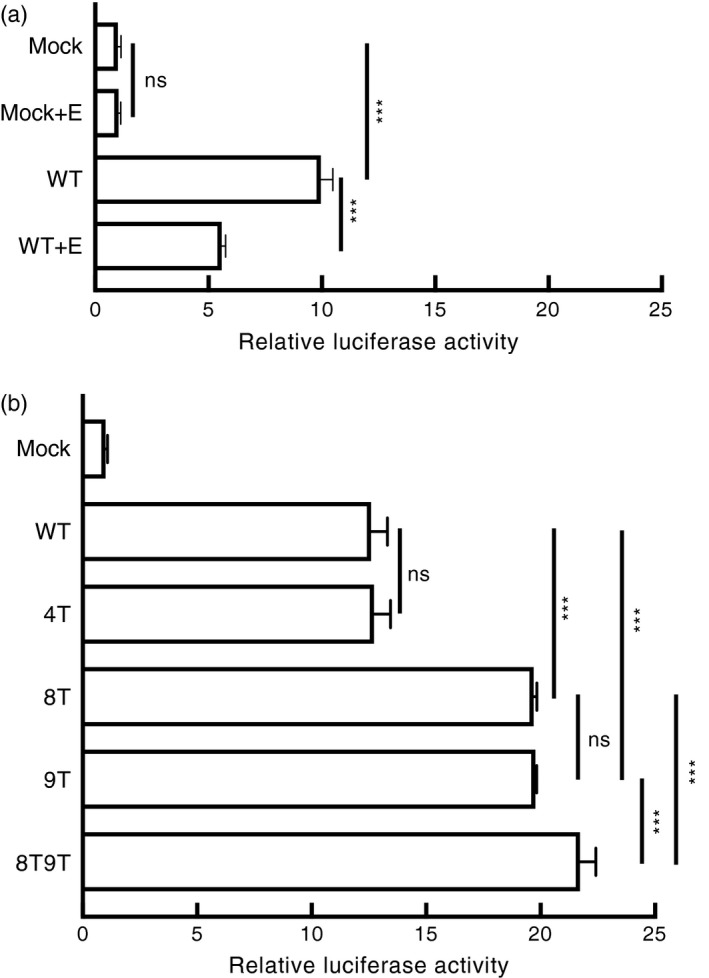
CpG 8 and CpG 9 served as the key responsible sites for the DNA methylation‐regulated Siglec‐7 expression. (a) Luciferase reporter containing the Siglec‐7 promoter (WT), either unmethylated or enzymatically methylated (+E), was transiently transfected into 293T cells and the reporter activity was examined, with co‐transfected pCMV‐Red Firefly Luc plasmid as the internal control. Results were presented as mean ± SD of triplicates. The result was representative of three independent experiments. ***P < 0·005; ns, no significant, Student's t‐test. (b) Luciferase activities from transfected reporters containing WT Siglec‐7 promoter and promoter mutants, including CpG site 4 (4T), 8 (8T), 9 (9T), and a site 8 and 9 double‐mutant (8T9T). All activities were first normalized to Red Firefly, as shown. Results were presented as mean ± SD of triplicates. The result was representative of three independent experiments. ***P < 0·005, Student's t‐test.
To more directly investigate the importance of CpG 8 and 9 for the Siglec‐7 activation, we constructed site‐specific CpG mutations on the CpG 4 (as control), CpG 8 and CpG 9 by replacing unique cytosine (C) with thymine (T) residue, which prevented methylation modification on the desired site. Of all examined constructs, single mutation in either CpG 8 (8T) or CpG 9 (9T) greatly enhanced promoter activity as opposed to that observed in wild‐type (WT) and CpG control mutant 4T (Fig. 5b). Additionally, reporter activity of the CpG double‐mutant 8T9T was significantly higher than the single mutation (8T or 9T; Fig. 5b). Taken together, these results indicated that both CpG 8 and CpG 9 are two major regulatory methylation sites for Siglec‐7 activation.
Regulation of Siglec‐7 activation by class I HDAC‐mediated histone modification in the peripheral NK cells and NK‐92MI cells
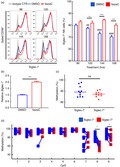
Based on our RNA‐seq results, we also found a correlation in the expression between Siglec‐7 and class I HDACs, HDAC1 and HDAC2, whose expressions were significantly lower in Siglec‐7 expressing NK‐92MI‐S cells (data not shown). To investigate the impact of HDACs on Siglec‐7 activation, we treated these three NK‐92MI cell lines with HDAC class I inhibitor, NaB, and compared with those cells treated with 5azaC and a combination of both chemicals. Our result showed NaB treatment did not greatly affect the surface Siglec‐7 expression in all NK cell lines. But surprisingly when treated with both 5azaC and NaB, all NK cells expressed more surface Siglec‐7 as opposed to those with 5azaC treatment at the time points 72 and 96 hr (Fig. 6a). To re‐confirm the HDAC effect, we isolated the peripheral NK cells, and applied the same treatment to examine Siglec‐7 expression in a time course manner. We found that the Siglec‐7 expression was more sensitively subjected to the regulation of histone modification as evidenced by the fact that the peripheral NK cells were more responsive to treatment with NaB than 5azaC. Interestingly, the peripheral NK cells did show stronger responses to the combined treatment of NaB and 5azaC (Fig. 6b, left and middle panel). In addition to the expression of Siglec‐7, Siglec‐7 regulation on the transcription level was also examined in the peripheral NK cells. The result showed a similar expression pattern to surface Siglec‐7, but an additive effect could be observed in the combined treatment with both NaB and 5azaC (Fig. 6b, right panel). Based on these results, we showed that in addition to the DNA methylation, Siglec‐7 activation could be regulated through histone acetylation in the peripheral NK cells and, to a lesser extent, in three NK‐92MI cell lines.
Figure 6.
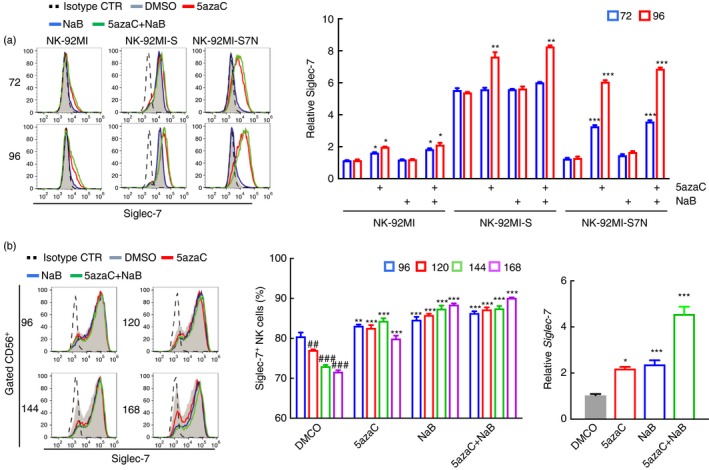
Regulation of Siglec‐7 expression mediated by histone acetylation through Class I histone deacetylase (HDAC). (a) Representative flow cytometric staining pattern for Siglec‐7 on three natural killer (NK) cells with treatments, as indicated, for 72 and 96 hr (left panel). The dashed line represented cells incubated with isotype control, and the shaded area, red, blue and green lines were for treatments with DMSO, 5‐azacytidine (5azaC), butyric acid (NaB), and the combination of 5azaC and NaB, respectively. Representative data were from one of three independent experiments. Column chart of relative MFI of Siglec‐7 expression after normalization to the isotype control (right panel). *P < 0·05; **P < 0·01, ***P < 0·005 comparison within a group for different treatments, Student's t‐test. (b) Surface Siglec‐7 expression pattern of the enriched peripheral NK cells from healthy donors under different treatments, as indicated, along a time course. The dashed line represented cells incubated with isotype control, and the shaded area, red, blue and green lines indicated treatments with DMSO, 5azaC, NaB, and a combination of 5azaC and NaB, respectively (left panel). Representative data were from one of three independent experiments. Column chart of the Siglec‐7+ expressing peripheral NK under the different treatments, as indicated. *P < 0·05; **P < 0·01, ***P < 0·005 comparison within a group for different treatments; ## P < 0·01; ### P < 0·005 comparison between the different time points within the DMSO group, Student's t‐test (middle panel). Quantitative Siglec‐7 transcripts in the peripheral NK cells under different treatments for 120 hr, with normalization to GAPDH. The result was representative of three independent experiments. *P < 0·05, ***P < 0·005, using Student's t‐test.
Discussion
In order to identify the regulatory mechanism(s) for Siglec‐7 expression in NK cells, we here showed that three NK‐92MI cell lines and peripheral NK cells were all very likely subjected to the transcription as the main regulatory step (Fig. 1b). 35 We addressed this goal using two approaches: focusing on screening transactivators and examining epigenetics. With RNA‐seq results and putative binding site data, we narrowed down FoxO1 as a candidate, but later data suggested the change of FoxO1 in expression was unlikely to function as a key Siglec‐7 regulator for expression because there was no correlation in the expression levels between Fox01 and Siglec‐7 (Fig. 1e) in peripheral NK cells. We were not able to identify a responsible transactivator in this study for Siglec‐7 expression. This does not rule out the involvement of transactivator‐mediated regulation as there are still other ways, like phosphorylation or translocation, to activate the transactivator, in addition to the increase in the expression level of responsible transactivator.
Using the 5azaC treatment, we discovered a link between the DNA methylation status and the Siglec‐7 expressions as both Siglec‐7 transcripts and proteins were responsive to the global change in DNA methylation (Fig. 2). After analysing the methylation status profiling changes of methylation level on each CpG site along Siglec‐7 promoter from three NK‐92MI‐related cell lines and overlaying with the data obtained from the peripheral Siglec‐7+ NK cells, we identified CpG 8 and 9 as two candidates responsible for Siglec‐7 expression (Figs 3 and 4). Using the luciferase reporter assay, we compared activities of WT and several CpG site mutants, and our results showed that Siglec‐7 was subjected to regulation by DNA methylation for its expression, and that CpG 8 and CpG 9 in the 5′ Siglec‐7 promoter region served as two key regulatory sites for the Siglec‐7 activation through methylation/demethylation.
It is no surprise that the methylated status on a single CpG site (CpG 8 or CpG 9) was sufficient to significantly regulate the transcription activity in the human peripheral NK cells as there was no noticeable difference in the overall methylation status of 5′ Siglec‐7 between Siglec‐7+ and Siglec‐7− peripheral NK cells (Fig. 4c). It is likely that methylation on one single CpG site can dictate the binding accessibility of transcriptional regulator(s). For example, it has been demonstrated that transcription factor C/EBPα preferentially binds a methylated CRE sequence (TGACGTCA), in which the CpG site is methylated for the tissue‐specific gene activation. 37 We discovered that CpG 8 and CpG 9 resided within several predicted transcription factor consensus binding sites for CREB, ATF and TFII‐1. However, whether these transcription factors are involved in binding this region for the Siglec‐7 activation requires further investigation.
In this research, we employed both NK‐92MI cell line and human peripheral NK cells to investigate the regulatory mechanisms responsible for the Siglec‐7 expression, we here compared and contrasted the similarity and difference between the stable cell line and primary NK cells. First, the correlation in the expression between FoxO1 and Siglec‐7 was only observed in the NK‐92MI cell lines but not in the peripheral NK cells (Fig. 1). Second, CpG sites 8 and 9 were identified as two regulatory sites for the expression. However, there was still a difference in both sites in term of sensitivity for methylation. We found that CpG site 8 was less sensitive for methylation as in both cell models, a large difference in the methylation percentage on CpG 8 could be observed as opposed to that on other sites. In more detail, in three NK‐92MI cells, CpG 8 displayed the biggest gap in methylation percentage between the highest Siglec‐7+ expression NK‐92MI‐S cells and the other two cells with less expression (NK‐92MI and ‐S7N; Fig. 3b). On the other hand, in the peripheral NK cells, CpG 8 also had the biggest gap in methylation percentage (Figs 4d and S3). For CpG 9, this site was more hypermethylated (Figs 3b and 4d), but was more subjected to the effect of the methylation inhibitor as compared with the response of site 8 (Fig. 3b,d). Based on these results, this indicated that both CpG 8 and CpG 9 were preserved as two regulatory sites by these two different cell models for the Siglec‐7 expression. But whether there is a functionally subtle difference between these two sites responding to DNA methylation/demethylation for the Sigelc‐7 expression remains unknown. Third, the peripheral NK cell was more responsive to the effect of HDAC inhibitor, NaB, than were three NK‐92MI cell lines as the NaB effect, regarding surface Sigelc‐7 expression, became manifest only when 5azaC was used simultaneously (Fig. 6a, right panel). Additionally, in the peripheral NK cell, an additive effect was observed in the Siglec‐7 transcript level, indicating that both DNA methylation and histone modification are very likely in two independent regulatory pathways for the Siglec‐7 activation (Fig. 6b, right panel).
As a distinctly known phenotype for possessing the dysregulated genome‐wide DNA methylation pattern in cancer and leukemia cells, epigenetically therapeutic approaches have been employed in the cancer/leukemia therapy for years. 5azaC was the first drug approved by the Food and Drug Administration (FDA) for the treatment of myelodysplastic syndrome, 38 and its therapeutic approval has been expanded for acute myeloid leukaemia, 39 , 40 and multiple solid cancers, including ovarian cancer, prostate cancer and colorectal cancer. 41 , 42 With these treatments, a low dose of 5azaC acts as an agent to convert the status of hypermethylation into hypomethylation in the leukaemia/tumour cells and, therefore, to eliminate malignant cells in patients. 44 , 45 On the other hand, this treatment also impacts the function of immune cells through the change in DNA methylation status. Some studies showed that 5azaC treatment suppresses NK cytotoxicity, 46 , 47 but Sohlberg et al. 48 found systemic treatment with 5azaC shapes the NK cell repertoire and boosts NK‐mediated recognition of malignant cells. Besides DNMT inhibitor, treatment with HDAC inhibitor, including suberoylanilide hydroxamic acid (SAHA) and valproic acid (VPA), also suppresses NK cytotoxicity. 49 In this study, we showed the surface Siglec‐7 of peripheral NK cells can be upregulated by epigenetic therapeutic drugs, and whether this change in Siglec‐7 expression may potentially impact NK cytotoxic functions remains to be investigated, as our cell model showed NK cytotoxicity could be greatly affected in the presence of a high level of Siglec‐7 expression. 35 /> Our results suggested that treatment of inhibitors of DNMTs and HDACs upregulated Siglec‐7 transcription and cell surface Siglec‐7 expression, which may have a negative effect on NK cytotoxicity. As inhibitors for DNMTs and HDACs are clinical drugs for leukaemia treatment, how impactful Siglec‐7 upregulation is in affecting NK cytotoxicity during such treatment is currently unknown for DNMTs and HDACs have the global effect on various gene expressions. To greater understand how NK cytotoxicity is influenced by the HDAC inhibitor, a detailed expression profiling of affected key activating and inhibitory receptors will be of great help to provide invaluable information for epigenetic‐based treatment.
In this study, we first characterized the involvement of DNA methylation and histone modification for the Siglec‐7 expression in NK cells. We identified CpG 8 and CpG 9 on Siglec‐7 promoter that served as DNA methylation/demethylation regulatory sites for gene activation in both NK cell lines and peripheral NK cells. Also importantly, with treatment of the HDAC inhibitor, Siglec‐7 expression was enhanced in those examined NK cells.
Disclosures
The authors have no conflicting interest to declare.
Supporting information
Figure S1. Volcano plots and heatmap for those differentially expressed genes from two comparisons in three NK cells.
Figure S2. Relative expression of DNMT1, DNMT3A and DNMT3B among three NK cell lines, and the results were compared with those of NK‐92MI cells (arbitrarily set as 1.0).
Figure S3. Hypomethylated status of CpG 8 and 9 on Siglec‐7 promoter in the human peripheral Siglec‐7+ NK cells.
Acknowledgements
Y. C. Twu designed the experiments, analysed and interpreted data, and wrote the manuscript. S. C. Su and T. J. Chiou analysed and interpreted data. H. T. Huang, Y. H. Lin, Y.X. Wu, Y. C. Shih and T. H. Fan performed the research and analysed the data. This study was supported by research grants from the Chang Gung Memorial Hospital (CORPG2J0061 and BMRPE97) to S. C. Su, Ministry of Science and Technology, Taiwan (MOST 107‐2320‐B‐010‐010 and 107‐2314‐B‐075‐038), to Y. C. Twu, and The Professor Tsuei‐Chu Mong Merit Scholarship (30619006) to H. T. Huang. The authors greatly thank Dr Ting‐Cheng Su for providing valuable comments.
References
- 1. Falco M, Biassoni R, Bottino C, Vitale M, Sivori S, Augugliaro R et al Identification and molecular cloning of p75/AIRM1, a novel member of the sialoadhesin family that functions as an inhibitory receptor in human natural killer cells. J Exp Med 1999; 190:793–802. [DOI] [PMC free article] [PubMed] [Google Scholar]
- 2. Nicoll G, Ni J, Liu D, Klenerman P, Munday J, Dubock S et al Identification and characterization of a novel siglec, siglec‐7, expressed by human natural killer cells and monocytes. J Biol Chem 1999; 274:34 089–95. [DOI] [PubMed] [Google Scholar]
- 3. Angata T, Varki A. Siglec‐7: a sialic acid‐binding lectin of the immunoglobulin superfamily. Glycobiology 2000; 10:431–8. [DOI] [PubMed] [Google Scholar]
- 4. Cao H, de Bono B, Belov K, Wong ES, Trowsdale J, Barrow AD. Comparative genomics indicates the mammalian CD33rSiglec locus evolved by an ancient large‐scale inverse duplication and suggests all Siglecs share a common ancestral region. Immunogenetics 2009; 61:401–17. [DOI] [PubMed] [Google Scholar]
- 5. Mizrahi S, Gibbs BF, Karra L, Ben‐Zimra M, Levi‐Schaffer F. Siglec‐7 is an inhibitory receptor on human mast cells and basophils. J Allergy Clin Immunol 2014; 134:230–3. [DOI] [PubMed] [Google Scholar]
- 6. Nguyen KA, Hamzeh‐Cognasse H, Palle S, Anselme‐Bertrand I, Arthaud CA, Chavarin P et al Role of Siglec‐7 in apoptosis in human platelets. PLoS ONE 2014; 9:e106239. [DOI] [PMC free article] [PubMed] [Google Scholar]
- 7. Legrand F, Landolina N, Zaffran I, Emeh RO, Chen E, Klion AD et al Siglec‐7 on peripheral blood eosinophils: Surface expression and function. Allergy 2019; 74:1257–65. [DOI] [PMC free article] [PubMed] [Google Scholar]
- 8. Yamaji T, Teranishi T, Alphey MS, Crocker PR, Hashimoto Y. A small region of the natural killer cell receptor, Siglec‐7, is responsible for its preferred binding to alpha 2,8‐disialyl and branched alpha 2,6‐sialyl residues. A comparison with Siglec‐9. J Biol Chem 2002; 277:6324–32. [DOI] [PubMed] [Google Scholar]
- 9. Miyazaki K, Sakuma K, Kawamura YI, Izawa M, Ohmori K, Mitsuki M et al Colonic epithelial cells express specific ligands for mucosal macrophage immunosuppressive receptors siglec‐7 and ‐9. J Immunol 2012; 188:4690–700. [DOI] [PubMed] [Google Scholar]
- 10. Jandus C, Boligan KF, Chijioke O, Liu H, Dahlhaus M, Demoulins T et al Interactions between Siglec‐7/9 receptors and ligands influence NK cell‐dependent tumor immunosurveillance. J Clin Invest 2014; 124:1810–20. [DOI] [PMC free article] [PubMed] [Google Scholar]
- 11. Laubli H, Pearce OM, Schwarz F, Siddiqui SS, Deng L, Stanczak MA et al Engagement of myelomonocytic Siglecs by tumor‐associated ligands modulates the innate immune response to cancer. Proc Natl Acad Sci USA 2014; 111:14 211–6. [DOI] [PMC free article] [PubMed] [Google Scholar]
- 12. Hudak JE, Canham SM, Bertozzi CR. Glycocalyx engineering reveals a Siglec‐based mechanism for NK cell immunoevasion. Nat Chem Biol 2014; 10:69–75. [DOI] [PMC free article] [PubMed] [Google Scholar]
- 13. Varchetta S, Mele D, Lombardi A, Oliviero B, Mantovani S, Tinelli C et al Lack of Siglec‐7 expression identifies a dysfunctional natural killer cell subset associated with liver inflammation and fibrosis in chronic HCV infection. Gut 2016; 65:1998–2006. [DOI] [PubMed] [Google Scholar]
- 14. Dharmadhikari G, Stolz K, Hauke M, Morgan NG, Varki A, de Koning E et al Siglec‐7 restores beta‐cell function and survival and reduces inflammation in pancreatic islets from patients with diabetes. Sci Rep 2017; 7:45 319. [DOI] [PMC free article] [PubMed] [Google Scholar]
- 15. Rosenstock P, Horstkorte R, Gnanapragassam VS, Harth J, Kielstein H. Siglec‐7 expression is reduced on a natural killer (NK) cell subset of obese humans. Immunol Res 2017; 65:1017–24. [DOI] [PMC free article] [PubMed] [Google Scholar]
- 16. Boggs SS, Trevisan M, Patrene K, Geogopoulos K. Lack of natural killer cell precursors in fetal liver of Ikaros knockout mutant mice. Nat Immun 1998; 16:137–45. [DOI] [PubMed] [Google Scholar]
- 17. Ramirez K, Chandler KJ, Spaulding C, Zandi S, Sigvardsson M, Graves BJ et al Gene deregulation and chronic activation in natural killer cells deficient in the transcription factor ETS1. Immunity 2012; 36:921–32. [DOI] [PMC free article] [PubMed] [Google Scholar]
- 18. Colucci F, Caligiuri MA, Di Santo JP. What does it take to make a natural killer? Nat Rev Immunol 2003; 3:413–25. [DOI] [PubMed] [Google Scholar]
- 19. Hesslein DG, Lanier LL. Transcriptional control of natural killer cell development and function. Adv Immunol 2011; 109:45–85. [DOI] [PubMed] [Google Scholar]
- 20. Luevano M, Madrigal A, Saudemont A. Transcription factors involved in the regulation of natural killer cell development and function: an update. Front Immunol 2012; 3:319. [DOI] [PMC free article] [PubMed] [Google Scholar]
- 21. Smith MA, Maurin M, Cho HI, Becknell B, Freud AG, Yu J et al PRDM1/Blimp‐1 controls effector cytokine production in human NK cells. J Immunol 2010; 185:6058–67. [DOI] [PMC free article] [PubMed] [Google Scholar]
- 22. Kallies A, Carotta S, Huntington ND, Bernard NJ, Tarlinton DM, Smyth MJ et al A role for Blimp1 in the transcriptional network controlling natural killer cell maturation. Blood 2011; 117:1869–79. [DOI] [PubMed] [Google Scholar]
- 23. Townsend MJ, Weinmann AS, Matsuda JL, Salomon R, Farnham PJ, Biron CA et al T‐bet regulates the terminal maturation and homeostasis of NK and Valpha14i NKT cells. Immunity 2004; 20:477–94. [DOI] [PubMed] [Google Scholar]
- 24. Robbins SH, Tessmer MS, Van Kaer L, Brossay L. Direct effects of T‐bet and MHC class I expression, but not STAT1, on peripheral NK cell maturation. Eur J Immunol 2005; 35:757–65. [DOI] [PubMed] [Google Scholar]
- 25. Gordon SM, Chaix J, Rupp LJ, Wu J, Madera S, Sun JC et al The transcription factors T‐bet and Eomes control key checkpoints of natural killer cell maturation. Immunity 2012; 36:55–67. [DOI] [PMC free article] [PubMed] [Google Scholar]
- 26. Daussy C, Faure F, Mayol K, Viel S, Gasteiger G, Charrier E et al T‐bet and Eomes instruct the development of two distinct natural killer cell lineages in the liver and in the bone marrow. J Exp Med 2014; 211:563–77. [DOI] [PMC free article] [PubMed] [Google Scholar]
- 27. Deng Y, Kerdiles Y, Chu J, Yuan S, Wang Y, Chen X et al Transcription factor Foxo1 is a negative regulator of natural killer cell maturation and function. Immunity 2015; 42:457–70. [DOI] [PMC free article] [PubMed] [Google Scholar]
- 28. Schenk A, Bloch W, Zimmer P. Natural Killer Cells–an epigenetic perspective of development and regulation. Int J Mol Sci 2016; 17:326. [DOI] [PMC free article] [PubMed] [Google Scholar]
- 29. Stricker SH, Koferle A, Beck S. From profiles to function in epigenomics. Nat Rev Genet 2017; 18:51–66. [DOI] [PubMed] [Google Scholar]
- 30. Okano M, Bell DW, Haber DA, Li E. DNA methyltransferases Dnmt3a and Dnmt3b are essential for de novo methylation and mammalian development. Cell 1999; 99:247–57. [DOI] [PubMed] [Google Scholar]
- 31. Kafri T, Ariel M, Brandeis M, Shemer R, Urven L, McCarrey J et al Developmental pattern of gene‐specific DNA methylation in the mouse embryo and germ line. Genes Dev 1992; 6:705–14. [DOI] [PubMed] [Google Scholar]
- 32. Li G, Margueron R, Hu G, Stokes D, Wang YH, Reinberg D. Highly compacted chromatin formed in vitro reflects the dynamics of transcription activation in vivo . Mol Cell 2010; 38:41–53. [DOI] [PMC free article] [PubMed] [Google Scholar]
- 33. Bolden JE, Peart MJ, Johnstone RW. Anticancer activities of histone deacetylase inhibitors. Nat Rev Drug Discov 2006; 5:769–84. [DOI] [PubMed] [Google Scholar]
- 34. Brunetta E, Fogli M, Varchetta S, Bozzo L, Hudspeth KL, Marcenaro E et al The decreased expression of Siglec‐7 represents an early marker of dysfunctional natural killer‐cell subsets associated with high levels of HIV‐1 viremia. Blood 2009; 114:3822–30. [DOI] [PMC free article] [PubMed] [Google Scholar]
- 35. Huang CH, Liao YJ, Fan TH, Chiou TJ, Lin YH, Twu YC. A developed NK‐92MI cell line with Siglec‐7(neg) phenotype exhibits high and sustainable cytotoxicity against leukemia cells. Int J Mol Sci 2018; 19:1073. [DOI] [PMC free article] [PubMed] [Google Scholar]
- 36. Liao YJ, Lee YH, Chang FL, Ho H, Huang CH, Twu YC. The SHP2‐ERK2 signaling pathway regulates branched I antigen formation by controlling the binding of CCAAT/enhancer binding protein alpha to the IGnTC promoter region during erythroid differentiation. Transfusion 2016; 56:2691–702. [DOI] [PubMed] [Google Scholar]
- 37. Rishi V, Bhattacharya P, Chatterjee R, Rozenberg J, Zhao J, Glass K et al CpG methylation of half‐CRE sequences creates C/EBPalpha binding sites that activate some tissue‐specific genes. Proc Natl Acad Sci USA 2010; 107:20 311–6. [DOI] [PMC free article] [PubMed] [Google Scholar]
- 38. Kaminskas E, Farrell AT, Wang YC, Sridhara R, Pazdur R. FDA drug approval summary: azacitidine (5‐azacytidine, Vidaza) for injectable suspension. Oncologist 2005; 10:176–82. [DOI] [PubMed] [Google Scholar]
- 39. Dohner H, Estey E, Grimwade D, Amadori S, Appelbaum FR, Buchner T et al Diagnosis and management of AML in adults: 2017 ELN recommendations from an international expert panel. Blood 2017; 129:424–47. [DOI] [PMC free article] [PubMed] [Google Scholar]
- 40. Bohl SR, Bullinger L, Rucker FG. Epigenetic therapy: azacytidine and decitabine in acute myeloid leukemia. Expert Rev Hematol 2018; 11:361–71. [DOI] [PubMed] [Google Scholar]
- 41. Fu S, Hu W, Iyer R, Kavanagh JJ, Coleman RL, Levenback CF et al Phase 1b–2a study to reverse platinum resistance through use of a hypomethylating agent, azacitidine, in patients with platinum‐resistant or platinum‐refractory epithelial ovarian cancer. Cancer 2011; 117:1661–9. [DOI] [PMC free article] [PubMed] [Google Scholar]
- 42. Singal R, Ramachandran K, Gordian E, Quintero C, Zhao W, Reis IM. Phase I/II study of azacitidine, docetaxel, and prednisone in patients with metastatic castration‐resistant prostate cancer previously treated with docetaxel‐based therapy. Clin Genitourin Cancer 2015; 13:22–31. [DOI] [PubMed] [Google Scholar]
- 43. Lee V, Wang J, Zahurak M, Gootjes E, Verheul HM, Parkinson R et al A Phase I trial of a guadecitabine (SGI‐110) and irinotecan in metastatic colorectal cancer patients previously exposed to Irinotecan. Clin Cancer Res 2018; 24:6160–7. [DOI] [PubMed] [Google Scholar]
- 44. Tsai HC, Li H, Van Neste L, Cai Y, Robert C, Rassool FV et al Transient low doses of DNA‐demethylating agents exert durable antitumor effects on hematological and epithelial tumor cells. Cancer Cell 2012; 21:430–46. [DOI] [PMC free article] [PubMed] [Google Scholar]
- 45. Borodovsky A, Salmasi V, Turcan S, Fabius AW, Baia GS, Eberhart CG et al 5‐azacytidine reduces methylation, promotes differentiation and induces tumor regression in a patient‐derived IDH1 mutant glioma xenograft. Oncotarget 2013; 4:1737–47. [DOI] [PMC free article] [PubMed] [Google Scholar]
- 46. Gao XN, Lin J, Wang LL, Yu L. Demethylating treatment suppresses natural killer cell cytolytic activity. Mol Immunol 2009; 46:2064–70. [DOI] [PubMed] [Google Scholar]
- 47. Schmiedel BJ, Arelin V, Gruenebach F, Krusch M, Schmidt SM, Salih HR. Azacytidine impairs NK cell reactivity while decitabine augments NK cell responsiveness toward stimulation. Int J Cancer 2011; 128:2911–22. [DOI] [PubMed] [Google Scholar]
- 48. Sohlberg E, Pfefferle A, Andersson S, Baumann BC, Hellstrom‐Lindberg E, Malmberg KJ. Imprint of 5‐azacytidine on the natural killer cell repertoire during systemic treatment for high‐risk myelodysplastic syndrome. Oncotarget 2015; 6:34 178–90. [DOI] [PMC free article] [PubMed] [Google Scholar]
- 49. Ogbomo H, Michaelis M, Kreuter J, Doerr HW, Cinatl J Jr. Histone deacetylase inhibitors suppress natural killer cell cytolytic activity. FEBS Lett 2007; 581:1317–22. [DOI] [PubMed] [Google Scholar]
Associated Data
This section collects any data citations, data availability statements, or supplementary materials included in this article.
Supplementary Materials
Figure S1. Volcano plots and heatmap for those differentially expressed genes from two comparisons in three NK cells.
Figure S2. Relative expression of DNMT1, DNMT3A and DNMT3B among three NK cell lines, and the results were compared with those of NK‐92MI cells (arbitrarily set as 1.0).
Figure S3. Hypomethylated status of CpG 8 and 9 on Siglec‐7 promoter in the human peripheral Siglec‐7+ NK cells.