Key Points
Question
How do work relative value unit (wRVU) compensation rates vary across medical and surgical specialties?
Findings
In this cross-sectional study, most specialties had wRVU compensation rates between 0.035 and 0.045 wRVUs/min. The mean compensation rate for surgical specialties was 7.2% higher than for medical specialties, a difference that was not statistically significant.
Meaning
Factors outside of the wRVU system, such as payer mix and work hours, could be targeted if narrowing the difference in compensation across specialties is desired.
Abstract
Importance
The work relative value units (wRVUs) for a physician service can be conceptualized as the amount of time spent by the physician multiplied by a compensation rate (wRVUs/min). Disproportionately high compensation rates assigned to procedures have been blamed for pay differences across specialties, but to our knowledge, a comprehensive assessment is lacking.
Objective
To assess how compensation rates built into work RVUs contribute to differences in physician compensation across specialties.
Design, Setting, and Participants
This cross-sectional analysis examined 2017 Part B fee-for-service Medicare data. The data were analyzed from May 1 to May 30, 2019.
Main Outcomes and Measures
A specialty-wide compensation rate (wRVUs/min) was generated for 42 medical and surgical specialties defined as the sum of wRVUs for all billed current procedural terminology codes divided by the presumed time to perform those services. This measure accounted for the volume and diversity of services each specialty provides. Sensitivity analyses were performed to assess the association of errors in wRVU time estimates with average compensation rates.
Results
The final sample included 42 specialties and 6587 distinct Current Procedual Terminology (CPT) codes. The number of CPT codes attributed to a specialty ranged from 575 (medical oncology) to 4346 (general surgery). Compensation rates ranged from 0.029 wRVUs/min (pathology) to 0.057 wRVUs/min (emergency medicine). Most specialties (34/42 [81.0%]) had compensation rates between 0.035 and 0.045 wRVUs/min. The mean compensation rate for surgical specialties was 7.2% higher than for medical specialties, a difference that was not statistically significant. This narrow range reflects the fact that most specialties had more than 60% of time allocated to activities outside the intraservice period. Assuming that time values for surgical procedures are significantly overestimated increased the difference in average compensation between surgical and medical specialties to 23.4%.
Conclusions and Relevance
Compensation rates assumed in wRVU valuations are small contributors to differences in physician compensation. Factors outside of the wRVU system, such as payer mix and work hours, could be targeted if narrowing the difference in compensation across specialties is desired.
This cross-sectional study assesses how compensation rates built into work relative value units contribute to differences in physician compensation across specialties.
Introduction
Compensation for physician specialties varies widely. In 2017, family practice physicians made a median $241 085 while neurosurgeons made $737 289.1 This pay gap is associated with declining interest in primary care despite increasing need.2,3 The work relative value unit (wRVU) scale is frequently indicated as a primary driver of this compensation difference,2,4,5,6 yet to our knowledge there are few empirical evaluations.7,8
In 1992, Medicare changed physician compensation, replacing “usual, customary, and reasonable charges” with the Resource Based Relative Value Scale. One goal of this system was to balance compensation across specialties to slow the trend toward specialization.9 Medicare pays physicians approximately $36 per wRVU. The number of wRVUs assigned to a Current Procedural Terminology (CPT) code was established in the late 1980s using a national survey and statistical methods by researchers at Harvard University (Boston, Massachusetts).9 Work RVUs were conceptualized as the time spent by the physician multiplied by a compensation rate termed intensity. Because services require varied mental effort, technical skill, and stress, the intensity allowed the rate of payment (wRVUs/min) to differ across services. However, intensity is subjective and researchers acknowledged that the underlying domains were “almost impossible to measure objectively.”9 There remain concerns that intensity values are distorted with procedures compensated at disproportionately higher rates than cognitive tasks.2,4,5,6,8
However, previous analyses have neglected some of the nuance of the wRVU system. Physicians perform numerous services, with each compensated at a different rate. For example, a substantial portion of physician time is spent before and after the patient encounter, time that is compensated at low rates in the wRVU scale. Therefore, if only a small fraction of proceduralists' time is dedicated to highly compensated activities (eg, performing open-heart surgery) and most of their time is spent on lower-compensated activities (eg, prepping the patient, following up the patient in the hospital), then the average compensation rate for proceduralists may not differ substantially from other disciplines.
In this study, we calculated the compensation rate built into wRVU valuations for 42 medical and surgical specialties accounting for the diversity of services these specialties provide. We explored why differences in compensation rates exist across specialties and simulated how errors in wRVU time estimates may materially affect physician compensation.
Methods
Building Block Method of wRVUs and the Method of Relative Value Scale Update Committee (RUC) Valuation
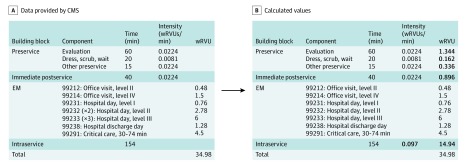
When asked to revalue the wRVUs for an existing CPT code, the RUC asks specialty societies to perform a survey of physicians to estimate the work involved in performing the service. Conceptually, the total wRVU valuation can be considered the sum of pre-, intra-, and postservice work, commonly referred to as building blocks.10 Preservice includes preparing for/evaluating a patient, positioning, draping, and scrubbing. Intraservice includes face-to-face time or, for procedures, skin-to-skin time. Finally, postservice includes immediate postservice (eg, communicating with clinicians, transferring the patient to the recovery room) and, for procedures with 10-day or 90-day global periods, bundled postoperative evaluation and management (EM) codes. Bundling EM codes into a global period was one of the original tenants of the RVU system aimed to motivate clinicians to take ownership over peri- and postoperative care.11 In the survey, physicians are asked to estimate the overall work for the CPT code as well as the work and time involved in each block. The results are tabulated and the specialty society asks the RUC to vote on a wRVU valuation. If the RUC approves the valuation, it is sent to the US Centers for Medicare & Medicaid Services (CMS) who, more often than not, accepts the valuation.12 CMS then publishes the revised wRVU valuation along with the time estimates underlying the valuation. With these data, one can back-calculate the time and presumed intensity values for each block. A detailed example is provided in Figure 1 for coronary artery bypass grafting.
Figure 1. Building Block Method of Work Relative Value Units (wRVUs) Assignment for Coronary Bypass Grafting (Current Procedural Terminology Code 33510).
Intensity is the terminology used in the literature but compensation rate is used in the article for clarity. Intensity values for the pre- and immediate postservice building blocks are fixed using numbers derived from the original Harvard studies. Time values for the pre-, immediate post, and intraservice period are available in the physician work time file and the wRVUs are available in the wRVU file. The wRVUs assigned to the pre- and immediate postservice period are the multiple of time and intensity. The intraservice wRVU can then be back calculated by taking the total wRVU and subtracting the wRVUs for the pre–, immediate, and post–evaluation and management (EM) building blocks. Finally the intraservice intensity can be calculated by dividing the wRVU for the intraservice period by intraservice time. Each EM code also has an intraservice time and intensity value but these values were omitted for simplicity and are also not necessary to the calculation.
Data Sources and Ethics Review
We used 3 publicly available data sets from CMS: (1) The Calendar Year 2017 Physician Fee Schedule Final Rule Physician Time file,13 (2) Addendum B of the Calendar Year 2017 Physician Fee Schedule Final Rule,13 and (3) The 2017 Physician/Supplier Procedure Summary (PSPS) file.14 Because all data were publicly available and no patient identifiers were included, this analysis did not meet the definition of human subjects research and institutional review board and informed consent were waived.
For each CPT code, the physician time file provided time values (in minutes) for the pre-, intra-, and immediate postservice periods and, for codes with global periods, the number and type of bundled EM codes along with the presumed time for those visits. The final rule file provided the wRVUs for each CPT code. The combination of these 2 files provides the data depicted in Figure 1. The PSPS is a 100% part B file that allowed the calculation of total and specialty-specific volumes. Adjustments were made to account for duplicate records (eAppendix 1 in the Supplement). Specialties were categorized according to Medicare specialty codes.15
Approach
The primary aim of this analysis was to calculate the compensation rate, measured in wRVUs/min, for each specialty. The numerator was the number of wRVUs billed by the specialty over the calendar year. The denominator was calculated as the volume of all CPT codes billed by the specialty multiplied by the presumed time it takes to perform those CPT codes provided in the physician time file.
The second aim was to assess why compensation differences exist across specialties. To accomplish this, we grouped the activities that physicians can be compensated for into (1) EM-based care and (2) non–EM-based care. Within EM-based care, physicians can be compensated for stand-alone EM visits (eg, seeing a patient in the office) or global bundled EM visits (eg, rounding to see a patient postoperatively). Non–EM-based care is the remainder of care physicians bill for, such as operating, reading films, and reviewing pathology slides. For each of these tasks/procedures, physicians are compensated for the service itself (intraservice), and for the time immediately before and afterwards (preservice and immediate postservice).
In the original Harvard studies, physician estimates for the intensity (and therefore compensation rate) of preservice and immediate postservice work did not differ significantly across specialties. In other words, a cardiac surgeon positioning a patient was deemed no more challenging than a neurosurgeon positioning a patient. When the RUC evaluates RVU valuations, the compensation rates for pre- and immediate postservice have not changed since the original Harvard study and remain constant across specialties with low values ranging from 0.0081 to 0.0224 wRVUs/min (Figure 1). Compensation rates for EM codes are the same for stand-alone and bundled care and do not differ by specialty, ranging from 0.027 (99211, level I office follow-up) to 0.096 wRVUs/min (99291, the first hour of critical care). Intraservice compensation rates vary from one CPT code to the next and can be as high as 0.377 wRVUs/min (58672, laparoscopic fimbrioplasty).
Putting this together, if a specialty spends most of its time on the intraservice period (ie, face-to-face or skin-to-skin time) performing services with high compensation rates, its physicians will be paid more generously. For example, the intraservice compensation rate for cataract surgery is 0.210 wRVUs/min, more than twice as high as all EM codes. If ophthalmologists performed only cataract surgery, they would make 0.210 wRVUs per minute. However, physicians perform various services and time is distributed across the pre-, intra-, and postservice periods. By calculating measures at the level of an entire specialty, we were able to ascertain the compensation rate for a given specialty reflecting the volume and compensation rates of all the services it provided.
Sample
We excluded CPT codes with 0 wRVUs and codes without time values. We collapsed the PSPS file to the CPT/specialty level (ie, 1 CPT code could be included multiple times because more than 1 specialty could bill that code). The analysis was limited to physician clinicians and excluded 7 very low-volume specialties. Cumulatively, these specialties accounted for less than 0.5% of total physician work. After the exclusions, the PSPS file was merged with the work time and wRVU files. There were no missing data.
Analysis
This article is presented following the Strengthening the Reporting of Observational Studies in Epidemiology guidelines (eAppendix 2 in the Supplement).16 All analyses were done using Stata, version 15.1 (StataCorp), with statistical significance determined using 2-sided tests and an α of .05. First, the compensation rate was calculated for each specialty, including comparing surgical and medical specialties using 2-sample t tests. To understand what contributed to differences, the proportion of a specialty's time dedicated to each activity was calculated along with the compensation rate for each.
Finally, we ran 2 sensitivity analyses to assess how errors in RVU time estimates might bias our results. First, there are concerns that surgeons are currently being paid for bundled EM visits that are not being performed. A recent CMS analysis estimated that fewer than 10% of visits bundled into 10-day global periods and fewer than 50% of visits bundled into 90-day global periods are actually performed. To simulate the effect of these errors, we removed all of the time dedicated to bundled EM visits for procedures with 10-day global periods and 50% of the time dedicated to bundled EM visits for procedures with 90-day global periods from the denominator of our estimates. Second, there are concerns that intraoperative time estimates are too high for surgical procedures.17,18 The latest research suggests estimates may be systematically overestimated by about 10%.19 To simulate the effect of this inaccuracy, we removed 10% of time from the intraservice estimates for surgeons.
Results
Overall Compensation Rate Across Specialties
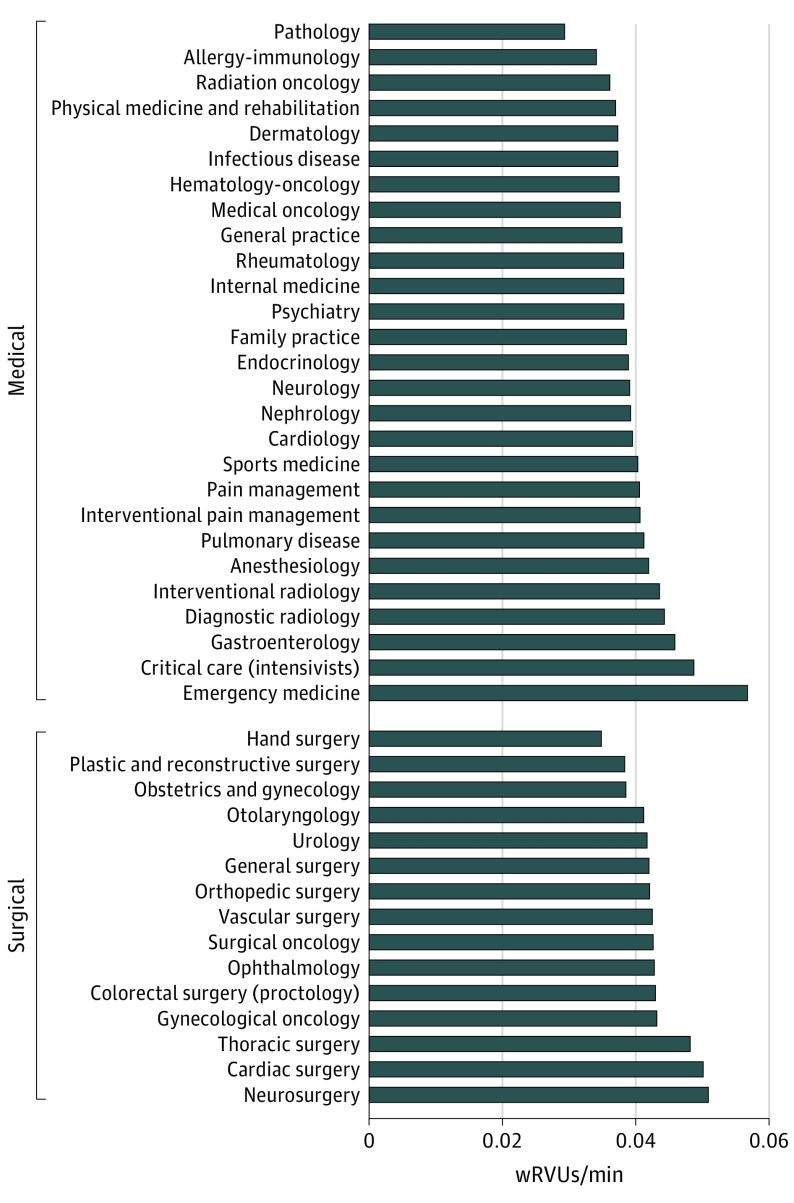
The final sample included 42 specialties and 6587 distinct CPT codes. The number of CPT codes attributed to a specialty ranged from 575 (medical oncology) to 4346 (general surgery). The overall compensation rate of a given specialty is shown in Figure 2, stratified into surgical and medical disciplines. Compensation rates ranged from 0.029 wRVUs/min (pathology) to 0.057 wRVUs/min (emergency medicine). For surgical specialties, rates ranged from 0.035 wRVUs/min (hand surgery) to 0.051 wRVUs/min (neurosurgery). Most specialties fell in a narrow range, with 34 of 42 specialties (81.0%) having values between 0.035 to 0.045 wRVUs/min. Overall, surgical specialties had 7.2% higher compensation rates than medical specialties (surgical, 0.043 wRVUs/min vs medical, 0.040 wRVUs/min), a difference that was not statistically significant (P = .07).
Figure 2. Compensations Rate Built Into the Work Relative Value Unit (wRVU) Scale Across Medical and Surgical Specialties.
Proportion of Time Allocated to Each Activity
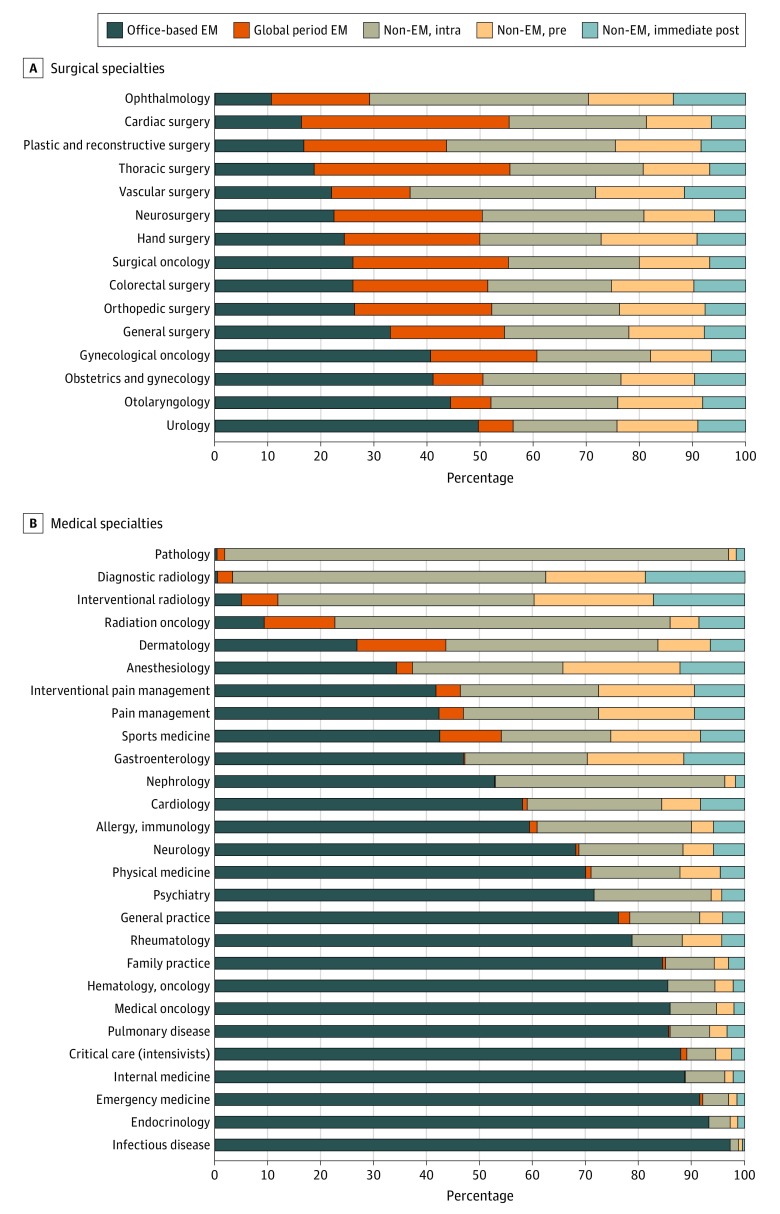
Figure 3 shows the proportion of time each specialty is allocated to different activities based on current wRVU valuations for medical and surgical specialties. The distribution of time is heterogenous for medical specialties. Traditional nonprocedural medical specialties, such as internal medicine and infectious disease, have a large proportion of their time allocated to stand-alone EM activities. Conversely, for specialties such as pathology, radiology, and radiation oncology, for which most services are task- or procedure-based (eg, cytopathology), most of the time is allocated to non-EM intraservice tasks. These activities are akin to the operative time spent by a surgeon.
Figure 3. Proportion of Time Allocated to Various Activities.
EM indicates evaluation and management.
The distribution of time across surgical specialties was more homogenous. Outpatient-focused specialties, such as urology and otolaryngology, have more time allocated to stand-alone EM codes than specialties that primarily perform operations for inpatients (eg, cardiac). Most surgical specialties have less than 40% of their time allocated to non-EM intraservice tasks (ie, operating). Ophthalmology is the only exception, for which 41% of time is dedicated to non-EM intraservice tasks, which reflects a subset of CPT codes (92XXX) for office-based care (eg, eye examinations, contact lens fitting) that are coded outside of the usual stand-alone EM codes (992XX).
Compensation Rates for Select Activities
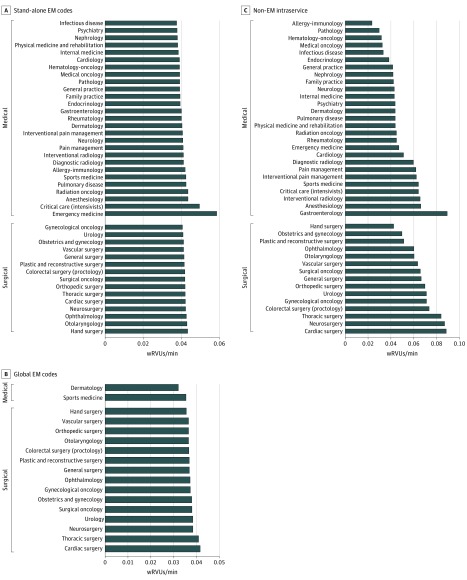
Figure 4 shows compensation rates for individual activities across specialties, including stand-alone EM (Figure 4A), global period EM (Figure 4B), and non-EM intraservice activities (Figure 4C). Most specialties (40/42 [95.2%]) fell in a narrow band of compensation rates for stand-alone EM codes ranging from 0.037 wRVUs/min to 0.043 wRVUs/min (Figure 4A). The 2 exceptions were critical care (0.049 wRVUs/min) and emergency medicine (0.058 wRVUs/min), which have stand-alone codes compensated at higher levels than other specialties because of dedicated emergency department and critical care codes.
Figure 4. Compensation Rate for Individual Activities Across Medical and Surgical Specialties.
Global evaluation and management (EM) codes among specialties with more than 5% of work relative value units (wRVUs) derived from global EM activity.
Only 2 medical disciplines (dermatology and sports medicine) derived a significant fraction (>5%) of their overall compensation from global period–based compensation, whereas all 15 surgical disciplines did (Figure 4B). As with stand-alone EM, the range of compensation rates was relatively narrow, from 0.032 wRVUs/min to 0.042 wRVUs/min. Cardiac and thoracic surgery had higher rates than the other disciplines because of the inclusion of critical care time in the postoperative period.
Intraservice compensation rates varied from 0.021 wRVUs/min (allergy/immunology) to 0.089 wRVUs/min (gastroenterology). Within surgery, values ranged from 0.042 wRVUs/min (hand surgery) to 0.088 wRVUs/min (cardiac surgery). Surgical specialties had 40.7% higher mean (SD) intraservice compensation rates than medical specialties (0.067 [0.013] wRVUs/min vs 0.048 [0.015] wRVUs/min; P = .001). High-volume (>1% of specialty time) gastroenterology codes driving the high compensation rate were colonoscopy and endoscopy procedures with intraservice compensation rates ranging from 0.100 (CPT, 45380) to 0.126 wRVUs/min (CPT, 45385). Conversely, the 3 highest-volume codes for hand surgery were therapeutic exercises (CPT, 97110; 0.024 wRVUs/min), carpal tunnel surgery (CPT, 64721; 0.024 wRVUs/min), and repair of wrist joints (CPT, 25447; 0.058 wRVUs/min).
Sensitivity Analyses
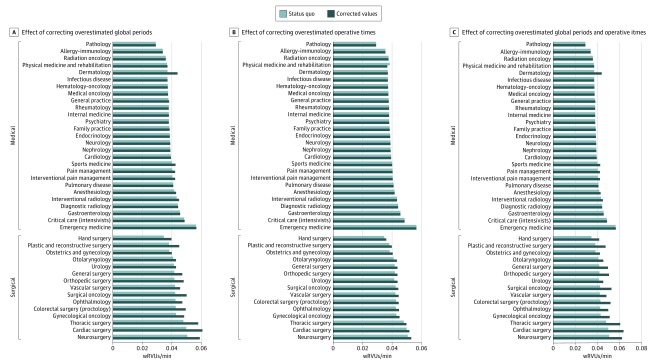
Accounting for overestimated time in bundled postoperative EM visits led to a mean (SD) increase in compensation rates of 5.8% (7.2%) across all specialties (Figure 5A). However, this disproportionately increased compensation for surgical (mean [SD], 13.2% [5.9%]) compared with medical disciplines (mean [SD], 1.7% [3.8%]; P < .001). Mean compensation rates for surgical specialties were 19.7% higher than medical specialties in this scenario (mean [SD] wRVUs for surgical, 0.048 [0.007]; mean [SD] wRVUs for medical, 0.040 [0.005]; P < .001). The association varied among surgical specialties, increasing urology compensation rates by 3.5% but increasing thoracic and cardiac surgery by 21.0% and 22.0%, respectively.
Figure 5. Results of Correcting Time Errors on Compensation Rates.
When global periods are corrected, it is assumed that no time is expended for 10-day global periods and 50% of time is expended for 90-day global periods (A and C). When intraoperative times are corrected, it is assumed that operative times are overestimated by 10% (B and C).
Accounting for overestimated intraoperative times lead to a mean (SD) increase in compensation for surgical specialties of 2.7% (0.6%). Mean compensation rates for surgical specialties were 10.1% higher in this scenario than medical specialties (surgical: mean [SD], 0.044 [0.004]; medical: mean [SD], 0.398 [0.005]; P = .01; Figure 5B).
Accounting for overestimates for bundled postoperative EM visits and intraoperative times lead to a mean (SD) increase in compensation rates of 7.0% (8.7%) across all specialties (Figure 5C), with mean (SD) increases of 16.8% (6.3%) for surgical specialties and 1.7% (3.8%) for medical specialties. In this scenario, mean compensation rates for surgical specialties were 23.4% higher than medical specialties (surgical: mean [SD], 0.050 [0.007]; medicine: mean [SD], 0.040 [0.005]; P < .001).
Discussion
Assuming the underlying time values incorporated into wRVU valuations are accurate, there is a relatively narrow range of compensation rates across specialties. The highest (emergency medicine) and lowest (pathology) specialties varied by less than 2-fold and surgical specialties had only 7.2% higher compensation rates than medical specialties. In large part this reflects the fact that most physician time is dedicated to the pre- and postservice periods, work which is compensated at relatively low rates according to the RVU system. This leaves only a small proportion of physician time dedicated to highly compensated activities that would allow a specialty to increase their overall average.
A key to our analysis was accounting for the diversity and volume of services provided by an entire specialty. To our knowledge, previous analyses comparing specialties have not done this. For example, an analysis comparing office visits to colonoscopy and cataract extraction concluded that Medicare reimbursed physicians 3 to 5 times more for procedural than cognitive care.8 While it is true that the compensation rate for the intraservice time of an office visit (99214) is 0.047 wRVUs/min compared with 0.100 for a screening colonoscopy (G0121) or 0.210 for cataract surgery (66984), gastroenterologists and ophthalmologists have only 0.7% and 2.4% of their time, respectively, allocated to performing those procedures. Further, these high-compensation periods must be counterbalanced with time spent on very poorly compensated activities. A feature of the wRVU system that effectively penalizes proceduralists is the very low compensation rate (0.0081 wRVUs/min) assigned to preoperative scrub and wait time. For context, this is less than one-third the value of the lowest EM code. General surgeons have 2.7% of their time dedicated to scrub and wait time compared with 0.1% for internists.
The other major finding of this study is associated with errors in time valuations. There is growing evidence that the number of postoperative visits bundled into global periods is grossly inaccurate, such that in 2015, CMS proposed setting the global period for all surgical procedures to 0 days and requiring surgeons to bill for postoperative care sperately.20,21 In our analysis, even if we assume surgeons are getting paid for performing no postoperative work for procedures with 10-day global periods and only half of the reported work for procedures with 90-day global periods, compensation rates for surgeons are still only marginally higher than medical specialties. This suggests that even major policy changes associated with global periods may only have a small association with disparities in physician compensation. The effect of errors in surgical time had an even smaller association with overall compensation rates, reflecting the small fraction of time surgeons spend on these tasks.
Limitations
This study has several limitations. The most important is the reliance on time measures provided by CMS, which may be inaccurate. In particular, they may be overestimated for surgical procedures, which may be biasing our compensation rates down. This prompted us to run multiple sensitivity analyses as outlined previously. It is possible that there are errors in other time estimates, such as pre- and immediate postoperative care, but we are aware of no literature in this area. Further, most of the literature to date has focused on inaccuracies in surgical time values, with less effort focused on inaccuracies incorporated into valuations used by medical clinicians. Second, this analysis only provides information on compensation rates built into the RVU system for an entire specialty over the span of a year; the rates for individual physicians will vary around these estimates. If one surgeon takes 2 hours to perform a procedure, his or her individual compensation rate will be higher than that of a surgeon who takes 4 hours. It is also possible that some physicians are not completely honest with their billing practices, which may lead to individual increases in compensation rate. While steps should be taken to remedy these inequities, it is unclear if this can or should be under the purview of the RUC. Third, we only provide data on 1 payer, Medicare; it is possible our results may have been different with a more diverse payer mix, especially if highly compensated activities are more commonly performed for younger populations. Fourth, we do not address the myriad other factors that will affect physician compensation, such as uncompensated care, upcoding, payer mix, work hours, and compensation outside of the RVU system (eg, consulting, research).1,2 Finally, we cannot comment on whether the differences identified are appropriate; there likely should be differences in compensation rates across specialties reflecting years of training (opportunity cost), mental stress, technical ability, and other factors.
The range of compensation rates built into current wRVU valuations is much smaller than previous analyses have suggested. Even accounting for inaccuracies in time valuations for surgical procedures, the difference in compensation rates across medical and surgical specialties is modest. Improving the accuracy of RVU valuations by incorporating objective data into the process is certainly a worthwhile pursuit, but this analysis suggests that factors outside of RVU valuation, such as payer mix and work hours, could be more pressing targets if narrowing the difference in compensation across specialties is desired.
eAppendix 1. Adjustments to the PSPS to account for duplicate records
eAppendix 2. Strengthening the Reporting of Observationals Studies in Epidemiology
References
- 1.Urban Institute . Analysis of disparities in physician compensation. Accessed May 3, 2019. http://www.medpac.gov/-research-areas-/physicians-and-other-health-professionals
- 2.Bodenheimer T, Berenson RA, Rudolf P. The primary care-specialty income gap: why it matters. Ann Intern Med. 2007;146(4):301-306. doi: 10.7326/0003-4819-146-4-200702200-00011 [DOI] [PubMed] [Google Scholar]
- 3.Bylsma WH, Arnold GK, Fortna GS, Lipner RS. Where have all the general internists gone? J Gen Intern Med. 2010;25(10):1020-1023. doi: 10.1007/s11606-010-1349-2 [DOI] [PMC free article] [PubMed] [Google Scholar]
- 4.Kumetz EA, Goodson JD. The undervaluation of evaluation and management professional services: the lasting impact of current procedural terminology code deficiencies on physician payment. Chest. 2013;144(3):740-745. doi: 10.1378/chest.13-0381 [DOI] [PubMed] [Google Scholar]
- 5.Landon BE. A step toward protecting payments for primary care. N Engl J Med. 2019;380(6):507-510. doi: 10.1056/NEJMp1810848 [DOI] [PMC free article] [PubMed] [Google Scholar]
- 6.Goodson JD. Unintended consequences of resource-based relative value scale reimbursement. JAMA. 2007;298(19):2308-2310. doi: 10.1001/jama.298.19.2308 [DOI] [PubMed] [Google Scholar]
- 7.Kerber KA, Raphaelson M, Barkley GL, Burke JF. Is physician work in procedure and test codes more highly valued than that in evaluation and management codes? Ann Surg. 2015;262(2):267-272. doi: 10.1097/SLA.0000000000000990 [DOI] [PubMed] [Google Scholar]
- 8.Sinsky CA, Dugdale DC. Medicare payment for cognitive vs procedural care: minding the gap. JAMA Intern Med. 2013;173(18):1733-1737. doi: 10.1001/jamainternmed.2013.9257 [DOI] [PubMed] [Google Scholar]
- 9.Hsiao WC, Braun P, Yntema D, Becker ER. Estimating physicians’ work for a resource-based relative-value scale. N Engl J Med. 1988;319(13):835-841. doi: 10.1056/NEJM198809293191305 [DOI] [PubMed] [Google Scholar]
- 10.Wynn BO, Burgette LF, Mulcahy AW, et al. Development of a model for the validation of work relative value units for the Medicare physician fee schedule. Rand Health Q. 2015;5(1):5. [PMC free article] [PubMed] [Google Scholar]
- 11.Jencks SF, Dobson A. Strategies for reforming Medicare’s physician payments: physician diagnosis-related groups and other approaches. N Engl J Med. 1985;312(23):1492-1499. doi: 10.1056/NEJM198506063122306 [DOI] [PubMed] [Google Scholar]
- 12.Laugesen MJ, Wada R, Chen EM. In setting doctors’ Medicare fees, CMS almost always accepts the relative value update panel’s advice on work values. Health Aff (Millwood). 2012;31(5):965-972. doi: 10.1377/hlthaff.2011.0557 [DOI] [PMC free article] [PubMed] [Google Scholar]
- 13.Centers for Medicare & Medicaid Services . Details for title: CMS-1654-F. Accessed May 1, 2019. https://www.cms.gov/medicare/medicare-fee-for-service-payment/physicianfeesched/pfs-federal-regulation-notices-items/cms-1654-f.html
- 14.Centers for Medicare & Medicaid Services . Physician/supplier procedure summary. Accessed May 1, 2019. https://www.cms.gov/Research-Statistics-Data-and-Systems/Statistics-Trends-and-Reports/Physician-Supplier-Procedure-Summary/index.html
- 15.Centers for Medicare & Medicaid Services . Crosswalk Medicare providers/supplier to healthcare provider taxonomy. Accessed May 3, 2019. https://data.cms.gov/Medicare-Enrollment/CROSSWALK-MEDICARE-PROVIDER-SUPPLIER-to-HEALTHCARE/j75i-rw8y
- 16.von Elm E, Altman DG, Egger M, Pocock SJ, Gøtzsche PC, Vandenbroucke JP; STROBE Initiative . The Strengthening the Reporting of Observational Studies in Epidemiology (STROBE) statement: guidelines for reporting observational studies. Lancet. 2007;370(9596):1453-1457. doi: 10.1016/S0140-6736(07)61602-X [DOI] [PubMed] [Google Scholar]
- 17.Burgette LF, Mulcahy AW, Mehrotra A, Ruder T, Wynn BO. Estimating surgical procedure times using anesthesia billing data and operating room records. Health Serv Res. 2017;52(1):74-92. doi: 10.1111/1475-6773.12474 [DOI] [PMC free article] [PubMed] [Google Scholar]
- 18.McCall N, Cromwell J, Braun P. Validation of physician survey estimates of surgical time using operating room logs. Med Care Res Rev. 2006;63(6):764-777. doi: 10.1177/1077558706293635 [DOI] [PubMed] [Google Scholar]
- 19.Chan DC, Huynh J, Studdert DM. Accuracy of valuations of surgical procedures in the Medicare fee schedule. N Engl J Med. 2019;380(16):1546-1554. doi: 10.1056/NEJMsa1807379 [DOI] [PMC free article] [PubMed] [Google Scholar]
- 20.Mehrotra A. Developing codes to capture post-operative care. Accessed May 3, 2019. http://www.jstor.org/stable/10.7249/j.ctt1d9np2r [PMC free article] [PubMed]
- 21.Medicare Payment Advisory Commission . Report to the Congress: Medicare and the health care delivery system. Accessed May 3, 2019. http://medpac.gov/docs/default-source/reports/jun18_medpacreporttocongress_sec.pdf
Associated Data
This section collects any data citations, data availability statements, or supplementary materials included in this article.
Supplementary Materials
eAppendix 1. Adjustments to the PSPS to account for duplicate records
eAppendix 2. Strengthening the Reporting of Observationals Studies in Epidemiology


