

Abstract
Objective:
We compared the prevalence of gestational diabetes and hypertensive disorders in the most recent pregnancy among women of Russian, Somali, and Kurdish origin and women in the general population in Finland.
Methods:
The study groups were selected from population-based samples of 18- to 64-year-old women. The women were of Russian (n = 318), Somali (n = 583), and Kurdish (n = 373) origin or from the general population (n = 243), and had given birth in Finland between 2004 and 2014. The data were obtained from the National Medical Birth Register and the Hospital Discharge Register. Data on gestational diabetes and hypertensive disorders were extracted based on relevant International Classification of Diseases, Tenth Revision codes. The main statistical methods were logistic regression analyses adjusted for age, parity, body mass index, socioeconomic status, and smoking.
Results:
The prevalence of gestational diabetes was 19.1% in Kurdish, 14.4% in Somali, 9.3% in Russian, and 11.8% in the general population. The prevalence of hypertensive disorders was 5.4% in the general population, 3.8% in Somali, 3.1% in Kurdish, and 1.7% in Russian. When adjusted for confounders, Kurdish women had two-fold odds for gestational diabetes (odds ratio = 1.98; 95% confidence interval = 1.20–3.32) compared with the general population, but the odds for hypertensive disorders did not differ between groups.
Conclusion:
Women of Kurdish origin were more likely to develop gestational diabetes. Studies with larger samples are required to confirm these findings to develop prevention strategies for later development of type 2 diabetes. Future research including other migrant groups is recommended to identify differences in pregnancy complications among the women in migrant and general population.
Keywords: Finland, gestational diabetes, hypertensive disorders, migrants, pregnancy, pregnancy complications
Background
Gestational diabetes mellitus (GDM) is a common complication of pregnancy, affecting 1%–14% of all pregnancies globally.1 GDM represents a failure to maintain normal glucose tolerance during the extreme metabolic stress of pregnancy. Women with GDM have an increased risk of developing hypertensive disorders during pregnancy and type 2 diabetes mellitus after pregnancy. Their offspring are often macrosomic and are prone to obesity and type 2 diabetes later in life.2–5 Hypertensive disorders, especially gestational hypertension (GHTN) and preeclampsia (PE), are other common complications in pregnancy. Globally, approximately 10% of all pregnant women have their blood pressure recorded above normal at some point in pregnancy and before delivery.6 PE and eclampsia account for almost 15% of all maternal deaths worldwide.7,8 Women who had PE are at increased risk of chronic hypertension, ischemic heart disease, cerebrovascular disease, atherosclerosis, kidney disease, diabetes mellitus, thromboembolism, hypothyroidism, and even impaired memory later in life.9,10
A few studies have reported the general prevalence of gestational diabetes and hypertensive disorders in the European countries.11–13 However, limited information is available on pregnancy complications in women of migrant origin in the European countries.14–16 This would be important since studies in non-pregnant populations suggest that many migrant groups have higher prevalence of type 2 diabetes or hypertension compared with the general population.17,18 A previous systematic review and meta-analysis including 24 studies mainly from Australia, United States, and Europe showed that, in general, migrant women were more likely to have GDM compared with women in the receiving (general) population. Similarly, women in some migrant groups (e.g. Caribbean, African, European, and Northern European) were at greater risk of GDM, while some had risks similar (e.g. North African and North Americans) to women in the general population.19 A recent review on pregnancy-related hypertensive disorders and immigrant status mainly based on studies from European countries and the United States reported that immigrant women had lower risk for hypertensive disorders compared to the women in the general population.20 None of these reviews included any studies from Finland. Some explanations for the higher risk of pregnancy complications among migrants have been proposed, such as alteration in the normal lifestyle factors such as diet and physical activity, rapid weight gain, and higher stress level after migration to high income countries.21–23 In addition, migration status, length of stay in the receiving country, and language skills are important determinants of pregnancy complications among migrant women. These factors are related to the access to the information and healthcare services.19,24
There are no data on these specific complications among any group of migrant women living in Finland. Russians, Somali, and Kurdish migrant are among the main migrant groups in Finland.25 GDM and hypertensive disorders complicate many pregnancies, and it is important to identify the risk groups for these complications to mitigate the complications. In this study, we compared the prevalence of GDM and hypertensive disorders among women of Russian, Somali, and Kurdish origin and women in the general Finnish population.
Methods
Selection of the study population
The study included the sample of women from the Migrant Health and Wellbeing Study (Maamu) and the Health 2011 survey. The National Institute of Health and Welfare (THL) conducted Maamu study in the cities of Helsinki, Espoo, Vantaa, Turku, Tampere, and Vaasa during 2010–2012. The study population was selected according to criteria of age (18–64 years), country of birth, and native language and length of stay, representing those of Russian, Somali, and Kurdish origin, and those who had lived in Finland at least 1 year.26 The study groups were selected to represent major migrant groups from different geographical areas.25 Russian-origin migrants were the largest migrant group in Finland. Somali-origin migrants were the fourth-largest migrant group and the largest migrant group with refugee background and of Muslim faith. Kurdish-speaking migrants were the sixth-largest migrant group. These Iraqi and Iranian refugees have been among the largest groups of quota refugees accepted to Finland in the recent years. The study was conducted in six cities with a higher proportion of migrants than in most other Finnish cities. A total sample of 5909 people, about 2000 from each study group (Russian, Somali, and Kurdish origin), were selected from the national population register for the register-based study. To compare the migrant women with the general population, the Health 2011 sample (N = 2275) from the same six cities was used as the reference group. The Health 2011 survey collected information on the health and well-being of the general Finnish population.27 Detailed information on the selection of the study population is described in the flow chart (Figure 1). Women who had given birth between 1 January 2004 and 31 December 2014 (n = 1518) were included in this study.
Figure 1.
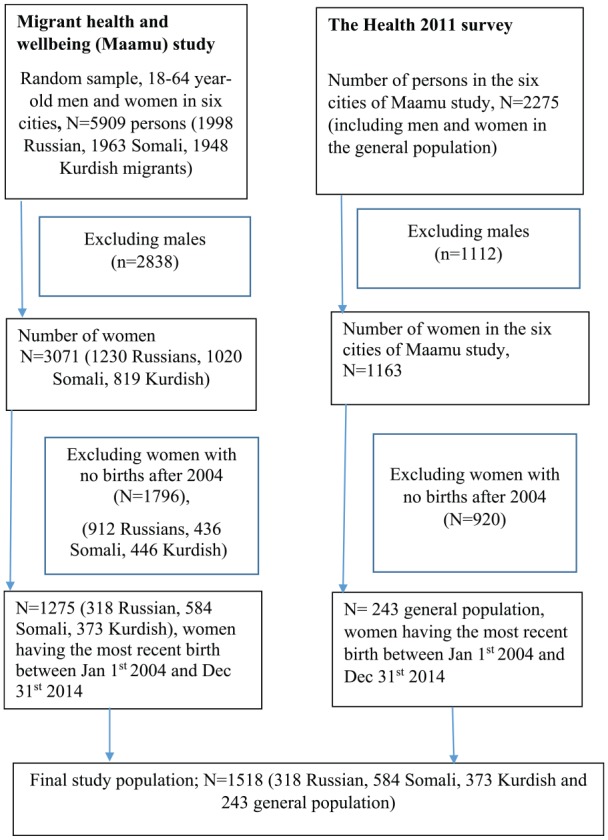
Flowchart of the study population.
Data source
Data from the Medical Birth Register and the Hospital Discharge Register were linked with the personal identification numbers of each woman in the study samples. The Medical Birth Register includes information on mothers’ sociodemographic background, smoking status, pre-pregnancy height, weight, visits to health care, and interventions during pregnancies and deliveries. The Hospital Discharge Register includes information on all inpatient and outpatient hospital care, with diagnoses recorded as International Classification of Diseases, Tenth Revision (ICD-10) codes.28 For women who had more than one delivery during the time period, we included data only on their latest pregnancy between 1 January 2004 and 31 December 2014 in the present study. The data on socioeconomic status for the year 2011 were obtained from Statistics Finland.
Ethical approval
We obtained permission to use the data from the respective registries from the THL. The THL obtained ethical approval for Maamu and Health 2011 studies, including the use of register data from the Coordinating Ethical Committee of the Helsinki and Uusimaa Hospital Region. According to the Finnish legislation and guidelines for register-based research, no informed consent was needed from the participants as we used register data only.
Outcomes
In Finland, the diagnostic criteria for GDM slightly changed in 2008. Before 2008, GDM diagnosis was made if at least one of the following plasma glucose levels was observed in the 75-g oral glucose tolerance test: fasting value ⩾5.1 mmol/L, 1 h value ⩾10.0 mmol/L, or 2 h value ⩾8.6 mmol/L.12 The oral glucose tolerance test was recommended at gestational weeks 24–28 for pregnant women with a pre-pregnancy body mass index (BMI) ⩾25 kg/m2, presence of glycosuria, age >40 years, fetal macrosomia in current or previous pregnancy, GDM in previous pregnancy, or a first-degree family history of diabetes.12 Since 2008, GDM has been diagnosed when with fasting plasma glucose value ⩾5.3 mmol/L, the 1 h value ⩾10.0 mmol/L, or the 2 h value ⩾8.6 mmol/l.24 The oral glucose tolerance test is recommended for all pregnant women, except those at low risk (nulliparous women <25 years old with normal BMI and no family history of type 2 diabetes, and parous women <40 years old with normal BMI and no GDM or macrosomic child in a previous pregnancy).29 GHTN is diagnosed if the systolic blood pressure of ⩾140 mm Hg or the diastolic blood pressure of ⩾90 mm Hg is identified after 20 weeks’ gestation for the first time. PE is diagnosed if the presence of high blood pressure is accompanied by 24-hr proteinuria ⩾0.3 g after 20 weeks’ gestation.6 The information on GDM, GHTN, and PE were extracted from the registers using the ICD-10 codes. For GDM, we included ICD-10 codes O24.4, O24.9 (maternal), P08.0, or P08.1 (newborn); for GHTN, O13 or O16 (maternal); and for PE, O14.0, O14.1, or O14.9 (maternal). For each woman, up to 20 maternal diagnoses and 10 newborn diagnoses were recorded in the Medical Birth Register. All the ICD-10 codes were compiled together for each specific complication and finally categorized as yes/no. Due to the smaller number of women with GHTN and PE, the variables were combined, and hypertensive disorders are used to refer to them in the text.
Exposures
Migrant groups were classified into three categories: Russian-, Somali-, and Kurdish-origin women. Women in the general population were used as the reference category. Age at latest birth was classified as 17–24, 25–34, and ⩾35 years. Marital status was classified as married/cohabiting/partnered and single. We classified socioeconomic position into five categories: upper-level employees (administrative, managerial, professional, and related occupations), lower-level employees (administrative and clerical occupations), manual workers, others (including pensioners/homemakers/students), and unknown. Smoking during pregnancy was classified as yes/no and previous births as 0, 1, and 2 or more. BMI was calculated as maternal pre-pregnancy weight (kg) divided by height squared (m2), and categorized as underweight (<18.5 kg/m2), normal weight (18.5–24.9 kg/m2), overweight (25–29.9 kg/m2), and obese (⩾30 kg/m2). Pre-pregnancy weight and height are usually self-reported at the first antenatal visit to the maternity clinic, and the information is recorded in the Medical Birth Register.
Statistical analyses
All statistical analyses were performed with Stata version 14 (Stata Corp LP, College Station, TX, USA). The inverse sampling probability weights were applied to the stratified sampling method, and finite populations were accounted for in all analyses to correct for the effect of differential sampling probabilities.26,30 Descriptive data were reported as numbers of observations and prevalence (%). Chi-square tests were used to compare the crude percentages. We used logistic regression models to test differences in pregnancy complications using women in the general population as the reference group. Age and BMI were used as continuous variables, whereas socioeconomic status was categorized as upper and lower white-collar workers, manual workers, and unemployed/unknown for the regression models. Model I was adjusted for age at latest birth. Model II was adjusted for age at latest birth, BMI, socioeconomic status, and parity. Odds ratios (ORs) with their 95% confidence intervals (CIs) were reported for the regression models.
Results
Overall, most of the recent births occurred in 25–34 years age group. A majority of women (88%–97%) in all the study groups were married/cohabiting or in a registered partnership. A higher percentage of all migrant-origin women had a lower socioeconomic status and were multiparous than of women in the general population (the reference group) (Table 1). Higher percentages of Somali- and Kurdish-origin women were overweight and obese compared to the reference group. The prevalence of smoking during pregnancy was higher in women in the reference group compared with the other study groups.
Table 1.
Characteristics of the study population at the time of the most recent pregnancy by study groups, all singleton births, 2004–2014 (weighted percentages).
| General population (n = 243) | Russian (n = 318) | Somali (n = 584) | Kurdish (n = 373) | |
|---|---|---|---|---|
| Age, years | ||||
| 18–24 | 10.5 | 11.6 | 17.6 | 16.1 |
| 25–34 | 62.2 | 62.5 | 50.8 | 62.0 |
| 35 or more | 27.2 | 25.8 | 31.4 | 27.2 |
| Marital status | ||||
| Married/cohabiting/partnership | 88.0 | 86.9 | 89.0 | 97.5 |
| Single | 12.0 | 13.1 | 11.0 | 2.5 |
| Socioeconomic status | ||||
| Upper white-collar workers | 25.8 | 14.3 | 2.7 | 2.8 |
| Lower white-collar workers | 37.5 | 26.7 | 15.0 | 14.3 |
| Manual workers | 17.2 | 15.9 | 9.1 | 18.2 |
| Others | 11.6 | 31.9 | 39.3 | 47.2 |
| Unknown | 7.7 | 11.0 | 33.7 | 17.2 |
| Smoking during pregnancy | ||||
| No | 81.5 | 86.0 | 98.0 | 95.1 |
| Yes | 18.4 | 13.9 | 2.0 | 4.4 |
| Previous births | ||||
| 0 | 40.7 | 37.8 | 9.4 | 23.7 |
| 1 | 37.3 | 43.4 | 18.2 | 36.7 |
| 2 or more | 22.0 | 18.6 | 72.3 | 39.4 |
| Body mass index, kg/m2 | ||||
| Underweight | 5.8 | 11.1 | 4.5 | 1.5 |
| Normal weight | 64.5 | 71.5 | 32.2 | 44.7 |
| Overweight | 19.1 | 12.6 | 36.0 | 37.1 |
| Obese | 10.4 | 4.6 | 27.3 | 16.5 |
Missing values for smoking during pregnancy in each category from the left to the right were 3.4%, 2.2%, 2.9%, and 1.6% respectively.
Missing values for pre-pregnancy body mass index in each category from the left to the right were 5.1%, 10.4%, 5.9%, and 8.1% respectively; missing values for all other variables were <1% in each category.
The prevalence of GDM was higher in Kurdish-origin women (19.4%) (Table 2) as compared with the reference group. No statistically significant differences were observed in the prevalence of GDM among Somalis and Russians as compared to the reference group. Similarly, the overall prevalence of hypertensive disorders was between 2% and 6%, being highest in the reference group. However, the difference between the groups was statistically insignificant. Among all women with hypertensive disorders (n = 54), almost 26% (n = 14) also had GDM.
Table 2.
Prevalence of pregnancy complications during the most recent pregnancy as compared with women in the general Finnish population (weighted percentages).
| General population, n = 243 | Russian, n = 318 | p valuea | Somali, n = 584 | p valuea | Kurdish, n = 373 | p valuea | |
|---|---|---|---|---|---|---|---|
| Gestational diabetes | |||||||
| Yes | 11.8 | 9.3 | 0.340 | 14.4 | 0.311 | 19.4 | 0.010 |
| No | 88.2 | 90.7 | 85.6 | 80.6 | |||
| Hypertensive disorders | |||||||
| Yes | 5.5 | 1.8 | 0.024 | 3.9 | 0.285 | 3.2 | 0.144 |
| No | 94.5 | 98.2 | 96.1 | 96.8 | |||
Pearson’s chi-square test.
The age-adjusted OR for GDM was significantly higher (OR = 1.98; 95% CI = 1.25–3.13) in Kurdish women compared with the reference group (Table 3). For every 1-year increase in age, there were 1.07 (95% CI = 1.04–1.09) increased odds for GDM. In the fully adjusted model, Kurdish-origin women still had almost doubled odds for GDM (OR = 1.98; 95% CI = 1.20–3.32) compared with the reference group. The OR for age and BMI was 1.06 (95% CI = 1.03–1.09) and 1.13 (95% CI = 1.10–1.17), respectively, whereas primiparous (OR = 0.56; 95% CI = 0.36–0.86) and multiparous (OR = 0.56; 95% CI = 0.35–0.90) women had lower odds for GDM compared with nulliparous women in the fully adjusted model.
Table 3.
Logistic regression model for having gestational diabetes in the most recent pregnancy, OR and 95% Confidence interval (CI).
| Model Ia
OR (CI) (N = 1518) |
p value | Model IIb
OR (CI) (N = 1416) |
p value | |
|---|---|---|---|---|
| Study groups | ||||
| General population | Reference | Reference | ||
| Russian | 0.79 (0.45–1.38) | 0.417 | 1.19 (0.66–2.14) | 0.553 |
| Somali | 1.27 (0.81–2.0) | 0.298 | 1.11 (0.64–1.92) | 0.706 |
| Kurdish | 1.98 (1.25–3.13) | 0.003 | 1.98 (1.20–3.32) | 0.009 |
| Age, years | 1.07 (1.04–1.09) | <0.001 | 1.06 (1.03–1.09) | <0.001 |
| Body mass index, kg/m2 | 1.13 (1.10–1.17) | <0.001 | ||
| Socioeconomic status | ||||
| Upper and lower white-collar workers | Reference | |||
| Manual workers | 1.03 (0.63–1.67) | 0.892 | ||
| Unemployed | 0.94 (0.65–1.35) | 0.760 | ||
| Previous births | ||||
| 0 | Reference | |||
| 1 | 0.56 (0.36–0.86) | 0.008 | ||
| 2 or more | 0.56 (0.35–0.90) | 0.018 | ||
OR = odds ratio; CI = confidence interval.
Model I is adjusted for age.
Model II is adjusted for age, body mass index, socioeconomic position, and number of previous births.
Table 4 presents the logistic regression model for having hypertensive disorders in the most recent pregnancy. In the age-adjusted model (Model I), Russian-origin women had lower OR (0.31; 95% CI = 0.10–0.90) for having hypertensive disorders, whereas it was statistically insignificant in the fully adjusted model (Model II). Somali and Kurdish women did not differ from the reference group for having hypertensive disorders in either Model. Multiparous women had lower OR (0.21; 95% CI = 0.10–0.47) for having hypertensive disorders than nulliparous women in the fully adjusted model. We also adjusted for smoking during the latest pregnancy (yes/no), and the results were essentially the same as in Model II (results not shown).
Table 4.
Logistic regression model for having hypertensive disorders in the most recent pregnancy, OR and 95% Confidence interval (CI).
| Model Ia
OR (CI) (N = 1416–1518) |
p value | Model IIb
OR (CI) (N = 1416) |
p value | |
|---|---|---|---|---|
| Study groups | ||||
| General population | Reference | Reference | ||
| Russian | 0.31 (0.10–0.90) | 0.033 | 0.42 (0.14–1.23) | 0.116 |
| Somali | 0.69 (0.35–1.35) | 0.288 | 1.25 (0.51–3.05) | 0.623 |
| Kurdish | 0.56 (0.26–1.22) | 0.150 | 0.64 (0.23–1.72) | 0.380 |
| Age, years | 0.99 (0.95–1.04) | 0.857 | 1.04 (0.99–1.09) | 0.094 |
| Body mass index, kg/m2 | 1.04 (0.99–1.10) | 0.071 | ||
| Socioeconomic status | ||||
| Upper and lower white-collar workers | Reference | |||
| Manual workers | 1.72 (0.68–4.39) | 0.250 | ||
| Unemployed | 1.64 (0.83–3.22) | 0.149 | ||
| Previous births | ||||
| 0 | Reference | |||
| 1 | 0.58 (0.28–1.19) | 0.141 | ||
| 2 or more | 0.21 (0.10–0.47) | <0.001 | ||
OR = odds ratio; CI = confidence interval.
Model I is adjusted for age.
Model II is adjusted for age, body mass index, socioeconomic position, and number of previous births.
Discussion
Women of Kurdish origin had significantly higher odds for having GDM compared to the reference group, whereas Somali and Russian women did not differ from the reference group for having GDM after adjusting for confounders. No differences between migrant groups and the general population were observed for hypertensive disorders when adjusted for confounders.
A previous review from Europe found that the prevalence of GDM ranged between 2% and 27% of all pregnancies in Europe, being lowest in the North Atlantic seaboard region and Nordic countries, excluding Finland, and highest in the South Mediterranean region, mostly in Italy, Spain, and Portugal.11 This huge difference is at least partly due to a lack of consistency in diagnostic criteria in European countries.11 The overall prevalence of GDM in Finland was 15.6% in 2017 according to data from the National Medical Birth Register.31 The prevalence of GDM was almost 12% among the general population in our study, which is slightly less than the national prevalence. This is because our data were slightly older (i.e. from 2004–2014).
A previous study using Maamu survey data found that physical inactivity was highest among non-pregnant Kurdish women.32 Likewise, a higher prevalence of metabolic syndrome was reported among Kurdish women through higher prevalence of elevated fasting glucose, low high-density lipoprotein (HDL) cholesterol level, elevated triglycerides, and higher abdominal obesity.32 Physical inactivity and unhealthy dietary habits play a role in the development of GDM and may explain the higher odds of GDM among Kurdish women in our study.
Older age and higher BMI are well-known risk factors for GDM.33,34 Likewise, our study also found that older age and pre-pregnancy overweight and obesity increased the odds for GDM. Despite having the highest general prevalence of overweight and obesity, and a statistically non-significantly higher prevalence of GDM in the unadjusted model (Tables 1 and 2), Somali women did not have a statistically significantly higher prevalence of GDM than women in the reference group, when adjusted for confounders. We observed that having at least one previous birth compared with none decreased the odds for GDM. We could not find any study reporting parity as an independent risk or protective factor for GDM.
We combined GHTN and PE due to the small number of cases in some study groups. A previous study showed that the general prevalence of hypertensive disorders is 4%–6% in Finland,34 which is similar to the findings from our study. A study in Norway using Medical Birth Registry data showed that the prevalence of PE in native Norwegian women was slightly higher (3.7%) than in any migrant-origin women (2.7%). Similarly, the prevalence of PE in Somali and Afghan/Iraqi women was 4.0% and 2.2%, respectively.15 The results are comparable to our findings. Mogos et al. 2016 published a review, which reported that migrant status is generally associated with lower risk of hypertensive disorders in pregnancy as compared to women in the general population.20 Similarly, previous studies from Sweden have reported a lower risk of hypertensive disorders in non-Nordic women relative to Nordic women.13,14 It was difficult to compare our findings to Mogos et al. 2016 and Swedish studies because they used very broad categories for the migrant groups. However, our study could not find any significant differences in hypertensive disorders between migrant-origin women and women in the general population after adjusting for confounders. Small sample size and few migrant groups could at least partly explain the divergence. It is known that the risk of PE is lower in multiparous women than in nulliparous women.35,36 Our findings support this, as being multiparous decreased the odds for hypertensive disorders compared with being nulliparous.
A recent meta-analysis studied the effects of diet and physical activity–based interventions in pregnancy on gestational weight gain and pregnancy outcomes. The study reported that the interventions had minor effects on prevention of GDM and hypertensive disorders during pregnancy.37 We need more information on dietary intake and physical activity in women of Somali and Kurdish origin. Nevertheless, healthy diet, physical activity, and weight management are recommended not only during pregnancy but for all people, especially for high-risk groups.
This study contributes to the limited information on pregnancy complications among migrant-origin women, not only in Finland but also elsewhere in Europe and in North America. Another strength of this study is the use of random population-based samples, including three major migrant groups in Finland. Finnish register-based data have good validity and reliability in general.38 Almost all deliveries in Finland take place in public hospitals, and data on maternal health, obstetric history, delivery events, and newborn outcomes for all births are recorded in the Medical Birth Register. The Hospital Discharge Register was used to complete the diagnoses in the Medical Birth Register.
Our study has also limitations. We cannot generalize these results to groups of migrant women beyond the three study groups. We used information on socioeconomic position derived from occupation and employment status, and this information was missing for many women of Somali and Kurdish origin. We could not use any variables on education, as this had even more missing information for all groups of migrant women. It is difficult to obtain the data on migrant women education completed outside Finland. Whenever possible, we recommend using better indicators of socioeconomic position, such as highest educational attainment and family income, for future studies. As we used only register data, we also did not have information on the diet, physical activity, length of stay in Finland, and language skills for the migrant population. The only indicator of health behavior in Medical Birth Register is smoking.
In conclusion, migrant women of Kurdish origin had two-fold odds for GDM compared with women in the general population, and therefore, they need special attention in maternity care and after pregnancy to prevent development of type 2 diabetes. The prevalence of hypertensive disorders did not differ significantly between the three migrant groups and women in the general population. Further research with larger samples and including other migrant groups is required to identify possible differences in pregnancy complications among migrant women and women in the general population as well as reasons for the differences.
Footnotes
Declaration of conflicting interests: The author(s) declared no potential conflicts of interest with respect to the research, authorship, and/or publication of this article.
Funding: The author(s) disclosed receipt of the following financial support for the research, authorship, and/or publication of this article: Authors like to acknowledge the Finnish Cultural Foundation (Grant No. 00180174) for partly funding this study.
ORCID iD: Kalpana Bastola  https://orcid.org/0000-0002-2922-2876
References
- 1. Kjos SL, Buchanan TA. Gestational diabetes mellitus. N Engl J Med 1999; 341(23): 1749–1756. [DOI] [PubMed] [Google Scholar]
- 2. Bener A, Saleh NM, Al-Hamaq A. Prevalence of gestational diabetes and associated maternal and neonatal complications in a fast-developing community: global comparisons. Int J Womens Health 2011; 3: 367–373. [DOI] [PMC free article] [PubMed] [Google Scholar]
- 3. Ma RC, Chan JC, Tam WH, et al. Gestational diabetes, maternal obesity, and the NCD burden. Clin Obstet Gynecol 2013; 56(3): 633–641. [DOI] [PubMed] [Google Scholar]
- 4. Buchanan TA, Xiang AH, Page KA. Gestational diabetes mellitus: risks and management during and after pregnancy. Nat Rev Endocrinol 2012; 8(11): 639–649. [DOI] [PMC free article] [PubMed] [Google Scholar]
- 5. Clausen TD, Mathiesen ER, Hansen T, et al. High prevalence of type 2 diabetes and pre-diabetes in adult offspring of women with gestational diabetes mellitus or type 1 diabetes: the role of intrauterine hyperglycemia. Diabetes Care 2008; 31(2): 340–346. [DOI] [PubMed] [Google Scholar]
- 6. Report of the national high blood pressure education program working group on high blood pressure in pregnancy. Am J Obstet Gynecol 2000; 183(1): S1–S22. [PubMed] [Google Scholar]
- 7. Duley L. The global impact of pre-eclampsia and eclampsia. Semin Perinatol 2009; 33(3): 130–137. [DOI] [PubMed] [Google Scholar]
- 8. Say L, Chou D, Gemmill A, et al. Global causes of maternal death: a WHO systematic analysis. Lancet Glob Health 2014; 2(6): e323–133. [DOI] [PubMed] [Google Scholar]
- 9. Haukkamaa L, Moilanen L, Kattainen A, et al. Pre-eclampsia is a risk factor of carotid artery atherosclerosis. Cerebrovasc Dis 2009; 27(6): 599–607. [DOI] [PubMed] [Google Scholar]
- 10. Williams D. Pre-eclampsia and long-term maternal health. Obstet Med 2012; 5(3): 98–104. [DOI] [PMC free article] [PubMed] [Google Scholar]
- 11. Buckley BS, Harreiter J, Damm P, et al. Gestational diabetes mellitus in Europe: prevalence, current screening practice and barriers to screening. Diabet Med 2012; 29(7): 844–854. [DOI] [PubMed] [Google Scholar]
- 12. Ellenberg A, Sarvilinna N, Gissler M, et al. New guidelines for screening, diagnosing, and treating gestational diabetes—evaluation of maternal and neonatal outcomes in Finland from 2006 to 2012. Acta Obstet Gynecol Scand 2017; 96(3): 372–381. [DOI] [PubMed] [Google Scholar]
- 13. Ros HS, Cnattingius S, Lipworth L. Comparison of risk factors for preeclampsia and gestational hypertension in a population-based cohort study. Am J Epidemiol 1998; 147(11): 1062–1070. [DOI] [PubMed] [Google Scholar]
- 14. Fadl HE, Ostlund IK, Hanson US. Outcomes of gestational diabetes in Sweden depending on country of birth. Acta Obstet Gynecol Scand 2012; 91(11): 1326–1330. [DOI] [PubMed] [Google Scholar]
- 15. Naimy Z, Grytten J, Monkerud L, et al. The prevalence of pre-eclampsia in migrant relative to native Norwegian women: a population-based study. BJOG 2015; 122(6): 859–865. [DOI] [PubMed] [Google Scholar]
- 16. Kosman MW, Eskes SA, van Selst J, et al. Perinatal outcomes in gestational diabetes in relation to ethnicity in the Netherlands. Neth J Med 2016; 74(1): 22–29. [PubMed] [Google Scholar]
- 17. Meeks KA, Freitas-Da-Silva D, Adeyemo A, et al. Disparities in type 2 diabetes prevalence among ethnic minority groups resident in Europe: a systematic review and meta-analysis. Intern Emerg Med 2016; 11(3): 327–340. [DOI] [PubMed] [Google Scholar]
- 18. Agyemang C, Bhopal R. Is the blood pressure of people from African origin adults in the UK higher or lower than that in European origin white people? A review of cross-sectional data. J Hum Hypertens 2003; 17(8): 523–534. [DOI] [PubMed] [Google Scholar]
- 19. Gagnon AJ, McDermott S, Rigol-Chachamovich J, et al. International migration and gestational diabetes mellitus: a systematic review of the literature and meta-analysis. Paediatr Perinat Epidemiol 2011; 25(6): 575–592. [DOI] [PubMed] [Google Scholar]
- 20. Mogos MF, Salinas-Miranda AA, Salemi JL, et al. Pregnancy-related hypertensive disorders and immigrant status. J Immigr Minor Health 2017; 19(6): 1488–1497. [DOI] [PubMed] [Google Scholar]
- 21. Goel MS, McCarthy EP, Phillips RS, et al. Obesity among US immigrant subgroups by duration of residence. JAMA 2004; 292(23): 2860–2867. [DOI] [PubMed] [Google Scholar]
- 22. Kumar BN, Meyer HE, Wandel M, et al. Ethnic differences in obesity among immigrants from developing countries, in Oslo, Norway. Int J Obes 2006; 30(4): 684–690. [DOI] [PubMed] [Google Scholar]
- 23. Hedderson MM, Darbinian JA, Ferrara A. Disparities in the risk of gestational diabetes by race-ethnicity and country of birth. Paediatr Perinat Epidemiol 2010; 24(5): 441–448. [DOI] [PMC free article] [PubMed] [Google Scholar]
- 24. Gagnon AJ, Zimbeck M, Zeitlin J. Migration and perinatal health surveillance: an international Delphi survey. Eur J Obstet Gynecol Reprod Biol 2010; 149(1): 37–43. [DOI] [PubMed] [Google Scholar]
- 25. Statistics Finland Population structure, http://www.tilastokeskus.fi/til/vaerak/2015/01/vaerak_2015_01_2016-09-23_tie_001_en.html
- 26. Castaneda AE, Rask S, Koponen P, et al. Migrant health and wellbeing. A study on persons of Russian, Somali and Kurdish origin in Finland [Maahanmuuttajien terveys ja hyvinvointi. Tutkimus venäläis-, somalialais- ja kurditaustaisista Suomessa]. Report 61/2012. Helsinki: National Institute for Health and Welfare (THL), 2012. [Google Scholar]
- 27. Lundqvist A, Mäki-Opas T. Health 2011 survey—methods (Report 8/2016). Helsinki: National Institute for Health and Welfare; (THL), 2016, pp. 219. [Google Scholar]
- 28. Medical Birth Register National Institute of Health Welfare, 2017, https://www.thl.fi/en/web/thlfi-en/statistics/information-on-statistics/register-descriptions/newborns
- 29. Gestational diabetes. Current care guidelines (in Finnish): Working group established by the Finnish Medical Society Duodecim, the medical advisory board of the Finnish Diabetes Association and the Finnish Gynecological Association. Duodecim 2013; 129: 1798–1799.24159712 [Google Scholar]
- 30. Härkänen T, Karvanen J, Tolonen H, et al. Systematic handling of missing data in complex study designs—experiences from the Health 2000 and 2011 Surveys. J Appl Stat 2016; 43: 2772–2790. [Google Scholar]
- 31. Heino A, Vuori E, Kiuru S, et al. Perinatal statistics: parturients, deliveries and newborns 2017. Statistical Report. Helsinki: National Institute of Health and Welfare, http://www.julkari.fi/bitstream/handle/10024/137072/Tr38_18.pdf?sequence=5&isAllowed=y [Google Scholar]
- 32. Skogberg N, Laatikainen T, Jula A, et al. Contribution of sociodemographic and lifestyle-related factors to the differences in metabolic syndrome among Russian, Somali and Kurdish migrants compared with Finns. Int J Cardiol 2017; 232: 63–69. [DOI] [PubMed] [Google Scholar]
- 33. Sebire NJ, Jolly M, Harris JP, et al. Maternal obesity and pregnancy outcome: a study of 287,213 pregnancies in London. Int J Obes Relat Metab Disord 2001; 25(8): 1175–1182. [DOI] [PubMed] [Google Scholar]
- 34. Metsala J, Stach-Lempinen B, Gissler M, et al. Risk of pregnancy complications in relation to maternal prepregnancy body mass index: population-based study from Finland 2006-10. Paediatr Perinat Epidemiol 2016; 30(1): 28–37. [DOI] [PubMed] [Google Scholar]
- 35. Zhang J, Zeisler J, Hatch MC, et al. Epidemiology of pregnancy-induced hypertension. Epidemiol Rev 1997; 19(2): 218–232. [DOI] [PubMed] [Google Scholar]
- 36. Uzan J, Carbonnel M, Piconne O, et al. Pre-eclampsia: pathophysiology, diagnosis, and management. Vasc Health Risk Manag 2011; 7: 467–474. [DOI] [PMC free article] [PubMed] [Google Scholar]
- 37. International Weight Management in Pregnancy (i-WIP) Collaborative Group. Effect of diet and physical activity based interventions in pregnancy on gestational weight gain and pregnancy outcomes: meta-analysis of individual participant data from randomised trials. BMJ 2017; 358: j3119. [DOI] [PMC free article] [PubMed] [Google Scholar]
- 38. Sund R. Quality of the Finnish hospital discharge register: a systematic review. Scand J Public Health 2012; 40(6): 505–515. [DOI] [PubMed] [Google Scholar]