Introduction
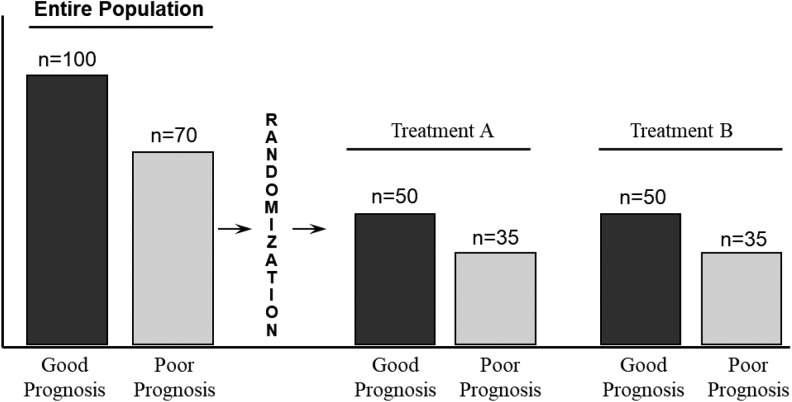
A randomized controlled trial (RCT) is the most rigorous study design to help determine cause and effect between a treatment and an outcome. It is regarded as such because proper random assignment greatly reduces or eliminates confounding from known and unknown prognostic factors—that is, it ensures prognostic balance between treatment and control groups at baseline (Figure 1). Analyses in RCTs often include intention-to-treat (ITT). In this article, we will describe what ITT analysis is, the rationale for its use, and an example to illustrate its effect.
Figure 1.
The effect of randomization on the distribution of prognostic factors between 2 treatment groups.
What Is Intention-to-Treat Analysis?
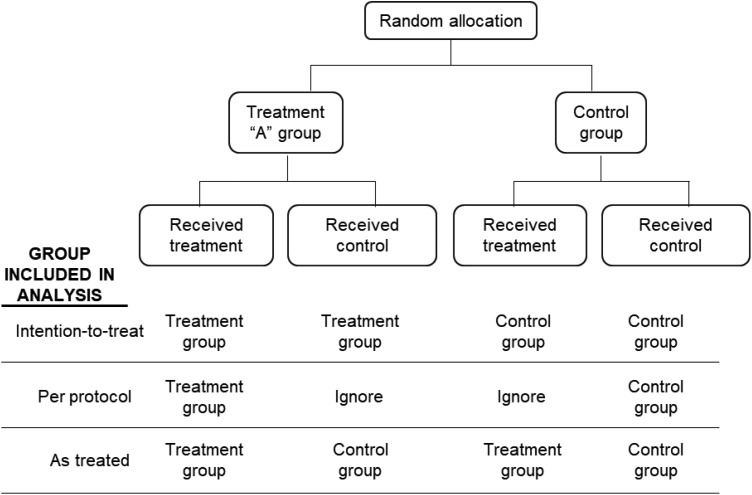
Intention-to-treat analysis analyzes all participants in the groups to which they were randomly assigned, ignoring in the analysis any study protocol violations (“as randomized, so analyzed”). Common examples of protocol violations include ineligibility (person who was enrolled but should not have been), noncompliance, wrong treatment, crossover from failed initial randomized treatment to the other arm, or no treatment. Other methods of analysis include per-protocol and as-treated. Per-protocol analysis analyzes only participants who complied with the original randomization scheme. Those who did not comply with the treatment or control protocol are simply dropped from the analysis. This kind of analysis answers the questions as to whether the treatment works among those that comply, but fails to provide an answer of the true treatment effect. It is advised that investigators provide both ITT and per-protocol analyses in randomized trials to aid readers in interpreting the results.1,2 The as-treated analysis analyzes participants according to the treatment they received regardless of the group to which they were assigned (Figure 2).
Figure 2.
Treatment and control groups included in the analysis comparing intention-to-treat, per-protocol, and as-treated analyses.
Why Is Intention-to-Treat Analysis Necessary?
At first blush, the idea of ITT appears counterintuitive. Why would individuals who were ultimately not part of the trial be included in the data? The short answer is that this method of analysis preserves the prognostic balance between groups achieved through randomization, and by doing so, minimizes any risk of bias that may be introduced by comparing groups that differ in prognostic variables. The problem arises because some of the reasons that result in nonadherence to the protocol may be related to prognosis itself. For example, there is some evidence that participants who adhere to an assigned treatment do better than those who do not adhere whether they receive the intervention or a placebo.3,4
Example Illustrating Intention-to-Treat Analysis
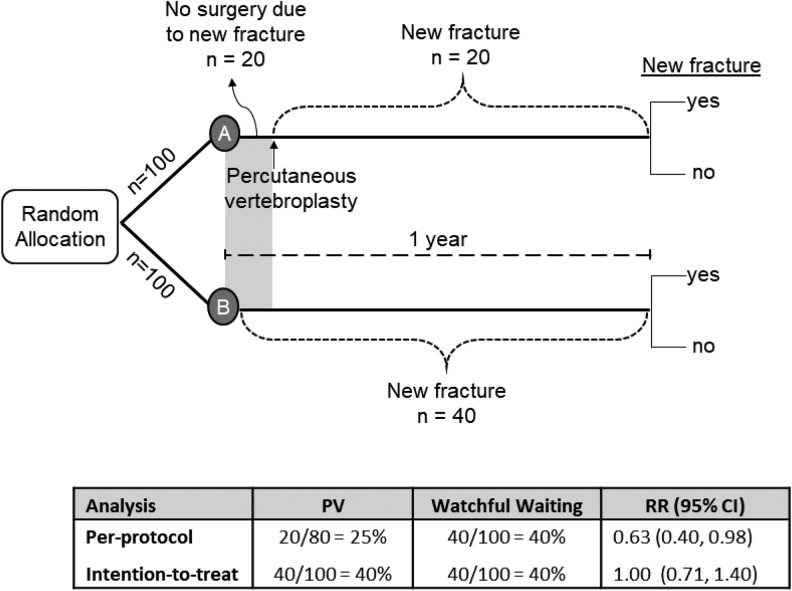
Imagine an investigator wants to know if percutaneous vertebroplasty (PV) for osteoporotic vertebral compression fractures (OVCFs) changes the risk of new OVCFs. And for the sake of this illustration, let us assume that PV has no effect on the risk of a new vertebral fracture. The investigator conducts an RCT enrolling 200 patients with an OVCF, half to receive PV and half to receive watchful waiting. The proportion of patients with one or more new OVCFs is the outcome of interest. In this example, those allocated to surgery have 3 to 4 weeks waiting time after randomization before the surgery can be performed. During that period, 20 individuals sustain a new fracture and, as a result, decide not to proceed with the surgery. During the same period, 20 individuals in the watchful waiting group also sustain a new fracture. During the follow-up period, 20 additional individuals sustain a new fracture in each group. At the end of the study, both groups had the same number of patients with a new fracture: 20 during the first few weeks, and then 20 more between week 4 and 1 year (Figure 3).
Figure 3.
Intention-to-treat and per-protocol analyses in a hypothetical randomized controlled trial.
If we analyze the data according to who actually received the intervention (per-protocol), we note that 80 patients received the surgery, and 20 decided not to have the surgery. The risk of new fracture in the 80 who had surgery is 25% (20/80). In the control group, all 100 patients received watchful waiting. Their risk is 40% (40/100), and the risk ratio was 0.63 (95% confidence interval = 0.40-0.98), a significant reduction in the risk of a new fracture with PV. In the per-protocol analysis, we would conclude that PV reduces the risk of new fracture in patients with OVCF.
In the ITT analysis, all patients are included in the analysis in the groups to which they were randomized, even those that did not receive their assigned treatment. In the PV group, all who sustained a new fracture, even those who did not receive the surgery, are included. Therefore, the ITT analysis reveals a risk of 40% in the PV group (40/100) compared with a risk of 40% in the control group (40/100). The risk ratio is 1.0 (95% confidence interval = 0.71-1.40). It is the ITT analysis that preserves the prognostic balance between groups and reaches the correct conclusion (Figure 3).
What About Missing Outcome Data?
In order to preserve the benefit of random allocation, not only should all be retained in the group to which they were allocated, but all randomized participants should be included in the analysis. Unfortunately, it is all too common for clinical trials to have at least some participants who are lost to follow-up or for other reasons have missing outcome data. Keeping participants that were nonadherent to the protocol such as those who received the wrong treatment or were noncompliant with the treatment in the group to which they were randomized will not minimize the biases that arise from missing outcome data. Missing data may introduce the same sort of bias as a per-protocol analysis. This is because those with missing outcome data tend to have poorer outcomes than those successfully followed to study completion.5 How data are to be handled when there are missing outcome data is beyond the scope of this article. However, readers should know that at a minimum, investigators should provide an explicit description of how missing data were addressed in a study.6
Summary
Investigators of RCTs should adhere to the ITT principle by analyzing study participants in the groups to which they were randomly assigned.
Doing so preserves the prognostic balance between groups achieved through randomization, and minimizes any risk of bias that may be introduced by comparing groups that differ in prognostic variables.
Per-protocol analysis analyzes only participants who complied with the original randomization scheme. The reasons that participants do not adhere to the study protocol may be related to prognosis, thereby introducing risk of bias using per-protocol analysis.
Unfortunately, randomized trials frequently have varying amounts of missing outcome data. Missing data may introduce the same sort of bias as a per-protocol analysis.
Footnotes
Declaration of Conflicting Interests: The author(s) declared no potential conflicts of interest with respect to the research, authorship, and/or publication of this article.
Funding: The author(s) disclosed receipt of the following financial support for the research, authorship, and/or publication of this article: Support for this work was provided by Spectrum Research, Inc, with funding from AO Spine.
References
- 1. Nagelkerke N, Fidler V, Bernsen R, Borgdorff M. Estimating treatment effects in randomized clinical trials in the presence of non-compliance. Stat Med. 2000;19:1849–1864. [DOI] [PubMed] [Google Scholar]
- 2. Sheiner LB, Rubin DB. Intention-to-treat analysis and the goals of clinical trials. Clin Pharmacol Ther. 1995;57:6–15. [DOI] [PubMed] [Google Scholar]
- 3. Coronary Drug Project Research Group. Influence of adherence to treatment and response of cholesterol on mortality in the coronary drug project. N Engl J Med. 1980;303:1038–1041. [DOI] [PubMed] [Google Scholar]
- 4. Horwitz RI, Viscoli CM, Berkman L, et al. Treatment adherence and risk of death after a myocardial infarction. Lancet. 1990;336:542–545. [DOI] [PubMed] [Google Scholar]
- 5. Ioannidis JP, Bassett R, Hughes MD, Volberding PA, Sacks HS, Lau J. Predictors and impact of patients lost to follow-up in a long-term randomized trial of immediate versus deferred antiretroviral treatment. J Acquir Immune Defic Syndr Hum Retrovirol. 1997;16:22–30. [DOI] [PubMed] [Google Scholar]
- 6. Moher D, Hopewell S, Schulz KF, et al. CONSORT 2010 Explanation and Elaboration: updated guidelines for reporting parallel group randomised trials. J Clin Epidemiol. 2010;63:e1–e37. [DOI] [PubMed] [Google Scholar]


