

Abstract
Background
The purpose of the research was to explore the extent of interaction between triglycerides (TG) and serum uric acid (SUA) level with blood pressure (BP) in middle-aged and elderly individuals in China.
Methods
Data were selected from the China Health and Retirement Longitudinal Study (CHARLS), a cross-sectional study. 3345(46.99%) men with average ages of 60.24 ± 9.24 years and 3774 (53.01%) women with average ages of 59.91 ± 9.95 years were included in the study. Differences between gender, or between categories of blood pressure levels were evaluated by t-test or chi-square test. The adjusted associations between various characteristics and BP status were first compared using linear regression models, as appropriate. Then, A general linear model adjusted for confounding factors (socio-demographic characteristics [age, educational levels, marital status, place of residence], health behaviors [cigarette smoking, alcohol drinking, eating habits, social and leisure activities, accidental injury, physical activities], medical history [history of cardiovascular diseases, hepatitis history, antidiabetic drugs, history of antilipidemic medication, anti-hypertensive therapy], metabolic measures [C-reactive protein (CRP), hemoglobin A1c (HbA1c), fasting plasma glucose (FPG), low-density lipoprotein cholesterol (LDL-C), high-density lipoprotein cholesterol (HDL-C), estimated glomerular filtration rate (eGFR), body mass index (BMI)]) was used to examine the synergistic effect of SUA and TG level on BP in middle-aged and elderly individuals in China.
Results
Age-adjusted partial Pearson’s correlation coefficient showed that SUA and TG level positively correlated with both systolic blood pressure (SBP) and diastolic blood pressure (DBP) in both men and women. Multiple linear regression analysis showed the TG level was significantly and positively associated with SBP and DBP in both men (SBP: β =0.068, P = 0.001; DBP: β =0.064, P = 0.002) and women (SBP: β =0.061, P = 0.002; DBP: β =0.084, P = 0.000), but SUA were significantly and positively associated with SBP in both men (SBP: β =0.047, P = 0.013) and women (SBP: β =0.040, P = 0.028), regardless of other confounding factors. After adjusting for related potential confounders, evidence of interaction between SUA and TG level on SBP (men: β = − 1.090, P = 0.726; women: β = − 0.692, P = 0.861) and DBP (men: β = − 1.026, P = 0.572; women: β = − 0.794, P = 0.842) was not observed.
Conclusion
The interaction effect of SUA and TG level on BP was not observed in our study. Moreover, high SUA level was significantly associated with SBP, while high TG level was strongly related to both DBP and SBP.
Keywords: Blood pressure, Middle-aged and elderly individuals, Serum uric acid, Triglycerides
Background
As well known, according to the relationship between prehypertension and cardiovascular diseases [1–3] and the etiologies of cardiovascular diseases (CVDs) [4–6], the hypertension is defined with the standards as follows: ①diastolic blood pressure (DBP) of > 90 mmHg; and/or ②systolic blood pressure (SBP) of > 140 mmHg. Hypertension is a cluster of risk factors [7–14] associated with ageing, central obesity, overweight, the household heredity factors, unhealthy behavior and lifestyles (cigarette smoking, alcohol consumption, and lack of physical activities), diabetes, dyslipidemia, low levels of high-density lipoprotein cholesterol (HDL-C), high levels of low-density lipoprotein cholesterol (LDL-C), elevated fasting glucose levels, and elevated triglycerides (TG). Hypertension is serious complex, and patients suffer from the physical, psychosocial, and economic burden, it has become serious public health worldwide [15]. Recently, the prevalence and incidence of hypertension remained higher up in China [16, 17]. For the ageing population increases, it is disproportionately high among middle-aged and elderly individuals in China [18–20]. Hypertension is a multi-factor caused disease. Recently, hypertension has become crucial for public health worldwide. In sum, hypertension prevention and treatment strategies, and its risks should be carefully studied. Exploring its timely associated risks and their interaction of hypertension may provide insight into public health implications for the prevention and management of hypertension in future.
Serum uric acid (SUA) is an endogenous end product and is involved in the production of reactive oxygen species. It is crucial to evaluate its status in advance of chronic disease development [21]. In recent years, as a critical mark, systemic measured by SUA has become an essential marker for chronic disease development. Studies have conducted that SUA is associated with various diseases, such as CVDs [22–25], prehypertension [26–29], metabolic syndrome [30–32], and hypertension [33–35]. However, despite the association between SUA level and these risk conditions, SUA level may not be regarded as an independent risk factor. Since SUA level is highly associated with overweight, obesity and other risk factors [36–38], which is in turn associated with risk of hypertension, a causal condition may exist between TG and risk of hypertension. Therefore, the association between SUA level and risk of hypertension and the effects of TG on this association are of considerable interest, and a modulating effect between TG and SUA level on blood pressure (BP) may also be fully considered.
To date, few studies on the association and interaction analysis between SUA and TG level and BP were conducted in individuals aged ≥45 years. Thus, this study aimed to determine the prevalence of normotension and hypertension and their association with SUA, TG level, and other confounding factors based on gender using the individuals aged ≥45 years from cross-sectional study data (CHARLS) in China.
Methods
Study design and setting
Data from the CHARLS were used in our study. The CHARLS was a nationally representative longitudinal study conducted by the China Centre for Economic Research at Peking University [39]. In the 2011 CHARLS Wave1, at baseline, 13107 individuals were recruited for a longitudinal study, 130 individuals were excluded because the absence of medication history, a group of 5737 participants did not have their metabolic measures, and 121 individuals did not have their blood pressure. Finally, 7119 individuals were included in the analyses. Figure 1 summarized the selection of participants.
Fig. 1.
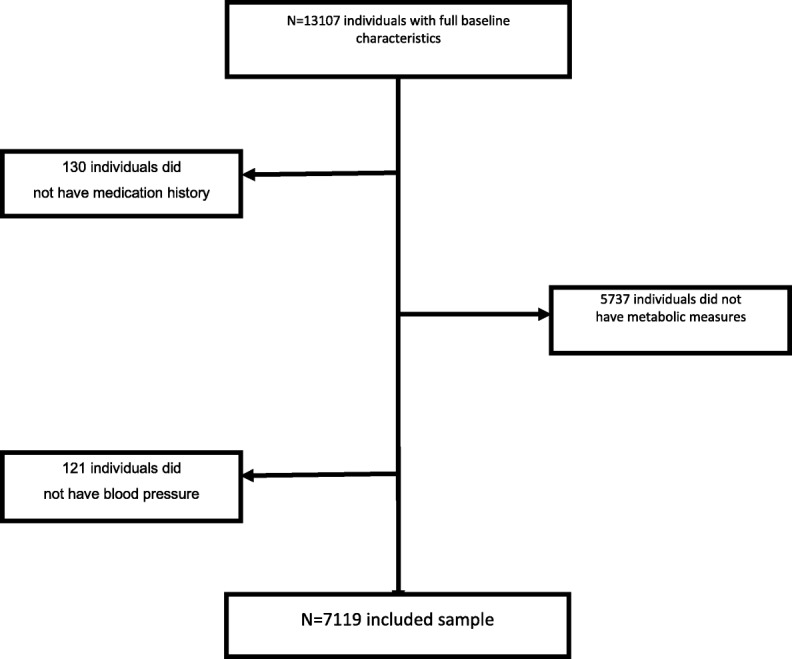
Selection of participants
Participants
The participants of the study were from the CHARLS, Wave 1 (2011) [39]. The CHARLS involved 7119 individuals ≥45 years old, out of whom 46.99% were 60.24 ± 9.24 years and 53.01% women were 59.91 ± 9.95 years.
Self-reported factors
Variables like age, educational levels (four categories, illiterate, less than elementary school, high school, and above vocational school), marital status (dichotomous variables, the single and married), place of residence (dichotomous variables, rural and urban), cigarette smoking (three categories, no, former smoke, and current smoke), alcohol consumption (three categories, no, less than once a month, and more than once a month), eating habit (three categories, ≤two meals per day, three meals per day, and ≥ four meals per day), social and leisure activities (dichotomous variables, no and yes), accidental injury (dichotomous variables, no and yes), physical exercise (three categories, no physical exercise, less than physical exercises, and regular physical exercises), history of liver disease (dichotomous variables, no and yes), history of cardiovascular diseases (dichotomous variables, no and yes), antidiabetic medication (dichotomous variables, no and yes), antilipidemic medication (dichotomous variables, no and yes), and antihypertensive medication (dichotomous variables, no and yes) were obtained using a self-reported questionnaire, and most variables based on our previous studies [40–44].
Measurements
BMI was calculated based on the measured weight and height of the participants [45]. CRP was measured using immunoturbidimetric assay. FPG, TG, LDL-C, HDL-C, and HbA1c were analyzed using the enzymatic colorimetric tests, SUA level were analyzed using the urinalysis (UA) plus method. The mean of the three measurements determined the average value of BP. Estimated glomerular filtration rate (eGFR) was measured by the chronic kidney disease epidemiology collaboration (CKD-EPI) creatinine-cystatin equations [46]. TG was divided into two categories: < 150 mg/dL and ≥ 150 mg/dL. Hyperuricemia (HUA) was defined as SUA concentration of > 7 mg/dL in men and > 6 mg/dL in women [47]. Participants were divided into hypertension (defined as SBP of ≥140 mmHg and/or DBP of ≥90 mmHg), and normotension (defined as not being on antihypertensive therapies with an SBP of < 140 mmHg and DBP of < 90 mmHg) groups, the categorization has been widely used in previous studies [41, 44].
Statistical analysis
Data were analyzed by using SPSS17.0 software for Windows10 (IBM Corp., Armonk, NY, USA) and expressed as the mean SD or frequency, as appropriate. Differences between gender, or between categories of blood pressure levels were evaluated by t-test or chi-square test. The adjusted associations between various characteristics and BP status were first compared using linear regression models, as appropriate. Then, general linear models adjusting for related potential confounders were used to examine the synergistic effect of SUA and TG level on blood pressure in middle-aged and elderly individuals in China. 2-tailed and a value of P of 0.05 were considered statistically significant.
Results
In total, 7119 participants who effectively completed the questionnaires were included in our research. The baseline of demographic variables was shown in Table 1, and most variables based on our previous studies [40–44]. Overall, 3345(46.99%) of the participants were men, and 3774 (53.01%) of the participants were women. The average ages of the men and women were 60.24 ± 9.24 and 59.91 ± 9.95 years, respectively. In the men, the mean and standard deviation of SUA level were 4.87 ± 1.24 mg/dl in the normotensive group, and 5.20 ± 1.33 mg/dl in the hypertensive group, respectively. In the men, the mean and standard deviation of TG level were 120.58 ± 100.65 mg/dl in the normotensive group, and 133.51 ± 111.81 mg/dl in the hypertensive group, respectively. In the women, the mean and standard deviation of SUA level were 3.93 ± 1.04 mg/dl in the normotensive group, and 4.24 ± 1.16 mg/dl in the hypertensive group, respectively. In the women, the mean and standard deviation of TG level were 129.26 ± 82.88 mg/dl in the normotensive group, and 154.49 ± 112.79 mg/dl, respectively. Table 1 showed the relationship between various characteristics and BP levels in the participants. Significant differences in distribution were observed between blood pressure status in the men in all of the variables, except cigarette smoking, alcohol consumption, eating habit, social and leisure activities, physical exercise, hepatitis history, anti-diabetic medication, and HDL-C. Age, CRP, HbA1c, FPG, LDL-C, BMI, TG, SUA, SBP, and DBP were significantly higher in hypertension than those in the normotension, whereas, eGFR level were lower in hypertension than that in the normotension. Significant differences in distribution were observed between blood pressure status in women in all of the variables, except the place of residence, cigarette smoking, eating habit, social and leisure activities, accidental injury, regular physical exercises, and hepatitis history. Age, CRP, HbA1c, FPG, LDL-C, BMI, TG, SBP, SUA, and DBP were significantly higher in hypertension than those in the normotension. However, HDL-C and eGFR level were lower in hypertension than that in the normotension.
Table 1.
Baseline of demographic variables of participants categorized by gender and blood pressure status in men and women(N = 7119)
| Variables | Men(n = 3345) | t/χ2 | P | Women (n = 3774) | t/χ2 | P | ||
|---|---|---|---|---|---|---|---|---|
| Normotension (n = 2267) |
Hypertension (n = 1078) | Normotension (n = 2492) |
Hypertension (n = 1282) |
|||||
| Age (years) | 60.5 ± 9.55 | 63.41 ± 9.53 | −8.231 | 0.000 | 58.07 ± 9.19 | 63.5 ± 10.39 | −16.433 | 0.000 |
| Educational levels | ||||||||
| Illiterate | 311 (65.20) | 166 (34.80) | 8.758 | 0.033 | 1025 (60.51) | 669 (39.49) | 45.920 | 0.000 |
| Less than elementary school | 1661 (67.91) | 785 (32.09) | 1267 (69.54) | 555 (30.46) | ||||
| High school | 197 (74.34) | 68 (25.66) | 142 (79.78) | 36 (20.22) | ||||
| Above vocational school | 98 (62.42) | 59 (37.58) | 58 (72.50) | 22 (27.50) | ||||
| Marital status | ||||||||
| Single | 194 (56.73) | 148 (43.27) | 21.288 | 0.000 | 345 (53.41) | 301 (46.59) | 55.387 | 0.000 |
| Married | 2073 (69.03) | 930 (30.97) | 2147 (68.64) | 981 (31.36) | ||||
| Place of residence | ||||||||
| Rural | 1553 (69.77) | 673 (30.23) | 12.108 | 0.001 | 1591 (66.60) | 798 (33.40) | 0.930 | 0.335 |
| Urban | 714 (63.81) | 405 (36.19) | 901 (65.05) | 484 (34.95) | ||||
| Cigarette smoking | ||||||||
| No | 1320 (68.18) | 616 (31.82) | 0.395 | 0.821 | 2292 (66.36) | 1162 (33.64) | 2.105 | 0.349 |
| Former smoke | 384 (66.90) | 190 (33.10) | 51 (60.71) | 33 (39.29) | ||||
| Current smoke | 563 (67.43) | 272 (32.57) | 149 (63.14) | 87 (36.86) | ||||
| Alcohol consumption | ||||||||
| No | 1026 (67.37) | 497 (32.63) | 0.686 | 0.710 | 2172 (65.44) | 1147 (34.56) | 6.263 | 0.044 |
| Less than once a month | 239 (69.68) | 104 (30.32) | 135 (74.18) | 47 (25.82) | ||||
| More than once a month | 1002 (67.75) | 477 (32.25) | 185 (67.77) | 88 (32.23) | ||||
| Eating habit | ||||||||
| ≤ 2 meals per day | 32 (66.67) | 16 (33.33) | 3.447 | 0.178 | 35 (67.31) | 17 (32.69) | 0.676 | 0.713 |
| 3 meals per day | 1945 (68.39) | 899 (31.61) | 2125 (66.26) | 1082 (33.74) | ||||
| ≥ 4 meals per day | 290 (64.02) | 163 (35.98) | 332 (64.47) | 183 (35.53) | ||||
| Social and leisure activities | ||||||||
| No | 1106 (67.27) | 538 (32.73) | 0.367 | 0.545 | 1250 (66.35) | 634 (33.65) | 0.169 | 0.681 |
| Yes | 1161 (68.25) | 540 (31.75) | 1242 (65.71) | 648 (34.29) | ||||
| Accidental injury | ||||||||
| No | 314 (73.02) | 116 (26.98) | 6.228 | 0.013 | 181 (70.7) | 75 (29.30) | 2.673 | 0.102 |
| Yes | 1953 (67.00) | 962 (33.00) | 2311 (65.69) | 1207 (34.31) | ||||
| Physical exercises | ||||||||
| No physical exercise | 435 (65.81) | 226 (34.19) | 1.471 | 0.479 | 1492 (64.73) | 813 (35.27) | 4.543 | 0.103 |
| Less than regular physical exercises | 417 (68.47) | 192 (31.53) | 483 (67.74) | 230 (32.26) | ||||
| Regular physical exercises | 1415 (68.19) | 660 (31.81) | 517 (68.39) | 239 (31.61) | ||||
| History of cardiovascular disease | ||||||||
| No | 2065 (68.97) | 929 (31.03) | 14.634 | 0.000 | 2187 (67.46) | 1055 (32.54) | 13.740 | 0.000 |
| Yes | 206 (58.69) | 145 (41.31) | 314 (59.02) | 218 (40.98) | ||||
| Hepatitis history | ||||||||
| No | 2170 (67.77) | 1032 (32.23) | 0.914 | 0.339 | 2413 (66.18) | 1233 (33.82) | 2.532 | 0.112 |
| Yes | 102 (71.33) | 41 (28.67) | 93 (72.66) | 35 (27.34) | ||||
| Antilipidemic therapy | ||||||||
| No | 2174 (68.13) | 1017 (31.87) | 4.029 | 0.045 | 2388 (67.14) | 1169 (32.86) | 33.645 | 0.000 |
| Yes | 93 (60.39) | 61 (39.61) | 104 (47.93) | 113 (52.07) | ||||
| Antidiabetic drugs | ||||||||
| No | 2195 (67.96) | 1035 (32.04) | 1.454 | 0.228 | 2395 (66.51) | 1206 (33.49) | 8.021 | 0.005 |
| Yes | 72 (62.61) | 43 (37.39) | 97 (56.07) | 76 (43.93) | ||||
| Anti-hypertensive therapy | ||||||||
| No | 2187 (69.49) | 960 (30.51) | 72.177 | 0.000 | 2386 (67.31) | 1159 (32.69) | 42.364 | 0.000 |
| Yes | 80 (40.40) | 118 (59.60) | 106 (46.29) | 123 (53.71) | ||||
| C-reactive protein (mg/l) | 5.21 ± 0.68 | 5.29 ± 0.85 | −2.966 | 0.003 | 5.27 ± 0.81 | 5.37 ± 0.95 | −3.648 | 0.000 |
| HbA1c (%) | 2.85 ± 7.4 | 3.46 ± 8.74 | −2.110 | 0.035 | 2.12 ± 4.98 | 3.10 ± 7.17 | −4.922 | 0.000 |
| Fasting plasma glucose (mg/dl) | 108.35 ± 32.73 | 113.93 ± 39.51 | −4.304 | 0.000 | 108.43 ± 34.39 | 115.26 ± 44.62 | −5.209 | 0.000 |
| Low density lipoprotein (mg/dl) | 111.23 ± 33.92 | 115.58 ± 35.82 | −3.408 | 0.001 | 119.98 ± 33.79 | 122.7 ± 38.35 | −2.239 | 0.025 |
| High density lipoprotein (mg/dl) | 51.22 ± 16.17 | 50.19 ± 16.35 | 1.719 | 0.086 | 52.2 ± 14.16 | 50.15 ± 14.4 | 4.205 | 0.000 |
| eGFR (ml/min/1.73m2) | 84.26 ± 17.04 | 79.00 ± 18.48 | 8.122 | 0.000 | 87.63 ± 17.01 | 80.39 ± 18.51 | 12.016 | 0.000 |
| Body mass index (kg/m2) | 22.52 ± 3.64 | 23.65 ± 3.69 | −8.372 | 0.000 | 23.59 ± 3.89 | 24.67 ± 4.5 | −7.653 | 0.000 |
| Systolic blood pressure (mmHg) | 119.73 ± 11.55 | 155.77 ± 22.4 | −61.346 | 0.000 | 118.93 ± 11.82 | 159.23 ± 31.47 | −56.586 | 0.000 |
| Diastolic blood pressure (mmHg) | 71.23 ± 9.30 | 88.88 ± 12.55 | −45.640 | 0.000 | 71.27 ± 9.05 | 86.79 ± 11.9 | −44.687 | 0.000 |
| Serum uric acid (mg/dl) | 4.87 ± 1.24 | 5.20 ± 1.33 | − 7.077 | 0.000 | 3.93 ± 1.04 | 4.24 ± 1.16 | −8.407 | 0.000 |
| Triglycerides (mg/dl) | 120.58 ± 100.65 | 133.51 ± 111.81 | −3.349 | 0.001 | 129.26 ± 82.88 | 154.49 ± 112.79 | −7.798 | 0.000 |
Table 2 showed the age-adjusted relationship between the baseline of demographic variables and BP status of participants categorized by gender. In the men, firstly, age-adjusted partial Pearson’s correlation coefficient showed that marital status, place of residence, accidental injury, history of CVDs, antilipidemic medication, anti-hypertensive medication, HbA1c, FPG, LDL-C, HDL-C, eGFR, BMI, SUA and TG level significantly correlated with both SBP and DBP. Secondly, anti-diabetic medication positively correlated with SBP. Lastly, alcohol consumption and eating habits significantly correlated with DBP. In the women, firstly, age-adjusted partial Pearson’s correlation coefficient showed that alcohol consumption, history of CVDs, antilipidemic medication, anti-hypertensive medication, anti-diabetic medication, HbA1c, FPG, HDL-C, BMI, SUA and TG level significantly correlated with both SBP and DBP. Secondly, marital status positively correlated with SBP. Thirdly, eating habit, hepatitis history, LDL-C, and eGFR significantly correlated with DBP.
Table 2.
Age-adjusted relationship between baseline of demographic variables and blood pressure status of participants categorized by gender (N = 7119)
| Variables | Men (n = 3345) | Women (n = 3774) | ||
|---|---|---|---|---|
| Systolic blood pressure partial r(P-value) |
Diastolic blood pressure partial r(P-value) |
Systolic blood pressure partial r(P-value) |
Diastolic blood pressure partial r(P-value) |
|
| Educational levels | 0.003 (0.873) | 0.028 (0.113) | −0.029 (0.077) | − 0.022 (0.180) |
| Marital status | 0.064 (0.000) | 0.050 (0.004) | 0.045 (0.007) | 0.010 (0.529) |
| Place of residence | 0.080 (0.000) | 0.083 (0.000) | 0.024 (0.138) | 0.014 (0.394) |
| Cigarette smoking | 0.009 (0.590) | − 0.028 (0.107) | − 0.007 (0.656) | 0.003 (0.858) |
| Alcohol consumption | 0.017 (0.334) | 0.044 (0.011) | −0.052 (0.002) | −0.045 (0.007) |
| Eating habit | −0.028 (0.107) | −0.047 (0.008) | − 0.011 (0.521) | − 0.052 (0.002) |
| Social and leisure activities | − 0.009 (0.589) | − 0.002 (0.928) | 0.014 (0.380) | 0.009 (0.585) |
| Accidental injury | −0.041 (0.019) | −0.043 (0.013) | − 0.026 (0.115) | −0.008 (0.627) |
| Physical exercises | 0.020 (0.245) | 0.001 (0.942) | −0.010 (0.546) | 0.006 (0.735) |
| History of cardiovascular disease | 0.050 (0.005) | 0.064 (0.000) | 0.039 (0.018) | 0.039 (0.019) |
| Hepatitis history | −0.014 (0.409) | −0.009 (0.622) | − 0.020 (0.235) | −0.039 (0.019) |
| Antilipidemic therapy | 0.036 (0.039) | 0.046 (0.009) | 0.063 (0.000) | 0.076 (0.000) |
| Antidiabetic drugs | 0.049 (0.005) | 0.023 (0.187) | 0.073 (0.000) | 0.033 (0.047) |
| Anti-hypertensive therapy | 0.152 (0.000) | 0.147 (0.000) | 0.106 (0.000) | 0.084 (0.000) |
| C-reactive protein (mg/l) | 0.024 (0.177) | 0.007 (0.704) | 0.030 (0.070) | 0.022 (0.172) |
| HbA1c (%) | 0.064 (0.000) | 0.070 (0.000) | 0.048 (0.004) | 0.073 (0.000) |
| Fasting plasma glucose (mg/dl) | 0.093 (0.000) | 0.078 (0.000) | 0.040 (0.015) | 0.082 (0.000) |
| Low density lipoprotein (mg/dl) | 0.083 (0.000) | 0.065 (0.000) | 0.022 (0.182) | 0.034 (0.039) |
| High density lipoprotein (mg/dl) | −0.054 (0.002) | −0.048 (0.006) | −0.085 (0.000) | − 0.111 (0.000) |
| eGFR (ml/min/1.73m2) | −0.090 (0.000) | − 0.045 (0.009) | − 0.023 (0.156) | −0.042 (0.010) |
| Body mass index (kg/m2) | 0.218 (0.000) | 0.221 (0.000) | 0.165 (0.000) | 0.221 (0.000) |
| Serum uric acid (mg/dl) | 0.122 (0.000) | 0.096 (0.000) | 0.084 (0.000) | 0.102 (0.000) |
| Triglycerides (mg/dl) | 0.111 (0.000) | 0.109 (0.000) | 0.103 (0.000) | 0.143 (0.000) |
Table 3 showed a multivariate-adjusted relationship between the baseline of demographic variables and BP in participants categorized by gender. The results showed that the TG level were significantly and positively associated with SBP and DBP in both men (SBP: β =0.068, P = 0.001; DBP: β =0.064, P = 0.002) and women (SBP: β =0.061, P = 0.002; DBP: β =0.084, P = 0.000), but SUA were significantly and positively associated with SBP in both men (SBP: β =0.047, P = 0.013) and women (SBP: β =0.040, P = 0.028), regardless of other confounding factors. We also take care of the direct associations between TG category and SUA levels on BP levels. Figure 2 showed that the lines differenced from others in each figure.
Table 3.
Multivariate-adjusted relationship between baseline of demographic variables and blood pressure status of participants categorized by gender (N = 7119)
| Variables | Men (n = 3345) | Women (n = 3774) | ||
|---|---|---|---|---|
| Systolic blood pressure β(P-value) |
Diastolic blood pressure β (P-value) |
Systolic blood pressure β (P-value) |
Diastolic blood pressure β (P-value) |
|
| Age (years) | 0.144 (0.000) | −0.119 (0.000) | 0.224 (0.000) | −0.057 (0.011) |
| Educational levels | – | – | −0.043 (0.014) | − 0.036 (0.042) |
| Marital status | 0.081 (0.000) | 0.070 (0.000) | 0.058 (0.001) | – |
| Place of residence | 0.049 (0.004) | 0.052 (0.003) | – | – |
| Cigarette smoking | 0.048 (0.005) | – | – | – |
| Alcohol consumption | – | 0.047 (0.008) | −0.036 (0.023) | – |
| Eating habit | – | −0.055 (0.001) | – | − 0.064 (0.000) |
| Social and leisure activities | −0.034 (0.041) | – | – | – |
| Accidental injury | −0.034 (0.036) | − 0.039 (0.019) | – | – |
| Physical exercises | – | – | – | – |
| History of CVD | – | 0.034 (0.047) | – | – |
| Hepatitis history | – | – | – | −0.039 (0.015) |
| Antilipidemic therapy | – | – | – | 0.036 (0.034) |
| Antidiabetic drugs | – | −0.043 (0.021) | 0.050 (0.004) | – |
| Anti-hypertensive therapy | 0.126 (0.000) | 0.124 (0.000) | 0.097 (0.000) | 0.075 (0.000) |
| C-reactive protein (mg/l) | – | – | – | – |
| HbA1c (%) | – | – | – | – |
| Fasting plasma glucose (mg/dl) | 0.052 (0.017) | – | – | – |
| Low density lipoprotein (mg/dl) | 0.068 (0.000) | 0.050 (0.004) | – | – |
| High density lipoprotein (mg/dl) | – | – | – | – |
| eGFR (ml/min/1.73m2) | −0.091 (0.000) | −0.048 (0.035) | – | −0.045 (0.043) |
| Body mass index (kg/m2) | 0.193 (0.000) | 0.194 (0.000) | 0.129 (0.000) | 0.193 (0.000) |
| Serum uric acid (mg/dl) | 0.047 (0.013) | – | 0.040 (0.028) | – |
| Triglycerides (mg/dl) | 0.068 (0.001) | 0.064 (0.002) | 0.061 (0.002) | 0.084 (0.000) |
| R2 | 0.132 (0.000) | 0.106 (0.000) | 0.120 (0.000) | 0.081 (0.000) |
Fig. 2.

a and b, correlation between serum uric acid (SUA) and blood pressure (BP) of individuals categorized by triglycerides (TG) in men. c and d, correlation between serum uric acid (SUA) and blood pressure (BP) of individuals categorized by triglycerides (TG) in women
A general linear model adjusted for the related confounding factors (socio-demographic characteristics [age, educational levels, marital status, place of residence], health behaviors [smoking habit, alcohol consumption, eating habits, social and leisure activities, accidental injury, physical activities], medical history [history of CVDs, hepatitis history, antidiabetic drugs, anti-hypertensive therapy, history of antilipidemic medication], metabolic measures [CRP, HbA1c, FPG, HDL-C, eGFR, LDL-C, BMI]) was used to explore the combined relationship between SUA and TG level. Evidence of interaction between SUA and TG level on SBP (β = − 1.090, P = 0.726 in men; β = − 0.692, P = 0.861 in women) and DBP (β = − 1.026, P = 0.572 in men; β = − 0.794, P = 0.842 in women) was not observed (Table 4).
Table 4.
Interaction between Triglycerides and uric acid on blood pressure status in Men and Women (N = 7119)
| Characteristics | Men (n = 3345) | Women (n = 3774) | ||
|---|---|---|---|---|
| Systolic blood pressure β(P-value) |
Diastolic blood pressure β(P-value) |
Systolic blood pressure β(P-value) |
Diastolic blood pressure β(P-value) |
|
| Age (years) | 0.350 (0.000) | −0.159 (0.000) | 0.692 (0.000) | 0.711 (0.000) |
| Educational levels | – | – | −1.694 (0.013) | −1.740 (0.012) |
| Marital status | 6.149 (0.000) | 2.975 (0.000) | 4.244 (0.001) | – |
| Place of residence | 2.141 (0.009) | 1.444 (0.002) | – | – |
| Cigarette smoking | 1.432 (0.002) | – | – | – |
| Alcohol consumption | – | 0.753 (0.001) | −1.911 (0.016) | – |
| Eating habit | – | −1.917 (0.001) | – | −1.53 (0.196) |
| Social and leisure activities | −1.681 (0.027) | – | – | |
| Accidental injury | −2.445 (0.030) | −1.737 (0.008) | – | – |
| Physical exercises | – | – | – | – |
| History of CVD | – | 1.508 (0.039) | – | −3.082 (0.198) |
| Hepatitis history | – | – | – | 4.841 (0.011) |
| Antilipidemic therapy | – | – | – | |
| Antidiabetic drugs | – | −1.691 (0.169) | 6.722 (0.001) | 11.466 (0.000) |
| Anti-hypertensive therapy | 12.729 (0.000) | 7.142 (0.000) | 11.542 (0.000) | – |
| C-reactive protein | – | – | – | – |
| HbA1c (%) | – | – | – | – |
| Fasting plasma glucose (mg/dl) | 0.034 (0.002) | – | – | – |
| Low density lipoprotein (mg/dl) | 0.042 (0.000) | 0.019 (0.003) | – | – |
| High density lipoprotein (mg/dl) | – | – | – | – |
| eGFR (ml/min/1.73m2) | −0.131 (0.000) | −0.032 (0.041) | – | −0.040 (0.200) |
| Body mass index (kg/m2) | 1.176 (0.000) | 0.686 (0.000) | 0.975 (0.000) | 0.984 (0.000) |
| Serum uric acid (0 = ≤7 mg/dL in men and ≤ 6 mg/dL in women, 1= > 7 mg/dL in men and > 6 mg/dL in women) | −2.252 (0.353) | −1.723 (0.223) | −2.424 (0.391) | −1.907 (0.508) |
| Triglycerides (0 = < 150 mg/dL 1 = ≥150 mg/dL) | − 1.695 (0.571) | −0.560 (0.748) | − 2.387 (0.535) | −2.272 (0.558) |
| Serum uric acid * Triglycerides | − 1.090 (0.726) | −1.026 (0.572) | − 0.692 (0.861) | −0.794 (0.842) |
Discussion
At present, the association of SUA and TG level and the level with BP varied in middle-aged and elderly individuals. In the research, we attempted to determine the hypertension prevalence and its association with TG and SUA level. The results showed that prevalence of hypertension was 32.23% (1078/3345) in men and 33.97% (1282/3774) in women, which is similar to those of the English individuals (men, 36.8%; women, 38.6%) [48]. Moreover, SUA and TG level were significantly (positively) associated with DBP and SBP in both men and women. In general, this finding is consistent with most previous studies [41, 49] that suggested the high SUA and TG level were risk factors for hypertension.
Although previous studies [45, 50, 51] have explored the association and/or interaction analysis between BMI and SUA levels and BP, no consistent results are pointing to such associations. Lee et al. [45], using data from 45,098 Koreans who underwent health examinations at Korea Association of Health Promotion with no history of taking drugs related with UA and/or BP, found that SUA levels were positively associated with SBP and DBP in men aged < 40 years after adjustment for age, diabetes, dyslipidemia, BMI, and eGFR; However, no significant associations were found in men aged 60 years or older. Lyngdoh et al. [50], assessing 549 individuals aged 19–20 years, found that SUA levels tended to be positively associated with DBP and SBP in men. Moreover, the strength of the SUA-BP association was similar in women. Kawamoto et al. [51] found that increased SUA levels were positively associated with BP in participants with BMI < 21.0 kg/m2, while there was a negative association between SUA levels, BP in those with BMI ≥ 21.0 kg/m2, in whom the interaction between BMI and SUA levels was a significant and independent determinant of both SBP and DBP. The difference between those studies may due to the different sampling methods, the different population, and different confounding variables by controlling. It is interesting to note that only one study [47] reported the interaction between SUA and TG on blood pressure. Furthermore, it was found that there was a significant joint effect of TG and SUA level on DBP. However, in our study, we found no significant interaction between SUA level and TG in relation to blood pressure. A community-based study of a consecutive sample of 3065 individuals suggested that the SUA level was highest in people with abnormal levels of TG [52]. In another study, the association of TG and SUA had been persistent after full adjustment, suggesting that TG correlated independently with SUA levels [53]. The mechanisms that lead to hypertension in participants with high TG or SUA level have not been elucidated. Several studies [54–56] reported that high SUA levels induced endothelial dysfunction through vascular resistance in insulin-induced NO production, potentially leading to hypertension. Additionally, high TG levels are also strongly correlated with insulin resistance, and insulin resistance promotes the development of hypertension by augmenting sympathetic nervous system reactivity, activating the renin-angiotensin system, and stimulating renal tubular sodium reabsorption. Renin-angiotensin system activation is induced not only by high SUA levels but also by high TG levels, and the two factors may have interactive effects on blood pressure. Moreover, SUA is strongly associated with inflammation [57–59], oxidative stress [60–62] and other risk factors for CVDs, such as BMI, TG, and FPG [51]. Risk factors associated with hypertension may lead to decreased vasomotor reactivity, endothelial dysfunction, and arterial stiffness [51], ultimately causing hypertension. Those studies may provide insights into the pathogenic mechanism by which SUA or TG induces hypertension. Though the joint effects were not examined, we found that SUA level was independently associated with SBP in both men and women, and TG independently associated with BP in both men and women. Our study suggested that SUA may play an essential role in SBP, and gender-specific factors may also be crucial. The SUA level was higher in men than in women, which can partially explain the underlying mechanisms that possibly account for gender differences, such as alcohol consumption, whose prevalence is usually higher in men. Additionally, body fat and steroid hormones, and their interaction in middle-aged and older adults may also be associated with hypertension.
This study has three limitations. First, the association and interaction between SUA and TG level and BP become seriously more complex. We only considered the identified confounders. However, some unknown factors still existed. Second, the relationship should be studied prospectively. However, our study investigated the interaction between SUA and TG and BP level in participants aged ≥45 years in a cross-sectional study. More follow-up cohort studies will be needed to determine the associations in the next phase. Thirdly, an investigator-based interview was compared with a self-report questionnaire-based directly on that interview. Finally, more research is needed to confirm the results. However, this study has several strengths, as well. Firstly, this study was conducted based on a nationwide survey, and secondly, the analyses were conducted based on gender.
Conclusions
An interaction between SUA and TG level and BP was not observed in either men or women in our study. Moreover, high SUA level was significantly associated with SBP, while high TG level was strongly related to both DBP and SBP.
Acknowledgements
We are grateful to the participants and members of the China Health and Retirement Longitudinal Study (CHARLS).
Abbreviations
- CHARLS
China health and retirement longitudinal study
- CRP
C-reactive protein
- FPG
Fasting plasma glucose
- TG
Triglycerides
- BMI
Body mass index
- DBP
Diastolic blood pressure
- BP
Blood pressure
- SBP
Systolic blood pressure
- SUA
Serum uric acid
- CVDs
Cardiovascular diseases
- HbA1c
Hemoglobin A1c
- HUA
Hyperuricemia
- eGFR
Estimated glomerular filtration rate
- CDC
Centers for disease control
- LDL-C
Low-density lipoprotein cholesterol
- HDL-C
High-density lipoprotein cholesterol
- β
Standardized coefficients
- NSFC
National Natural Science Foundation of China
- NIA
National institute on aging
Authors’ contributions
LZ conceived and drafted the manuscript. L-lG, J-lL, HL, DL, and GX helped revise the manuscript. The author(s) read and approved the final manuscript.
Funding
CHARLS was supported by the NSFC (70910107022, 71130002) and National Institute on Aging (R03-TW008358–01; R01-AG037031-03S1), and World Bank (7159234).
Availability of data and materials
Data can be accessed via https://charls.pku.edu.cn/zh-CN.
Ethics approval and consent to participate
The study is publicly available (http://charls.pku.edu.cn/zh-CN) with no direct contact with the individual participants.
Consent for publication
Consent for publication was obtained from all participant.
Competing interests
The authors declare that they have no compteng interests.
Footnotes
Publisher’s Note
Springer Nature remains neutral with regard to jurisdictional claims in published maps and institutional affiliations.
Contributor Information
Lin Zhang, Email: yaoran2008@163.com.
Jin-long Li, Email: 601976415@qq.com.
Lei-lei Guo, Email: 623419731@qq.com.
Hong Li, Email: 1053811624@qq.com.
Dan Li, Email: 383869505@qq.com.
Guang Xu, Email: xuguang20080101@163.com.
References
- 1.Glynn RJ, L'Italien GJ, Sesso HD, Jackson EA, Buring JE. Development of predictive models for long-term cardiovascular risk associated with systolic and diastolic blood pressure. Hypertension. 2002;39(1):105–110. doi: 10.1161/hy1201.097199. [DOI] [PubMed] [Google Scholar]
- 2.Yu D, Huang J, Hu D, Chen J, Cao J, Li J, Gu D. Association between prehypertension and clustering of cardiovascular disease risk factors among Chinese adults. J Cardiovasc Pharmacol. 2009;53(5):388–400. doi: 10.1097/FJC.0b013e3181a02238. [DOI] [PubMed] [Google Scholar]
- 3.Gu D, Chen J, Wu X, Duan X, Jones DW, Huang JF, Chen CS, Chen JC, Kelly TN, Whelton PK, et al. Prehypertension and risk of cardiovascular disease in Chinese adults. J Hypertens. 2009;27(4):721–729. doi: 10.1097/HJH.0b013e328323ad89. [DOI] [PubMed] [Google Scholar]
- 4.Lackland DT, Weber MA. Global burden of cardiovascular disease and stroke: hypertension at the core. Can J Cardiol. 2015;31(5):569–571. doi: 10.1016/j.cjca.2015.01.009. [DOI] [PubMed] [Google Scholar]
- 5.Fagard RH. Predicting risk of fatal cardiovascular disease and sudden death in hypertension. J Hypertens. 2017;35(11):2165–2167. doi: 10.1097/HJH.0000000000001485. [DOI] [PubMed] [Google Scholar]
- 6.James JE. Hypertension control and cardiovascular disease. Lancet. 2017;389(10065):154. doi: 10.1016/S0140-6736(17)30018-1. [DOI] [PubMed] [Google Scholar]
- 7.Cartier A, Malo JL, Gautrin D, Boulet LP, Boisjoly H. Glucocorticoid use and risks of ocular hypertension and glaucoma. Jama. 1997;277(24):1929–1930. doi: 10.1001/jama.1997.03540480029020. [DOI] [PubMed] [Google Scholar]
- 8.Beilin L. Alcohol and hypertension: balancing the risks and benefits. J Hypertens. 2005;23(11):1953–1955. doi: 10.1097/01.hjh.0000187255.19998.29. [DOI] [PubMed] [Google Scholar]
- 9.Kannel WB. Hypertension: reflections on risks and prognostication. Med Clin North Am. 2009;93(3):541–558. doi: 10.1016/j.mcna.2009.02.006. [DOI] [PMC free article] [PubMed] [Google Scholar]
- 10.Kawamoto R, Kohara K, Tabara Y, Abe M, Kusunoki T, Miki T. Insulin resistance and prevalence of prehypertension and hypertension among community-dwelling persons. J Atheroscler Thromb. 2010;17(2):148–155. doi: 10.5551/jat.2584. [DOI] [PubMed] [Google Scholar]
- 11.Isezuo SA, Sabir AA, Ohwovorilole AE, Fasanmade OA. Prevalence, associated factors and relationship between prehypertension and hypertension: a study of two ethnic African populations in northern Nigeria. J Hum Hypertens. 2011;25(4):224–230. doi: 10.1038/jhh.2010.56. [DOI] [PubMed] [Google Scholar]
- 12.Kawamoto R, Tabara Y, Kohara K, Miki T, Abe M, Kusunoki T. Increased high-density lipoprotein cholesterol is associated with a high prevalence of pre-hypertension and hypertension in community-dwelling persons. Endocrine. 2012;42(2):321–328. doi: 10.1007/s12020-012-9625-z. [DOI] [PubMed] [Google Scholar]
- 13.Lee MS, Chang CH, Lin RY, Lai MS. Risks of hypertension associated with cyclosporine, nonsteroidal anti-inflammatory drugs, and systemic glucocorticoids in patients with psoriasis: a nationwide population-based nested case-control study in Taiwan. Pharmacoepidemiol Drug Saf. 2016;25(2):133–140. doi: 10.1002/pds.3890. [DOI] [PubMed] [Google Scholar]
- 14.Gui ZH, Zhu YN, Cai L, Sun FH, Ma YH, Jing J, Chen YJ. Sugar-sweetened beverage consumption and risks of obesity and hypertension in chinese children and adolescents: a national cross-sectional analysis. Nutrients. 2017;9(12).. [DOI] [PMC free article] [PubMed]
- 15.Cloutier L, Morris D, Bruneau J, McLean D, Campbell N. World Health Organization celebrates world health day, April 7,2013--focusing on hypertension. Can J Cardiovasc Nurs. 2013;23(2):9–11. [PubMed] [Google Scholar]
- 16.Wu Y, Huxley R, Li L, Anna V, Xie G, Yao C, Woodward M, Li X, Chalmers J, Gao R, et al. Prevalence, awareness, treatment, and control of hypertension in China: data from the China National Nutrition and health survey 2002. Circulation. 2008;118(25):2679–2686. doi: 10.1161/CIRCULATIONAHA.108.788166. [DOI] [PubMed] [Google Scholar]
- 17.Zhao Y, Yan H, Marshall RJ, Dang S, Yang R, Li Q, Qin X. Trends in population blood pressure and prevalence, awareness, treatment, and control of hypertension among middle-aged and older adults in a rural area of Northwest China from 1982 to 2010. PLoS One. 2013;8(4):e61779. doi: 10.1371/journal.pone.0061779. [DOI] [PMC free article] [PubMed] [Google Scholar]
- 18.Wu L, He Y, Jiang B, Sun D, Wang J, Liu M, Yang S, Wang Y. Trends in prevalence, awareness, treatment and control of hypertension during 2001-2010 in an urban elderly population of China. PLoS One. 2015;10(8):e0132814. doi: 10.1371/journal.pone.0132814. [DOI] [PMC free article] [PubMed] [Google Scholar]
- 19.Wang S, Chen R, Liu Q, Shu Z, Zhan S, Li L. Prevalence, awareness and treatment of chronic kidney disease among middle-aged and elderly: the China health and retirement longitudinal study. Nephrology. 2015;20(7):474–484. doi: 10.1111/nep.12449. [DOI] [PubMed] [Google Scholar]
- 20.Liu X, Gu W, Li Z, Lei H, Li G, Huang W. Hypertension prevalence, awareness, treatment, control, and associated factors in Southwest China: an update. J Hypertens. 2017;35(3):637–644. doi: 10.1097/HJH.0000000000001203. [DOI] [PubMed] [Google Scholar]
- 21.Kim Y, Kim YJ, Lim Y, Oh B, Kim JY, Bouwman J, Kwon O. Combination of diet quality score, plasma carotenoids, and lipid peroxidation to monitor oxidative stress. Oxidative Med Cell Longev. 2018;2018:8601028. doi: 10.1155/2018/8601028. [DOI] [PMC free article] [PubMed] [Google Scholar]
- 22.Alderman M. Uric acid in hypertension and cardiovascular disease. Can J Cardiol. 1999;15 Suppl F:20F–22F. [PubMed] [Google Scholar]
- 23.Borghi C. The role of uric acid in the development of cardiovascular disease. Curr Med Res Opin. 2015;31(Suppl 2):1–2. doi: 10.1185/03007995.2015.1087985. [DOI] [PubMed] [Google Scholar]
- 24.Tian Y, Chen K, Xie Z, Fang Y, Wang H, Nie Y, Hu D, Mu Y. The association between serum uric acid levels, metabolic syndrome and cardiovascular disease in middle aged and elderly Chinese: results from the DYSlipidemia International Study. BMC Cardiovasc Disord. 2015;15:66. doi: 10.1186/s12872-015-0059-4. [DOI] [PMC free article] [PubMed] [Google Scholar]
- 25.Wu AH, Gladden JD, Ahmed M, Ahmed A, Filippatos G. Relation of serum uric acid to cardiovascular disease. Int J Cardiol. 2016;213:4–7. doi: 10.1016/j.ijcard.2015.08.110. [DOI] [PubMed] [Google Scholar]
- 26.Soletsky B, Feig DI. Uric acid reduction rectifies prehypertension in obese adolescents. Hypertension. 2012;60(5):1148–1156. doi: 10.1161/HYPERTENSIONAHA.112.196980. [DOI] [PubMed] [Google Scholar]
- 27.Syamala S, Li J, Shankar A. Association between serum uric acid and prehypertension among US adults. J Hypertens. 2007;25(8):1583–1589. doi: 10.1097/HJH.0b013e32813aeb6c. [DOI] [PubMed] [Google Scholar]
- 28.Jiang M, Gong D, Fan Y. Serum uric acid levels and risk of prehypertension: a meta-analysis. Clin Chem Lab Med. 2017;55(3):314–321. doi: 10.1515/cclm-2016-0339. [DOI] [PubMed] [Google Scholar]
- 29.Kuwabara M, Hisatome I, Niwa K, Hara S, Roncal-Jimenez CA, Bjornstad P, Nakagawa T, Andres-Hernando A, Sato Y, Jensen T, et al. Uric acid is a strong risk marker for developing hypertension from prehypertension: a 5-year Japanese cohort study. Hypertension. 2018;71(1):78–86. doi: 10.1161/HYPERTENSIONAHA.117.10370. [DOI] [PMC free article] [PubMed] [Google Scholar]
- 30.Cibickova L, Langova K, Vaverkova H, Kubickova V, Karasek D. Correlation of uric acid levels and parameters of metabolic syndrome. Physiol Res. 2017;66(3):481–487. doi: 10.33549/physiolres.933410. [DOI] [PubMed] [Google Scholar]
- 31.Bouhenni H, Daoudi H, Djemai H, Rouabah A, Vitiello D, Rouabah L. Metabolic syndrome, leptin-insulin resistance and uric acid: a trinomial foe for Algerian city-dweller adolescents’ health. Int J Adolesc Med Health. 2018.. [DOI] [PubMed]
- 32.King C, Lanaspa MA, Jensen T, Tolan DR, Sanchez-Lozada LG, Johnson RJ. Uric acid as a cause of the metabolic syndrome. Contrib Nephrol. 2018;192:88–102. doi: 10.1159/000484283. [DOI] [PubMed] [Google Scholar]
- 33.Feig DI. Uric acid and hypertension. Semin Nephrol. 2011;31(5):441–446. doi: 10.1016/j.semnephrol.2011.08.008. [DOI] [PubMed] [Google Scholar]
- 34.Wu L, He Y, Jiang B, Liu M, Wang J, Zhang D, Wang Y, Zeng J. Association between serum uric acid level and hypertension in a Chinese elderly rural population. Clin Exp Hypertens. 2017;39(6):505–512. doi: 10.1080/10641963.2016.1259325. [DOI] [PubMed] [Google Scholar]
- 35.Cui LF, Shi HJ, Wu SL, Shu R, Liu N, Wang GY, Zhou B, Sun K, Yu P, Wang J, et al. Association of serum uric acid and risk of hypertension in adults: a prospective study of Kailuan corporation cohort. Clin Rheumatol. 2017;36(5):1103–1110. doi: 10.1007/s10067-017-3548-2. [DOI] [PubMed] [Google Scholar]
- 36.Yue JR, Huang CQ, Dong BR. Association of serum uric acid with body mass index among long-lived Chinese. Exp Gerontol. 2012;47(8):595–600. doi: 10.1016/j.exger.2012.05.008. [DOI] [PubMed] [Google Scholar]
- 37.Tanaka K, Ogata S, Tanaka H, Omura K, Honda C, Osaka Twin Research G. Hayakawa K. The relationship between body mass index and uric acid: a study on Japanese adult twins. Environ Health Prev Med. 2015;20(5):347–353. doi: 10.1007/s12199-015-0473-3. [DOI] [PMC free article] [PubMed] [Google Scholar]
- 38.Kuwahara E, Murakami Y, Okamura T, Komatsu H, Nakazawa A, Ushiku H, Maejima F, Nishigaki Y, Nishiwaki Y. Increased childhood body mass index is associated with young adult serum uric acid levels: a linkage study from Japan. Pediatr Res. 2016;81(2):293–298. doi: 10.1038/pr.2016.213. [DOI] [PubMed] [Google Scholar]
- 39.Li C, Liu T, Sun W, Wu L, Zou ZY. Prevalence and risk factors of arthritis in a middle-aged and older Chinese population: the China health and retirement longitudinal study. Rheumatology. 2015;54(4):697–706. doi: 10.1093/rheumatology/keu391. [DOI] [PubMed] [Google Scholar]
- 40.Zhang L, Liu K, Li H, Li D, Chen Z, Zhang LL, Guo LL. Relationship between body mass index and depressive symptoms: the “fat and jolly” hypothesis for the middle-aged and elderly in China. BMC Public Health. 2016;16(1):1201. doi: 10.1186/s12889-016-3864-5. [DOI] [PMC free article] [PubMed] [Google Scholar]
- 41.Zhang L, Li JL, Zhang LL, Guo LL, Li H, Li D. Association and interaction analysis of body mass index and triglycerides level with blood pressure in elderly individuals in China. Biomed Res Int. 2018;2018:8934534. doi: 10.1155/2018/8934534. [DOI] [PMC free article] [PubMed] [Google Scholar]
- 42.Zhang L, Li JL, Zhang LL, Guo LL, Li H, Li D. No association between c-reactive protein and depressive symptoms among the middle-aged and elderly in china evidence from the china health and retirement longitudinal study. Medicine. 2018;97(38):e12352. doi: 10.1097/MD.0000000000012352. [DOI] [PMC free article] [PubMed] [Google Scholar]
- 43.Zhang L, Li JL, Zhang LL, Guo LL, Li H, Yan WZ, Li D. Relationship between adiposity parameters and cognition: the “fat and jolly” hypothesis in middle-aged and elderly people in China. Medicine. 2019;98(10):e14747. doi: 10.1097/MD.0000000000014747. [DOI] [PMC free article] [PubMed] [Google Scholar]
- 44.Zhang L, Li JL, Zhang LL, Guo LL, Li H, Li D. Body mass index and serum uric acid level: individual and combined effects on blood pressure in middle-aged and older individuals in China. Medicine. 2020;99(9):e19418. doi: 10.1097/MD.0000000000019418. [DOI] [PMC free article] [PubMed] [Google Scholar]
- 45.Zhou BF. Effect of body mass index on all-cause mortality and incidence of cardiovascular diseases--report for meta-analysis of prospective studies open optimal cut-off points of body mass index in Chinese adults. Biomed Environ Sci. 2002;15(3):245–252. [PubMed] [Google Scholar]
- 46.Zhu Y, Ye X, Zhu B, Pei X, Wei L, Wu J, Zhao W. Comparisons between the 2012 new CKD-EPI (chronic kidney disease epidemiology collaboration) equations and other four approved equations. PLoS One. 2014;9(1):e84688. doi: 10.1371/journal.pone.0084688. [DOI] [PMC free article] [PubMed] [Google Scholar]
- 47.Teng F, Zhu R, Zou C, Xue Y, Yang M, Song H, Liang J. Interaction between serum uric acid and triglycerides in relation to blood pressure. J Hum Hypertens. 2011;25(11):686–691. doi: 10.1038/jhh.2010.112. [DOI] [PubMed] [Google Scholar]
- 48.Steptoe A, McMunn A. Health behaviour patterns in relation to hypertension: the English longitudinal study of ageing. J Hypertens. 2009;27(2):224–230. doi: 10.1097/HJH.0b013e3283193e6e. [DOI] [PubMed] [Google Scholar]
- 49.Simental-Mendia LE, Hernandez-Ronquillo G, Gamboa-Gomez CI, Gomez-Diaz R, Rodriguez-Moran M, Guerrero-Romero F. The triglycerides and glucose index is associated with elevated blood pressure in apparently healthy children and adolescents. Eur J Pediatr. 2019;178(7):1069–1074. doi: 10.1007/s00431-019-03392-x. [DOI] [PubMed] [Google Scholar]
- 50.Lyngdoh T, Viswanathan B, Myers GJ, Bochud M, Bovet P. Impact of different adiposity measures on the relation between serum uric acid and blood pressure in young adults. J Hum Hypertens. 2012;26(11):677–683. doi: 10.1038/jhh.2011.85. [DOI] [PubMed] [Google Scholar]
- 51.Kawamoto R, Ninomiya D, Senzaki K, Kumagi T. Interaction between body mass index and serum uric acid in relation to blood pressure in community-dwelling Japanese men. Clin Hypertens. 2018;24:1. doi: 10.1186/s40885-018-0087-3. [DOI] [PMC free article] [PubMed] [Google Scholar]
- 52.Chien KL, Chen MF, Hsu HC, Chang WT, Su TC, Lee YT, Hu FB. Plasma uric acid and the risk of type 2 diabetes in a Chinese community. Clin Chem. 2008;54(2):310–316. doi: 10.1373/clinchem.2007.095190. [DOI] [PubMed] [Google Scholar]
- 53.Lin SD, Tsai DH, Hsu SR. Association between serum uric acid level and components of the metabolic syndrome. J Chin Med Assoc. 2006;69(11):512–516. doi: 10.1016/S1726-4901(09)70320-X. [DOI] [PubMed] [Google Scholar]
- 54.Maxwell AJ, Bruinsma KA. Uric acid is closely linked to vascular nitric oxide activity. Evidence for mechanism of association with cardiovascular disease. J Am Coll Cardiol. 2001;38(7):1850–1858. doi: 10.1016/S0735-1097(01)01643-6. [DOI] [PubMed] [Google Scholar]
- 55.Papezikova I, Pekarova M, Kolarova H, Klinke A, Lau D, Baldus S, Lojek A, Kubala L. Uric acid modulates vascular endothelial function through the down regulation of nitric oxide production. Free Radic Res. 2013;47(2):82–88. doi: 10.3109/10715762.2012.747677. [DOI] [PubMed] [Google Scholar]
- 56.Choi YJ, Yoon Y, Lee KY, Hien TT, Kang KW, Kim KC, Lee J, Lee MY, Lee SM, Kang DH, et al. Uric acid induces endothelial dysfunction by vascular insulin resistance associated with the impairment of nitric oxide synthesis. FASEB J. 2014;28(7):3197–3204. doi: 10.1096/fj.13-247148. [DOI] [PubMed] [Google Scholar]
- 57.Kalay N, Aytekin M, Kaya MG, Ozbek K, Karayakali M, Sogut E, Altunkas F, Ozturk A, Koc F. The relationship between inflammation and slow coronary flow: increased red cell distribution width and serum uric acid levels. Turk Kardiyoloji Dernegi arsivi : Turk Kardiyoloji Derneginin yayin organidir. 2011;39(6):463–468. doi: 10.5543/tkda.2011.01578. [DOI] [PubMed] [Google Scholar]
- 58.Zhou Y, Fang L, Jiang L, Wen P, Cao H, He W, Dai C, Yang J. Uric acid induces renal inflammation via activating tubular NF-kappaB signaling pathway. PLoS One. 2012;7(6):e39738. doi: 10.1371/journal.pone.0039738. [DOI] [PMC free article] [PubMed] [Google Scholar]
- 59.Turak O, Ozcan F, Tok D, Isleyen A, Sokmen E, Tasoglu I, Aydogdu S, Sen N, McFann K, Johnson RJ, et al. Serum uric acid, inflammation, and nondipping circadian pattern in essential hypertension. J Clin Hypertens. 2013;15(1):7–13. doi: 10.1111/jch.12026. [DOI] [PMC free article] [PubMed] [Google Scholar]
- 60.Glantzounis GK, Tsimoyiannis EC, Kappas AM, Galaris DA. Uric acid and oxidative stress. Curr Pharm Des. 2005;11(32):4145–4151. doi: 10.2174/138161205774913255. [DOI] [PubMed] [Google Scholar]
- 61.Strazzullo P, Puig JG. Uric acid and oxidative stress: relative impact on cardiovascular risk? Nutr Metab Cardiovasc Dis. 2007;17(6):409–414. doi: 10.1016/j.numecd.2007.02.011. [DOI] [PubMed] [Google Scholar]
- 62.Corry DB, Eslami P, Yamamoto K, Nyby MD, Makino H, Tuck ML. Uric acid stimulates vascular smooth muscle cell proliferation and oxidative stress via the vascular renin-angiotensin system. J Hypertens. 2008;26(2):269–275. doi: 10.1097/HJH.0b013e3282f240bf. [DOI] [PubMed] [Google Scholar]
Associated Data
This section collects any data citations, data availability statements, or supplementary materials included in this article.
Data Availability Statement
Data can be accessed via https://charls.pku.edu.cn/zh-CN.