Abstract
Carbon dots (CDs) have attracted tremendous attention for their outstanding advantages in luminescence. Here, α-amino-substituted lysine derivatives with the determined chemical structure were employed as precursors to obtain bright and highly stable fluorescent CDs through a facile hydrothermal route. The relationships among the chemical structure of precursors, CD fluorescence, and particle size were investigated. The results indicated that increased numbers of functional groups in precursors could promote the degree of cross-linking and lead to a smaller size, better fluorescent properties, and stronger stability of CDs. The C-CDs that were prepared from lysine derivatives with most functional groups showed excitation-dependent dual excitation and dual emission (DE2), high-stability luminescence, strong resistance to photobleaching, and high selectivity to Fe3+ and could be used as a sensitive probe for Fe3+ detection.
1. Introduction
Carbon dots (CDs) are a special kind of fluorescent nanoparticles with a diameter less than 10 nm.1,2 CDs have attracted great attention in recent years for their unique properties, such as high aqueous solubility, good biocompatibility, and resistance to photobleaching,3−7 and have been intensively studied in the fields of sensors,8−10 light-emitting devices,11 electrochemical analysis,12 bioimaging,13−15 drug delivery,16 and photocatalysis.17,18 Great effort has been devoted to synthesizing CDs with photostability and photoluminescence (PL).12,19,20 However, a comprehension of the general fluorescence phenomenon still remains unclear, which hinders advances in the design, preparation, and application of CDs.21−23
Typically, there are two main ways to improve the fluorescent properties of CDs. One is to tailor the surface groups of CDs with heteroatoms, such as nitrogen (N), boron (B), chlorine (Cl), sulfur (S), or phosphorus (P),2,24−27 and another way is the modification of polar groups containing carboxyl, hydrophilic hydroxyl, or amino groups.28 Amino acids, inexpensive and biocompatible natural products, have also been used as proper precursors for CD synthesis.24,28,29 Histidine was the first amino acid used as a precursor for the synthesis of CDs, which exhibited intense chemiluminescence and good PL.30−32 Huang et al. prepared CDs from histidine using a one-pot, microwave-assisted hydrothermal method and successfully applied them in cellular imaging and labeling.33
Many carbohydrates are widely used to produce CDs via hydrothermal treatment between 180 and 220 °C.34 The synthesis of fluorescent CDs involves natural resources or polymers or cross-linking of two or more organic molecules.35−38 The composition and surface chemical groups of CDs are crucial to their fluorescence properties,28,39,40 but the precursors and resulting polymer CDs are composed of abundant molecules, oligomers, and polymer clusters and have vast uncertain chemical structure, with the reaction processes usually including many random reactions. These factors hinder the comprehension of the PL mechanism in CDs. Here, four types of lysine derivatives with defined structures were employed as precursors for CD preparation to explore the relationships between the chemical structure of precursors and CD fluorescence. Moreover, the results showed that increased numbers of functional groups in precursors can significantly promote the degree of cross-linking and lead to a smaller size, better fluorescent properties, and stronger stability of CDs. Moreover, the best CDs we have screened out showed excitation-dependent dual excitation and dual emission (DE2), high-stability luminescence, strong resistance to photobleaching, and high selectivity to Fe3+ ions. These findings illuminate that functional groups in the polymer CDs could greatly influence luminescent performance, allowing great potential in various application fields.
2. Results and Discussion
2.1. Relationship between Functional Groups on the Precursor and CD Properties
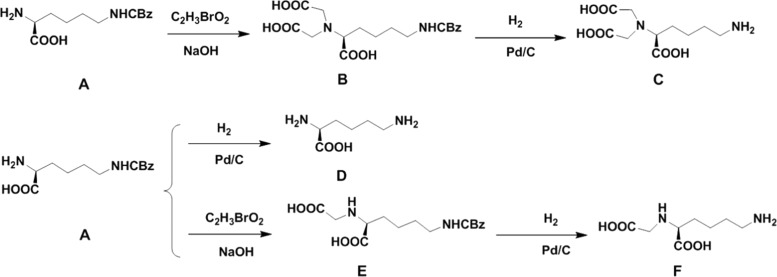
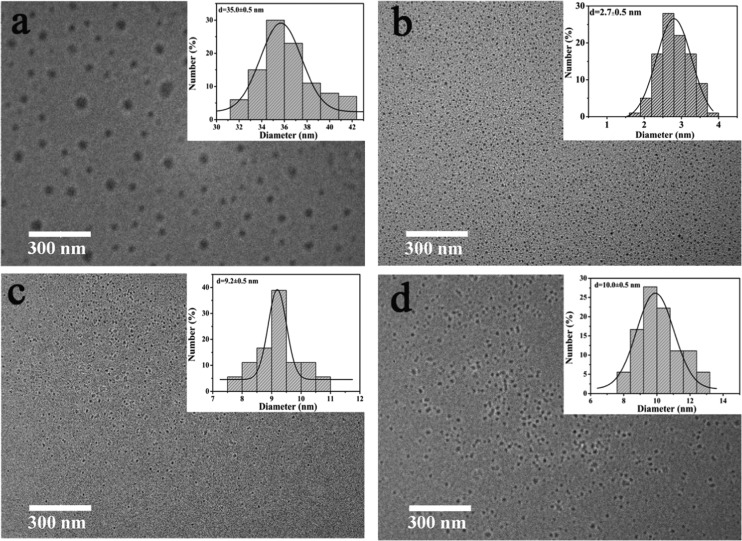
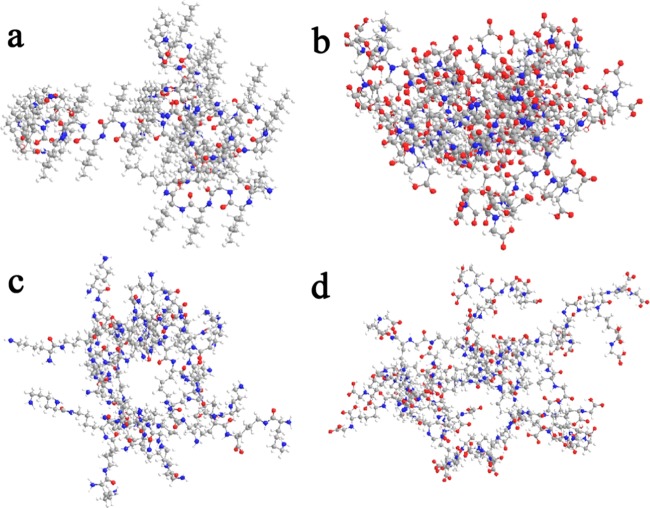
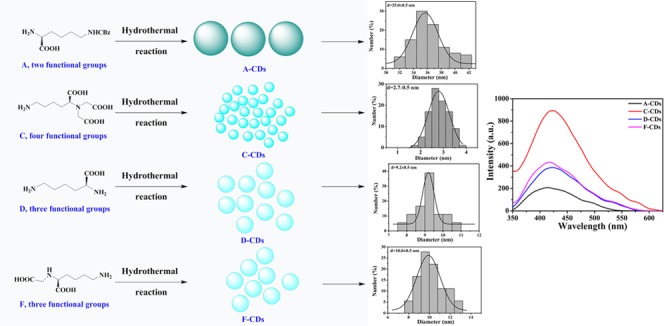
To explore the relationship between the PL property of CDs and the structure of the precursor, four lysine derivatives (compounds A, C, D, and F) containing different numbers of amino and carboxyl groups were designed and synthesized (Scheme 1) as precursors. Thus, four types of polymer CDs were obtained from the corresponding precursors. The transmission electron microscopy (TEM) images of the different CDs (Figure 1) showed the average sizes of the A-CDs, C-CDs, D-CDs, and F-CDs as 35.0 ± 0.5, 2.7 ± 0.5, 9.5 ± 0.5, and 10.0 ± 0.5 nm, respectively. The particle size of the obtained CDs decreased with the increasing number of functional groups on the precursor. Therefore, precursors with more functional groups tend to form a smaller size, and we deduced that more functional groups can cross-link easily and result in more stable and rigid structures. Fitting three-dimensional (3D) structures with the same number of molecules are shown in Figure 2. Generally, only linear macromolecules can be formed from the self-polymerization of compound A (possesses only one amino and one carboxyl group) and then the linear macromolecule can further cross-link through a hydrogen bond to form relatively loose and large CDs. However, precursors D and F each have three active groups, which could lead to a branched macromolecule via the self-polymerization process, further cross-linking the branched macromolecule and potentially resulting in middle-sized CDs with a tight internal structure. With four active groups, the self-polymerization of compound C tends to form a multiple branched macromolecule and further cross-linking of the multiple branched macromolecule could result in smaller CDs with a more rigid and denser internal structure.
Scheme 1. Synthetic Route of Precursors.
Figure 1.
(a) TEM images and size distributions of A-CDs. (b) TEM images and size distributions C-CDs. (c) TEM images and size distributions D-CDs. (d) TEM images and size distributions F-CDs.
Figure 2.
(a) Fitting 3D structure of A-CDs. (b) Fitting 3D structure of C-CDs. (c) Fitting 3D structure of D-CDs. (d) Fitting 3D structure of F-CDs (all fitting 3D structures are composed of 52 precursors).
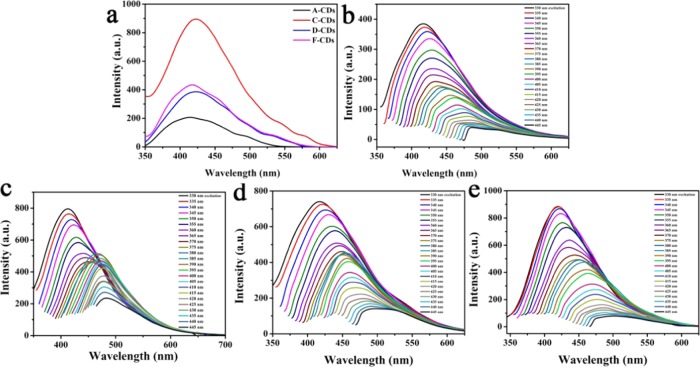
To explore the relationship between the structure and luminescence principle, the PL brightness of the four types of CDs was compared in equal concentrations. As shown in Figure 3a, C-CDs that were prepared from precursor C (four functional groups, one amino and three carboxyl) exhibited the strongest fluorescence intensity, D-CDs and F-CDs both prepared from precursors with three functional groups (two amino and one carboxyl for compound D, one amino and two carboxyl for compound F) showed moderate intensity, and A-CDs prepared from the precursor with the least functional groups (one amino and one carboxyl) exhibited the weakest fluorescence intensity at 330 nm excitation. The increase in functional groups on the precursor was proportional to the fluorescence intensity of the corresponding CDs, which confirmed that increases in the cross-linking reaction could make the rigid structure of the CDs stronger and contribute to the enhancement of luminous power.41
Figure 3.
(a) Fluorescence (FL) spectra of A-CDs, C-CDs, D-CDs, and F-CDs. (b) FL spectra of A-CDs under different excitation wavelengths. (c) FL spectra of C-CDs under different excitation wavelengths. (d) FL spectra of D-CDs under different excitation wavelengths. (e) FL spectra of F-CDs under different excitation wavelengths.
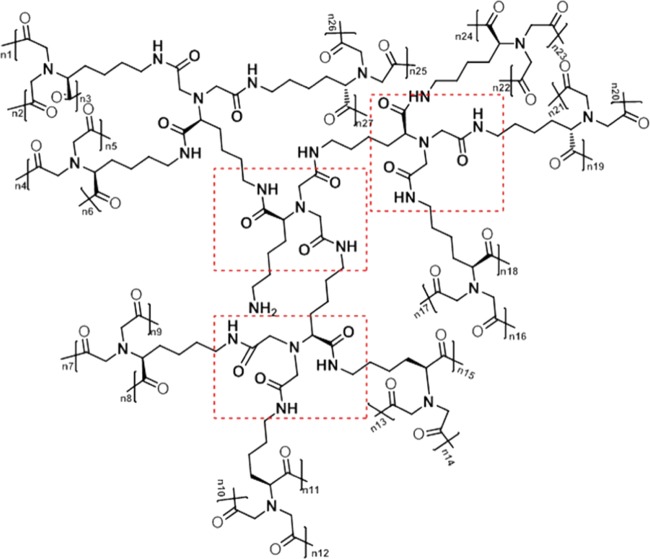
The FL spectra of A-CDs, C-CDs, D-CDs, and F-CDs were also collected at different excitation wavelengths (Figure 3b–e). The corresponding PL emission peaks shifted from 415 to 490 nm for the four CDs, and the fluorescence intensity of the emission peaks decreased with the change in the excitation wavelength from 330 to 445 nm. More interestingly, C-CDs had excitation-dependent DE2 fluorescence. The DE2 fluorescence property may be attributed to the repeated structural units, which may form a specific donor−π–acceptor (D−π–A) architecture (C–N, −NH2, and C–OH as electron-donating groups and C=O as an electron-accepting group) (Figure 4).42
Figure 4.
Repeated structural units as donor−π–acceptor (D−π–A) architectures in the polymerization structure.
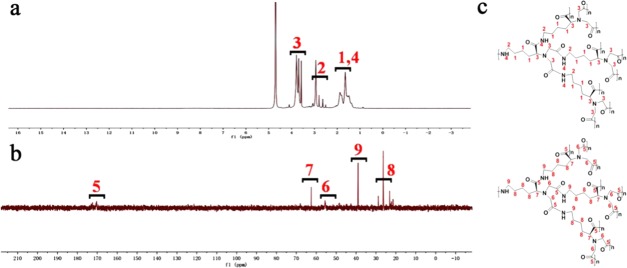
To gain a deeper understanding of the PL mechanism, proton (1H) and carbon (13C) nuclear magnetic resonance (NMR) experiments were performed to provide valuable information regarding the structure of CDs. As shown in Figure 5a, the peaks at 1.2–1.8 ppm represent the hydrogens at 1 and 4, and peaks at 2.69 ppm and 3.3–3.4 ppm represent the hydrogens at 2 and 3 in Figure 5c. The sharp shape of the peaks strongly suggests a compact and static structure. In Figure 5b, the peaks at 173–175 ppm represent the carboxylic carbon atom 5, the peak at 64.8 ppm represents the α-carbon of an amino acid (position 7), the peak at 57.7 ppm represents the α-carbon of amides at position 6, the peak at 42 ppm represents the α-carbon linked with the terminal amino, and the peaks at 23–29 ppm represent the carbon of the alkane. Notably, no hydrogen of alkene or aromatic was found in the NMR spectra, which indicates that the C-CDs are nonconjugated polymers. Furthermore, the high density of sharp signals is related to the variety of static chemical environments that surround these protons and can be explained by the presence of various chain isomers of the repetitive unit that coexist in the polymer,43 as well as the existence of different ionized forms.21 These data highlight the rigid conformations of polymeric CDs.
Figure 5.
(a) 1H NMR of C-CDs. (b) 13C NMR of C-CDs. (c) Structure of C-CDs.
2.2. Characterization of Polymer C-CDs
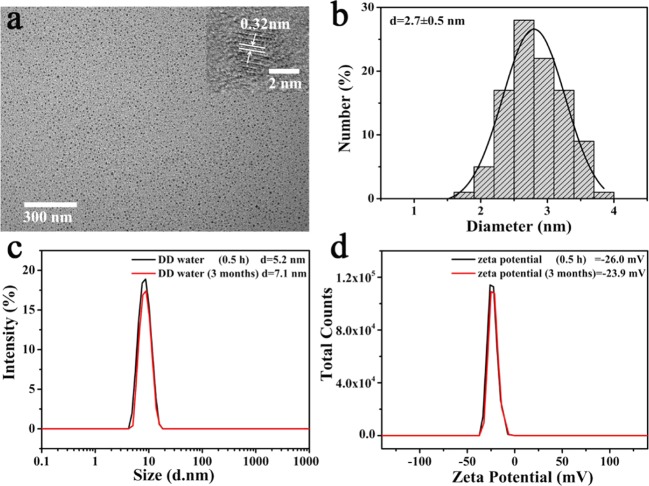
As the best CDs screened out, C-CDs were further studied for fluorescence, stability, pH response, application, etc. The morphology and size of the C-CDs were determined by transmission electron microscopy (TEM). As shown in Figure 6a,b, the C-CDs were well-dispersed particles with an average diameter of 2.7 ± 0.5 nm. The high-resolution TEM (HRTEM) images show that the lattice fringe spacing is 0.32 nm, which is quite close to the (002) diffraction facets of graphite,44,45 indicating that the C-CDs possessed a highly ordered and crystalline structure.
Figure 6.
(a) TEM and HRTEM (inset) images of C-CDs. (b) Size distributions of C-CDs. (c) Dynamic light scattering (DLS) of the C-CDs in DD water. (d) ζ-Potential of the C-CDs in DD water.
The average diameters and ζ-potentials were measured by dynamic light scattering (DLS) in deionized (DI) water. According to Figure 6c, the hydrodynamic diameters were confirmed to be 5.2 and 7.1 nm in water at 0.5 h and 3 months, respectively. The ζ-potentials were −26.0 and −23.9 mV in water at 0.5 h and 3 months, respectively (Figure 6d). A minimal change was observed in the hydrodynamic diameter and ζ-potential, which indicates good colloidal stability of this kind of CDs.46−48
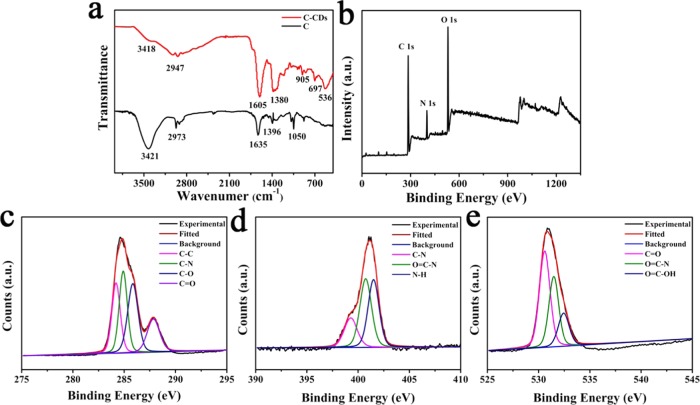
The infrared (IR) spectra of lysine derivative and C-CDs are shown in Figure 7a. The C-CD peaks imply the existence of multiple molecular associations. The amide I vibrational band at 1605 cm–1 is contributed to the peptide bond vibrational modes; their increased peak intensity and shifted position reflect the amide participation in H-bonds that increases the rigidity of the polymer.49 The broader and more intensive peak at 1380 cm–1 also reflects the C–N participation in H-bonds.50 The stretching vibration of O–H at 3418cm–1 also had increased broadness and decreased intensity, showing the dispersion of hydrogen-bond donor groups at the surface of C-CDs.51 More features, such as C–H stretching vibration at 2947 cm–1 can be assigned to the C–H bond.52 Therefore, Fourier transform infrared (FT-IR) spectroscopy indicated that C-CDs are a kind of amide polymers with high involvement of H-bonds, which significantly enhanced the rigidity of the system and contributed greatly to the stability and bright fluorescence.
Figure 7.
(a) FT-IR spectra of compound C and C-CDs. (b) X-ray photoelectron spectroscopy (XPS) survey of C-CDs. (c) C 1s spectra of C-CDs. (d) N 1s spectra of C-CDs. (e) O 1s spectra of C-CDs.
The XPS spectroscopy results for C-CDs (Figure 7b–e) further confirmed the polymer structure feature. The XPS spectra of C-CDs showed three typical peaks of C 1s (at around 284.6 eV), N 1s (at around 397.9 eV), and O 1s (at around 531.6 eV). The deconvolutions of the C 1s reveal the presence of four carbon species of C–C (284.2 eV), C–N (285.7 eV), C–O (286.8 eV), and C=O (288.2 eV).53−55 The N 1s spectra can be deconvolved into three components attributed to C–N (399.5 eV), O=C–N (401.4 eV), and N–H (402.3 eV), and the O 1s peak consists of three components corresponding to C=O (531.5 eV), O=C–N (531.7 eV), and O=C–OH (532.2 eV).21,56−58
2.3. Luminescence Properties of C-CDs
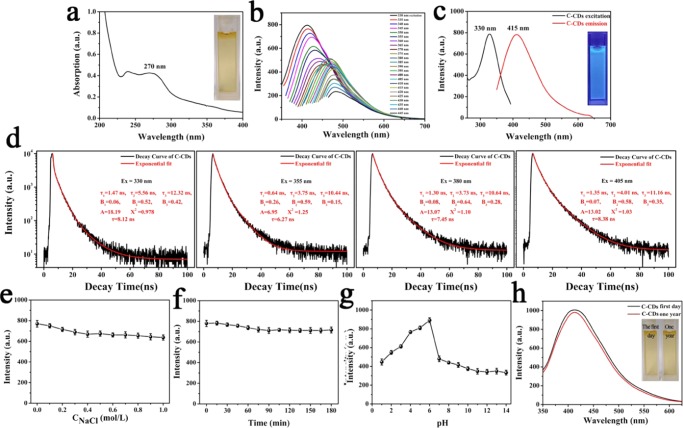
The luminescence properties of C-CDs were analyzed by ultraviolet–visible (UV–vis) and steady-state PL spectroscopy. The UV–vis spectra (Figure 8a) show that C-CDs possess broad absorption from 245 to 290 nm corresponding to the n−π* and π–π* transitions of C=O and C=N bonds in carbon cores.13,59
Figure 8.
(a) UV–vis spectra of C-CDs (inset, photographs taken under visible light). (b) FL spectra of C-CDs under different excitation wavelengths. (c) Optimal excitation and emission PL spectra (inset, photographs taken under 365 nm UV light). (d) Fluorescence lifetimes at different excitation wavelengths Ex = 330, 355, 380, and 405 nm of the C-CDs. (e) Effect of ionic strengths on the fluorescence intensity of C-CDs (ionic strengths were controlled by various concentrations of NaCl in the aqueous solution). (f) Effect of time intervals of irradiation with a UV lamp on fluorescence intensity of C-CDs. (g) Effect of pH on the fluorescence intensity of C-CDs. (h) Effects of storage time on the fluorescence intensity of the C-CDs. The insets in (h) show the photographs of the C-CD aqueous solution on the first day and 1 year later. The results are the average and standard deviation over four replicates of the measurements.
Subsequently, the PL properties of the C-CDs were studied thoroughly. As the excitation wavelength changed from 330 to 380 nm, the corresponding PL emission peak shifted from 415 to 450 nm and the intensity decreased gradually. However, once the excitation wavelength was changed to 385 nm, the fluorescence intensity at 465 nm was remarkably enhanced and the PL emission peak red-shifted from 465 to 485 nm with excitation wavelengths ranging from 385 to 445 nm (Figure 8b). Notably, the C-CDs exhibited an excitation-dependent dual excitation and dual emission (DE2) fluorescence. It is very different from the previously reported CDs, the PL property of which is usually significantly decreased when shifting the excitation wavelength.13,45,59 The PL spectra of C-CDs may result from the multiple electronic absorption transitions. As shown in Figure 8c, the PL revealed that the optimal excitation and emission peaks of C-CDs are at 330 and 415 nm, respectively.
The nature of the PL was further investigated by the PL lifetimes. Figure 8d shows the fluorescence decay curve and the exponential fitting curve of C-CDs recorded at room temperature in an aqueous solution. A is a constant background; B1, B2, and B3 are fractional intensities; and τ1, τ2, and τ3 are fluorescence lifetimes. By fitting the data with an exponential decay function (red lines), the radiative decays of C-CDs are 8.12 ns (Ex = 330 nm), 6.27 ns (Ex = 355 nm), 7.45 ns (Ex = 380 nm), and 8.38 ns (Ex = 405 nm). The quantum yield of C-CDs was also tested and calculated (Table 1). The absolute quantum yields of C-CDs were 7.75% (Ex = 330 nm) and 3.56% (Ex = 380 nm). By way of comparison, the absolute quantum yields of A-CDs, D-CDs, and F-CDs (Ex = 330 nm) were 1.76, 3.35, and 3.74%, respectively.
Table 1. Average Lateral Size; C, N, and O Contents; and QY of the C-CDs.
| sample | size (nm) | C (%) | N (%) | O (%) | QY (%) Ex = 330 nm | QY (%) Ex = 380 nm |
|---|---|---|---|---|---|---|
| C-CDs | 2.7 ± 0.5 | 64.07 | 10.8 | 25.13 | 7.75 | 3.56 |
We further investigated the luminescence properties of C-CDs under different conditions. As shown in Figure 8e, the fluorescence of C-CDs showed only a slight change even when increasing the concentration of the NaCl aqueous solution to 1000 mM, which reflects that the C-CDs had a strong resistance to high-ionic-strength conditions. Furthermore, the fluorescence intensity of C-CDs remained unchanged after 3 h UV irradiation, indicating that the C-CDs are highly resistant to photobleaching (Figure 8f).
At last, the fluorescence response to the pH experiment was investigated. In Figure 8g, we find that the maximum fluorescence intensity of C-CDs appeared at pH 6 and a sudden decrease in the emission of C-CDs appeared in both basic and acidic conditions. The results could be ascribed to the carboxylic acid protonation–deprotonation, indicating that H-bonds in the polymer C-CDs played an important role in the interaction from which the fluorescence originated.21,60
Stability is one of the greatest challenges for nanomaterials, and most ultrasmall nanoparticles tend to minimize their surface energy by aggregation, which results in a significant decrease in fluorescence.2 Fortunately, we found that the appearance and luminescence properties of the C-CDs are nearly constant even after the sample was stored for 1 year at 4 °C. Therefore, they possess excellent stability (Figure 8h).
2.4. Application of C-CDs for Metal Sensing
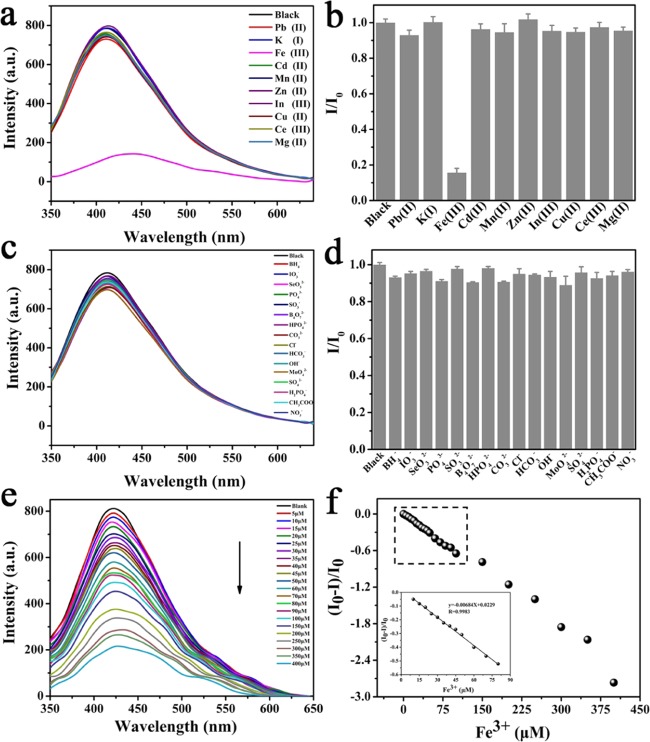
The feasibility of C-CDs as nanoprobes for the detection of representative metal ions (Pb2+, Hg+, K+, Fe3+, Cd2+, Mn2+, Zn2+, In3+, Cu2+, Ce3+, and Mg2+) and anions (NaxA, Ax– = BH4–, IO3–, SeO32–, PO43–, SO32–, B4O72–, HPO42–, CO32–, Cl–, HCO3–, OH–, MoO42–, SO42–, H2PO4–, CH3COO–, and NO3–) was investigated with a reported method.61 A significant PL quenching effect was observed when Fe3+ was added to the C-CD solution (Figure 9a,b), indicating C-CDs are a sensitive and selective probe for Fe3+ detection. However, no significant change of fluorescence was observed when anion solutions were added to the C-CD solution (Figure 9c,d).
Figure 9.
(a) Emission spectra of the C-CD solution in the presence of 190 μM concentration of Pb2+, K+, Fe3+, Cd2+, Mn2+, Zn2+, In3+, Cu2+, Ce3+, and Mg2+. (b) Relative fluorescence intensity of C-CDs (where I and I0 are the intensities in the presence and absence of the metal ions, respectively). (c) Emission spectra of C-CD solution in the presence of 190 μM concentration of BH4–, IO3–, SeO32–, PO43–, SO32–, B4O72–, HPO42–, CO32–, Cl–, HCO3–, OH–, MoO42–, SO42–, H2PO4–, CH3COO–, and NO3–. (d) Relative fluorescence intensity of C-CDs (where I and I0 are the intensities in the presence and absence of the anions ions, respectively). (e) Quenching of the fluorescence intensity of the C-CD solution in different concentrations of the Fe3+ solution. (f) Plot of (I0 – I)/I0 with different Fe3+ concentrations. Ex = 330 nm; Em = 415 nm; and slit widths of both excitation and emission = 2.5. The results are the average and standard deviation of four replicates of the measurements.
Therefore, there may be a special coordination between the Fe3+ ion and the carboxyl or hydroxyl group on the surface of C-CDs.33,62 Next, the sensitivity of C-CDs toward the Fe3+ ion concentration was explored by a fluorescence quenching experiment. Moreover, we found that the fluorescence intensity decreased with an increase in Fe3+ concentration (Figure 9e). Figure 9f further shows a linear relationship of (I0 – I)/I0 = −0.00684C + 0.0229, where I0 and I are the fluorescence intensities of C-CDs in the absence and presence of Fe3+, respectively. The linear correlation coefficient was 0.9983 in the range of 10–80 μM, and the detection limit was as low as 0.006 μM.63 The detection of C-CDs for Fe3+ was compared with previous reports (Table 2). It indicates that C-CDs can be used as a potential candidate for a highly sensitive and specific probe for Fe3+ detection.
Table 2. Comparison of the Sensing Performance of Different Fluorescent Probes and C-CDs for Fe3+ Detection.
| fluorescence probes | detection limit (μM) | linear range (μM) | refs |
|---|---|---|---|
| carbon dots | 2.9 | 0–250 | (64) |
| carbon dots | 0.7 | 5–80 | (65) |
| carbon dots | 0.5 | 5–100 | (66) |
| carbon dots | 1.3 | 2–50 | (67) |
| N-carbon dots | 4.67 | 5–1280 | (68) |
| P-carbon dots | 0.005 | 0–20 | (69) |
| N-carbon dots | 0.025 | 0.1–500 | (70) |
| carbon dots | 0.239 | 0–80 | (61) |
| C-CDs | 0.006 | 10–80 | this work |
3. Conclusions
In summary, the influence of functional groups of the precursor on CDs’ property was studied in this article. Also, the results indicated that an increase in the numbers of functional groups in the precursor could significantly promote the degree of cross-linking, which tends to lead to CDs with a smaller size, enhanced fluorescence intensity, and high stability. The study also showed that the insensitive and stable PL of CDs results from high cross-linking and the formation of H-bonds, which makes the rigid structure of the CDs stronger and significantly enhances the luminous power. Further study demonstrated that the obtained C-CDs possess high resistance to photobleaching, high stability, and bright fluorescence and could be used as a sensitive and selective probe for Fe3+ sensing.
4. Materials and Methods
4.1. Materials
Lys (Z)-OH (compound A, C14H20N2O4, >98.0%) were bought from Shanghai Hanhong Chemical Co. Ltd. Bromoacetic acid (C2H3BrO2, >99%) was bought from Sahn Chemical Technology (Shanghai) Co. Ltd. Sodium hydroxide (NaOH, >98.0%) and methyl alcohol (CH3OH, ≥99.5%) were bought from Tianjin Deen Chemical Reagent Co. Ltd. Hydrochloric acid (HCl, wt % 36.0–38.0) was bought from Zhengzhou Penny Chemical Reagent Factory.
4.2. Sample Preparation
4.2.1. Synthesis of B
H-Lys (Z)-OH (A, 6 g) was dissolved in 75 mL of NaOH aqueous solution (1.5 M). Bromoacetic acid (12.5 g) was dissolved in the NaOH aqueous solution (1.5 M, 45 mL) and cooled to 0 °C. The H-Lys (Z)-OH solution was slowly added into the bromoacetic acid solution under an ice bath, and the mixed solution was stirred at 0 °C for 2 h, 20 °C for 48 h, and 50 °C for 2 h. HCl (120 mL, 1 M) was added to the reaction mixture and white solid precipitated; the precipitate was filtered and dried under vacuum to obtain product B.
1H NMR δ (400 MHz, CD3OD): 7.38–7.28 (5H, m), 5.06 (2H, s), 3.62 (4H, ABq), 3.46 (1H, dd), 3.12 (2H, t), 1.87–1.37 (6H, m).
HR-MS (ESI) calcd for C18H25N2O8 (M + H)+: 397.1611, found: 397.1607.
4.2.2. Synthesis of C
Product B (2 g) and Pd/C (5%, 1 g) were dispersed in 40 mL of methanol in a round flask. The flask was filled with hydrogen and sealed. The reaction mixture was stirred at 25 °C for 12 h and filtered. The solid obtained was dissolved in 30 mL of ultrapure water and stirred for 30 min at 25 °C. The solution was filtered again to remove Pd/C, the obtained mother liquor was evaporated in vacuum to dryness, and the solid was washed with methanol and dried under vacuum to obtain product C.
1H NMR δ (400 MHz, DMSO-d6): δ 1.35–1.63 (6H, m), 2.75 (2H, s), 3.21–3.31 (5H, m).
HR-MS (ESI) calcd for C10H19N2O6 (M + H)+: 263.1243, found: 263.1237.
4.2.3. Synthesis of C-CDs
A total of 100 mg of precursor was dissolved in 10 mL of ultrapure water and stirred for 5 min at room temperature to obtain a clean solution. The solution was transferred to a 25 mL poly(tetrafluoroethylene) (PTFE)-lined reaction autoclave and heated at a constant temperature of 180 °C for 720 min. The autoclave was then cooled to room temperature. The suspension was filtered through a 0.22 mm microporous membrane, and the solution was further centrifugated at high speed (10 000 rpm, 10 min) to remove impurities and large particles. The C-CDs were obtained through vacuum freeze-drying, and the yield is 89.6%.
4.3. Characterization
The morphology of each product was observed by a HITACHI SU8010 field-emission scanning electron microscope (FESEM) and a JEOL JEL-2010 high-resolution transmission electron microscope (HRTEM). Dynamic light scattering and ζ-potential were analyzed on a Nano-ZS ZEN 3600 (Malvern Instruments, Germany). XPS was carried out on a Thermo Fisher Scientific ESCALAB250Xi. Fourier transform infrared (FT-IR) spectra were recorded on a Bio-Rad FTS-40 spectrometer. The UV–vis absorption spectra of liquid samples were recorded on a Cary 100 (Agilent Technologies). An LS-55 fluorescence spectrophotometer (PerkinElmer) was used to collect PL. PL lifetimes were determined using an FLS 980 spectrometer with an actuator.
4.4. Ion Strength Stability of C-CDs
First, 10 mg/mL C-CD solution was prepared. The test solutions were prepared by adding 0.1 mL of as-prepared C-CD solution to 2.9 mL of NaCl solution (NaCl solution concentrations: 0, 0.1, 0.2, 0.3, 0.4, 0.5, 0.6, 0.7, 0.8, 0.9, and 1.0 mol/L). Finally, the fluorescence emission was measured with both excitation and emission slit widths set at 2.5 nm. Every test was repeated 3 times to ensure the accuracy of the test data.
4.5. Resistance to Photobleaching
The C-CD (0.1 mL, 10 mg/mL) solution was added to 2.9 mL of secondary distilled water and allowed to stand for 20 min at 25 °C. The corresponding PL spectrum was recorded every 15 min under UV light, and the total irradiation time was 3 h.
4.6. Effect of pH on CD Fluorescence
Briefly, 0.1 mL of C-CD solution (10 mg/mL) was added to 2.9 mL of HCl or NaOH solutions to prepare the test solution (pH = 1–14). The mixture was vibrated for 5 min before the fluorescence spectra were recorded. Both excitation and emission slit widths were set at 2.5 nm. Every test was repeated 3 times to ensure the accuracy of the test data.
4.7. Ion Sensing
Briefly, many kinds of metal chlorides were added to the Tris–HCl buffer (10 mM, pH = 7.4) to form a 200 μM metal ion solution (Pb2+, K+, Fe3+, Cd2+, Mn2+, Zn2+, In3+, Cu2+, Ce3+, and Mg2+). Then, C-CDs were added to the Tris–HCl buffer (10 mM, pH = 7.4) to form a 10 mg/mL C-CD solution. Finally, 2.9 mL of ion solutions was mixed with 0.1 mL of C-CD solution. The mixture was vibrated for 5 min before the fluorescence spectra were recorded.
The same methods were employed to measure the fluorescence quenching ability of anions (NaxA, Ax– = BH4–, IO3–, SeO32–, PO43–, SO32–, B4O72–, HPO42–, CO32–, Cl–, HCO3–, OH–, MoO42–, SO42–, H2PO4–, CH3COO–, and NO3–) on C-CDs. Every test was repeated three times to ensure the accuracy of the test data.
Acknowledgments
This work was financially supported by the National Natural Science Foundation of China (U1904196, 21505033, 21571053, and 21927805), China Postdoctoral Science Foundation (2018M642755), Key Scientific Research Projects of Colleges and Universities in Henan Province (19A350004), and Key Scientific and Technological Project of Henan Province (172102310618).
Supporting Information Available
The Supporting Information is available free of charge at https://pubs.acs.org/doi/10.1021/acsomega.0c00510.
Methods for the synthesis of compounds D–F and methods for the synthesis of A-CDs, D-CDs, and F-CDs (PDF)
Author Contributions
§ S.Y. and Y.Z. equally contributed to this work.
The authors declare no competing financial interest.
Supplementary Material
References
- Atabaev T. S. Doped Carbon Dots for Sensing and Bioimaging Applications: A Minireview. Nanomaterials 2018, 8, 342 10.3390/nano8050342. [DOI] [PMC free article] [PubMed] [Google Scholar]
- Huang Y.; Cheng Z. Simple and Green Synthesis of Boron-, Sulfur-, and Nitrogen-Co-Doped Carbon Dots as Fluorescent Probe for Selective and Sensitive Detection of Sunset Yellow. Nano 2017, 12, 1750123 10.1142/S1793292017501235. [DOI] [Google Scholar]
- Crista D. M. A.; Mello G. P. C.; Shevchuk O.; Sendao R. M. S.; Simoes E. F. C.; Leitao J. M. M.; da Silva L. P.; Esteves da Silva J. C. G. 3-Hydroxyphenylboronic Acid-Based Carbon Dot Sensors for Fructose Sensing. J. Fluoresc. 2019, 29, 265–270. 10.1007/s10895-018-02336-2. [DOI] [PubMed] [Google Scholar]
- Kalaiyarasan G.; Joseph J. Determination of vitamin B12 via pH-dependent quenching of the fluorescence of nitrogen doped carbon quantum dots. Microchim. Acta 2017, 184, 3883–3891. 10.1007/s00604-017-2421-y. [DOI] [Google Scholar]
- Kalaiyarasan G.; Joseph J. Cholesterol derived carbon quantum dots as fluorescence probe for the specific detection of hemoglobin in diluted human blood samples. Mater. Sci. Eng., C 2019, 94, 580–586. 10.1016/j.msec.2018.10.007. [DOI] [PubMed] [Google Scholar]
- Monteiro-Riviere N. A.; Inman A. O.; Zhang L. W. Limitations and relative utility of screening assays to assess engineered nanoparticle toxicity in a human cell line. Toxicol. Appl. Pharmacol. 2009, 234, 222–235. 10.1016/j.taap.2008.09.030. [DOI] [PubMed] [Google Scholar]
- Wei G.; Zhao Z.; Du J.; Li P.; Sun Z.; Huo L.; Gao Y. Reed-derived fluorescent carbon dots as highly selective probes for detecting Fe3+ and excellent cell-imaging agents. RSC Adv. 2019, 9, 21715–21723. 10.1039/C9RA01841G. [DOI] [PMC free article] [PubMed] [Google Scholar]
- Lim S. Y.; Shen W.; Gao Z. Carbon quantum dots and their applications. Chem. Soc. Rev. 2015, 44, 362–381. 10.1039/C4CS00269E. [DOI] [PubMed] [Google Scholar]
- Huang H.; Weng Y.; Zheng L.; Yao B.; Weng W.; Lin X. Nitrogen-doped carbon quantum dots as fluorescent probe for “off-on” detection of mercury ions, l-cysteine and iodide ions. J. Colloid Interface Sci. 2017, 506, 373–378. 10.1016/j.jcis.2017.07.076. [DOI] [PubMed] [Google Scholar]
- Lu X.; Chen L.; Zhimin W.; Junyi Y.; Mengjing X.; Jun D.; Ping W.; Jiangjiang G.; Feifei C. Nitrogen-Doped Carbon Nanoparticles Derived from Silkworm Excrement as On-Off-On Fluorescent Sensors to Detect Fe(III) and Biothiols. Nanomaterials 2018, 8, 443 10.3390/nano8060443. [DOI] [PMC free article] [PubMed] [Google Scholar]
- Yuan F.; Wang Z.; Li X.; Li Y.; Tan Z. a.; Fan L.; Yang S. Light-Emitting Diodes: Bright Multicolor Bandgap Fluorescent Carbon Quantum Dots for Electroluminescent Light-Emitting Diodes (Adv. Mater. 3/2017). Adv. Mater. 2017, 29, 1604436 10.1002/adma.201604436. [DOI] [PubMed] [Google Scholar]
- Nekoueian K.; Amiri M. o.; Sillanpaa M.; Marken F.; Boukherroub R.; Szunerits S. Carbon-based quantum particles: an electroanalytical and biomedical perspective. Chem. Soc. Rev. 2019, 48, 4281–4316. 10.1039/C8CS00445E. [DOI] [PubMed] [Google Scholar]
- Ding H.; Wei J.-S.; Zhang P.; Zhou Z.-Y.; Gao Q.-Y.; Xiong H.-M. Solvent-Controlled Synthesis of Highly Luminescent Carbon Dots with a Wide Color Gamut and Narrowed Emission Peak Widths. Small 2018, 14, 1800612 10.1002/smll.201800612. [DOI] [PubMed] [Google Scholar]
- Liu H.; Wang X.; Wang H.; Nie R. Synthesis and biomedical applications of graphitic carbon nitride quantum dots. J. Mater. Chem. B 2019, 7, 5432–5448. 10.1039/C9TB01410A. [DOI] [PubMed] [Google Scholar]
- Sinha A.; Dhanjai; Jain R.; Zhao H.; Karolia P.; Jadon N. Voltammetric sensing based on the use of advanced carbonaceous nanomaterials: a review. Microchim. Acta 2018, 185, 89 10.1007/s00604-017-2626-0. [DOI] [PubMed] [Google Scholar]
- Wang H.; Chen Q.; Zhou S. Carbon-based hybrid nanogels: a synergistic nanoplatform for combined biosensing, bioimaging, and responsive drug delivery. Chem. Soc. Rev. 2018, 47, 4198–4232. 10.1039/C7CS00399D. [DOI] [PubMed] [Google Scholar]
- Yu H.; Shi R.; Zhao Y.; Waterhouse G. I. N.; Wu L.-Z.; Tung C.-H.; Zhang T. Smart Utilization of Carbon Dots in Semiconductor Photocatalysis. Adv. Mater. 2016, 28, 9454–9477. 10.1002/adma.201602581. [DOI] [PubMed] [Google Scholar]
- Han M.; Zhu S.; Lu S.; Song Y.; Feng T.; Tao S.; Liu J.; Yang B. Recent progress on the photocatalysis of carbon dots: Classification, mechanism and applications. Nano Today 2018, 19, 201–218. 10.1016/j.nantod.2018.02.008. [DOI] [Google Scholar]
- Song Y.; Yan X.; Li Z.; Qu L.; Zhu C.; Ye R.; Li S.; Du D.; Lin Y. Highly photoluminescent carbon dots derived from linseed and their applications in cellular imaging and sensing. J. Mater. Chem. B 2018, 6, 3181–3187. 10.1039/C8TB00116B. [DOI] [PubMed] [Google Scholar]
- Omer K. M.; Hama Aziz K. H.; Salih Y. M.; Tofiq D. I.; Hassan A. Q. Photoluminescence enhancement via microwave irradiation of carbon quantum dots derived from solvothermal synthesis of l-arginine. New J. Chem. 2019, 43, 689–695. 10.1039/C8NJ04788J. [DOI] [Google Scholar]
- Vallan L.; Urriolabeitia E. P.; Ruiperez F.; Matxain J. M.; Canton-Vitoria R.; Tagmatarchis N.; Benito A. M.; Maser W. K. Supramolecular-Enhanced Charge Transfer within Entangled Polyamide Chains as the Origin of the Universal Blue Fluorescence of Polymer Carbon Dots. J. Am. Chem. Soc. 2018, 140, 12862–12869. 10.1021/jacs.8b06051. [DOI] [PubMed] [Google Scholar]
- Yang P.; Zhu Z.; Zhang T.; Chen M.; Cao Y.; Zhang W.; Wang X.; Zhou X.; Chen W. Facile synthesis and photoluminescence mechanism of green emitting xylose-derived carbon dots for anti-counterfeit printing. Carbon 2019, 146, 636–649. 10.1016/j.carbon.2019.02.028. [DOI] [Google Scholar]
- Liu Y.; Li W.; Wu P.; Ma C.; Wu X.; Xu M.; Luo S.; Xu Z.; Liu S. Hydrothermal synthesis of nitrogen and boron co-doped carbon quantum dots for application in acetone and dopamine sensors and multicolor cellular imaging. Sens. Actuators, B 2019, 281, 34–43. 10.1016/j.snb.2018.10.075. [DOI] [Google Scholar]
- Niu F.; Xu Y.; Liu J.; Song Z.; Liu M.; Liu J. Controllable electrochemical/electroanalytical approach to generate nitrogen-doped carbon quantum dots from varied amino acids: pinpointing the utmost quantum yield and the versatile photoluminescent and electrochemiluminescent applications. Electrochim. Acta 2017, 236, 239–251. 10.1016/j.electacta.2017.03.085. [DOI] [Google Scholar]
- Zhou J.; Shan X.; Ma J.; Gu Y.; Qian Z.; Chen J.; Feng H. Facile Synthesis of P-Doped Carbon Quantum Dots with Highly Efficient Photoluminescence. RSC Adv. 2014, 4, 5465–5468. 10.1039/c3ra45294h. [DOI] [Google Scholar]
- Liu Y.; Gong X.; Gao Y.; Song S.; Wu X.; Shuang S.; Dong C. Carbon-based dots co-doped with nitrogen and sulfur for Cr(VI) sensing and bioimaging. RSC Adv. 2016, 6, 28477–28483. 10.1039/C6RA02653B. [DOI] [Google Scholar]
- Barman M. K.; Jana B.; Bhattacharyya S.; Patra A. Photophysical Properties of Doped Carbon Dots (N, P, and B) and Their Influence on Electron/Hole Transfer in Carbon Dots–Nickel (II) Phthalocyanine Conjugates. J. Phys. Chem. C 2014, 118, 20034–20041. 10.1021/jp507080c. [DOI] [Google Scholar]
- Yan F.; Jiang Y. X.; Sun X. D.; Bai Z. J.; Zhang Y.; Zhou X. G. Surface modification and chemical functionalization of carbon dots: a review. Microchim. Acta 2018, 185, 424 10.1007/s00604-018-2953-9. [DOI] [PubMed] [Google Scholar]
- Pei S.; Zhang J.; Gao M.; Wu D.; Yang Y.; Liu R. A facile hydrothermal approach towards photoluminescent carbon dots from amino acids. J. Colloid Interface Sci. 2015, 439, 129–133. 10.1016/j.jcis.2014.10.030. [DOI] [PubMed] [Google Scholar]
- Jiang J.; He Y.; Li S.; Cui H. Amino acids as the source for producing carbon nanodots: microwave assisted one-step synthesis, intrinsic photoluminescence property and intense chemiluminescence enhancement. Chem. Commun. 2012, 48, 9634–9636. 10.1039/c2cc34612e. [DOI] [PubMed] [Google Scholar]
- Wang X.; Gao T.; Yang M.; Zhao J.; Jiang F.-L.; Liu Y. Microwave-assisted synthesis, characterization, cell imaging of fluorescent carbon dots using L-asparagine as precursor. New J. Chem. 2019, 43, 3323–3331. 10.1039/C8NJ05421E. [DOI] [Google Scholar]
- Dai H.; Shi Y.; Wang Y.; Sun Y.; Hu J.; Ni P.; Li Z. A carbon dot based biosensor for melamine detection by fluorescence resonance energy transfer. Sens. Actuators, B 2014, 202, 201–208. 10.1016/j.snb.2014.05.058. [DOI] [Google Scholar]
- Huang H.; Chunguang L.; Shoujun Z.; Hailong W.; Cailing C.; Zhaorui W.; Tianyu B.; Zhan S.; Shouhua F. Histidine-derived nontoxic nitrogen-doped carbon dots for sensing and bioimaging applications. Langmuir 2014, 30, 13542–13548. 10.1021/la503969z. [DOI] [PubMed] [Google Scholar]
- Peng H.; Travas-Sejdic J. Simple Aqueous Solution Route to Luminescent Carbogenic Dots from Carbohydrates. Chem. Mater. 2009, 21, 5563–5565. 10.1021/cm901593y. [DOI] [Google Scholar]
- Wang C.; Sun D.; Zhuo K.; Zhang H.; Wang J. Simple and green synthesis of nitrogen-, sulfur-, and phosphorus-co-doped carbon dots with tunable luminescence properties and sensing application. RSC Adv. 2014, 4, 54060–54065. 10.1039/C4RA10885J. [DOI] [Google Scholar]
- Sun D.; Ban R.; Zhang P.-H.; Wu G.-H.; Zhang J.-R.; Zhu J.-J. Hair fiber as a precursor for synthesizing of sulfur- and nitrogen-co-doped carbon dots with tunable luminescence properties. Carbon 2013, 64, 424–434. 10.1016/j.carbon.2013.07.095. [DOI] [Google Scholar]
- Sharma A.; Das J. Small molecules derived carbon dots: synthesis and applications in sensing, catalysis, imaging, and biomedicine. J. Nanobiotechnol. 2019, 17, 92 10.1186/s12951-019-0525-8. [DOI] [PMC free article] [PubMed] [Google Scholar]
- Gao J.; Zhu M.; Huang H.; Liu Y.; Kang Z. Advances, challenges and promises of carbon dots. Inorg. Chem. Front. 2017, 4, 1963–1986. 10.1039/C7QI00614D. [DOI] [Google Scholar]
- Styers-Barnett D. J.; Ellison S. P.; Mehl B. P.; Westlake B. C.; House R. L.; Park C.; Wise K. E.; Papanikolas J. M. Exciton dynamics and biexciton formation in single-walled carbon nanotubes studied with femtosecond transient absorption spectroscopy. J. Phys. Chem. C 2008, 112, 4507–4516. 10.1021/jp7099256. [DOI] [Google Scholar]
- Gao G.; Jiang Y.-W.; Jia H.-R.; Yang J.; Wu F.-G. On-off-on fluorescent nanosensor for Fe3+ detection and cancer/normal cell differentiation via silicon-doped carbon quantum dots. Carbon 2018, 134, 232–243. 10.1016/j.carbon.2018.02.063. [DOI] [Google Scholar]
- Zhu S.; Song Y.; Shao J.; Zhao X.; Yang B. Non-Conjugated Polymer Dots with Crosslink-Enhanced Emission in the Absence of Fluorophore Units. Angew. Chem., Int. Ed. 2015, 54, 14626–14637. 10.1002/anie.201504951. [DOI] [PubMed] [Google Scholar]
- Liu K.-K.; Song S.-Y.; Sui L.-Z.; Wu S.-X.; Jing P.-T.; Wang R.-Q.; Li Q.-Y.; Wu G.-R.; Zhang Z.-Z.; Yuan K.-J.; Shan C.-X. Efficient Red/Near-Infrared-Emissive Carbon Nanodots with Multiphoton Excited Upconversion Fluorescence. Advanced. Science 2019, 6, 1900766 10.1002/advs.201900766. [DOI] [PMC free article] [PubMed] [Google Scholar]
- Pan D.; Zhang J.; Li Z.; Wu C.; Yan X.; Wu M. Observation of pH-, solvent-, spin-, and excitation-dependent blue photoluminescence from carbon nanoparticles. Chem. Commun. 2010, 46, 3681–3683. 10.1039/c000114g. [DOI] [PubMed] [Google Scholar]
- Molaei M. J. A review on nanostructured carbon quantum dots and their applications in biotechnology, sensors, and chemiluminescence. Talanta 2019, 196, 456–478. 10.1016/j.talanta.2018.12.042. [DOI] [PubMed] [Google Scholar]
- Dong Y.; Pang H.; Yang H. B.; Guo C.; Shao J.; Chi Y.; Li C. M.; Yu T. Carbon-Based Dots Co-doped with Nitrogen and Sulfur for High Quantum Yield and Excitation-Independent Emission. Angew. Chem., Int. Ed. 2013, 52, 7800–7804. 10.1002/anie.201301114. [DOI] [PubMed] [Google Scholar]
- Nikam D. S.; Jadhav S. V.; Khot V. M.; Ningthoujam R. S.; Hong C. K.; Mali S. S.; Pawar S. H. Colloidal stability of polyethylene glycol functionalized Co0.5Zn0.5Fe2O4 nanoparticles: effect of pH, sample and salt concentration for hyperthermia application. RSC Adv. 2014, 4, 12662–12671. 10.1039/c3ra47319h. [DOI] [Google Scholar]
- Fuller M.; Ingo K. Polyelectrolyte-Coated Gold Nanoparticles: The Effect of Salt and Polyelectrolyte Concentration on Colloidal Stability. Polymers 2018, 10, 1336 10.3390/polym10121336. [DOI] [PMC free article] [PubMed] [Google Scholar]
- Nooney R. I.; White A.; O’Mahony C.; O’Connell C.; Kelleher S. M.; Daniels S.; McDonagh C. Investigating the colloidal stability of fluorescent silica nanoparticles under isotonic conditions for biomedical applications. J. Colloid Interface Sci. 2015, 456, 50–58. 10.1016/j.jcis.2015.05.051. [DOI] [PubMed] [Google Scholar]
- Yang H.; Yang S.; Kong J.; Dong A.; Yu S. Obtaining information about protein secondary structures in aqueous solution using Fourier transform IR spectroscopy. Nat. Protoc. 2015, 10, 382–396. 10.1038/nprot.2015.024. [DOI] [PubMed] [Google Scholar]
- Wang H.; Sun C.; Chen X.; Zhang Y.; Colvin V. L.; Rice Q.; Seo J.; Feng S.; Wang S.; Yu W. W. Excitation wavelength independent visible color emission of carbon dots. Nanoscale 2017, 9, 1909–1915. 10.1039/C6NR09200D. [DOI] [PMC free article] [PubMed] [Google Scholar]
- Jiang Z.; Nolan A.; Walton J. G. A.; Lilienkampf A.; Zhang R.; Bradley M. Photoluminescent Carbon Dots from 1,4-Addition Polymers. Chem. - Eur. J. 2014, 20, 10926–10931. 10.1002/chem.201403076. [DOI] [PubMed] [Google Scholar]
- Kansiz M.; Heraud P.; Wood B.; Burden F.; Beardall J.; McNaughton D. Fourier Transform Infrared microspectroscopy and chemometrics as a tool for the discrimination of cyanobacterial strains. Phytochemistry 1999, 52, 407–417. 10.1016/S0031-9422(99)00212-5. [DOI] [Google Scholar]
- Pacquiao M. R.; Mark Daniel G. d. L.; Nichaphat T.; Sumana K.; Peerasak P. Highly fluorescent carbon dots from enokitake mushroom as multi-faceted optical nanomaterials for Cr6+ and VOC detection and imaging applications. Appl. Surf. Sci. 2018, 453, 192–203. 10.1016/j.apsusc.2018.04.199. [DOI] [Google Scholar]
- Liu L.; Mi Z.; Hu Q.; Li C.; Li X.; Feng F. Green synthesis of fluorescent carbon dots as an effective fluorescence probe for morin detection. Anal. Methods 2019, 11, 353–358. 10.1039/C8AY02361A. [DOI] [Google Scholar]
- Ding H.; Yu S.-B.; Wei J.-S.; Xiong H.-M. Full-Color Light-Emitting Carbon Dots with a Surface-State-Controlled Luminescence Mechanism. ACS Nano 2016, 10, 484–491. 10.1021/acsnano.5b05406. [DOI] [PubMed] [Google Scholar]
- Zhang J.; Yuan Y.; Gao M.; Han Z.; Chu C.; Li Y.; van Zijl P. C. M.; Ying M.; Bulte J. W. M.; Liu G. Carbon Dots as a New Class of Diamagnetic Chemical Exchange Saturation Transfer (diaCEST) MRI Contrast Agents. Angew. Chem., Int. Ed. 2019, 58, 9871–9875. 10.1002/anie.201904722. [DOI] [PMC free article] [PubMed] [Google Scholar]
- Jiao Y.; Gao Y.; Meng Y.; Lu W.; Liu Y.; Han H.; Shuang S.; Li L.; Dong C. One-Step Synthesis of Label-Free Ratiometric Fluorescence Carbon Dots for the Detection of Silver Ions and Glutathione and Cellular Imaging Applications. ACS Appl. Mater. Interfaces 2019, 11, 16822–16829. 10.1021/acsami.9b01319. [DOI] [PubMed] [Google Scholar]
- Ray S. C.; Saha A.; Jana N. R.; Sarkar R. Fluorescent Carbon Nanoparticles: Synthesis, Characterization, and Bioimaging Application. J. Phys. Chem. C 2009, 113, 18546–18551. 10.1021/jp905912n. [DOI] [Google Scholar]
- Pan L.; Sun S.; Zhang A.; Jiang K.; Zhang L.; Dong C.; Huang Q.; Wu A.; Lin H. Truly Fluorescent Excitation-Dependent Carbon Dots and Their Applications in Multicolor Cellular Imaging and Multidimensional Sensing. Adv. Mater. 2015, 27, 7782–7787. 10.1002/adma.201503821. [DOI] [PubMed] [Google Scholar]
- Kundu P.; Anumol E. A.; Ravishankar N. Pristine nanomaterials: synthesis, stability and applications. Nanoscale 2013, 5, 5215–5224. 10.1039/c3nr00382e. [DOI] [PubMed] [Google Scholar]
- Rao L.; Tang Y.; Li Z.; Ding X.; Liang G.; Lu H.; Yan C.; Tang K.; Yu B. Efficient synthesis of highly fluorescent carbon dots by microreactor method and their application in Fe3+ ion detection. Mater. Sci. Eng., C 2017, 81, 213–223. 10.1016/j.msec.2017.07.046. [DOI] [PubMed] [Google Scholar]
- Sachdev A.; Gopinath P. Green synthesis of multifunctional carbon dots from coriander leaves and their potential application as antioxidants, sensors and bioimaging agents. Analyst 2015, 140, 4260–4269. 10.1039/C5AN00454C. [DOI] [PubMed] [Google Scholar]
- lqbal A.; lqbal K.; Xu L.; Li B.; Gong D.; Liu X.; Guo Y.; Liu W.; Qin W.; Guo H. Heterogeneous synthesis of nitrogen-doped carbon dots prepared via anhydrous citric acid and melamine for selective and sensitive turn on-off-on detection of Hg (II), glutathione and its cellular imaging. Sens. Actuators, B 2018, 255, 1130–1138. 10.1016/j.snb.2017.08.130. [DOI] [Google Scholar]
- Song Y.; Zhu S.; Xiang S.; Zhao X.; Zhang J.; Zhang H.; Fu Y.; Yang B. Investigation into the fluorescence quenching behaviors and applications of carbon dots. Nanoscale 2014, 6, 4676–4682. 10.1039/c4nr00029c. [DOI] [PubMed] [Google Scholar]
- Zhang P.; Xue Z.; Luo D.; Yu W.; Guo Z.; Wang T. Dual-Peak Electrogenerated Chemiluminescence of Carbon Dots for Iron Ions Detection. Anal. Chem. 2014, 86, 5620–5623. 10.1021/ac5011734. [DOI] [PubMed] [Google Scholar]
- Zhu W.; Zhang J.; Jiang Z.; Wang W.; Liu X. High-quality carbon dots: synthesis, peroxidase-like activity and their application in the detection of H2O2, Ag+ and Fe3+. RSC Adv. 2014, 4, 17387–17392. 10.1039/C3RA47593J. [DOI] [Google Scholar]
- Zhou M.; Zhou Z.; Gong A.; Zhang Y.; Li Q. Synthesis of highly photoluminescent carbon dots via citric acid and Tris for iron(III) ions sensors and bioimaging. Talanta 2015, 143, 107–113. 10.1016/j.talanta.2015.04.015. [DOI] [PubMed] [Google Scholar]
- Yu J.; Xu C.; Tian Z.; Lin Y.; Shi Z. Facilely synthesized N-doped carbon quantum dots with high fluorescent yield for sensing Fe3+. New J. Chem. 2016, 40, 2083–2088. 10.1039/C5NJ03252K. [DOI] [Google Scholar]
- Zhou L.; Geng J.; Liu B. Graphene Quantum Dots from Polycyclic Aromatic Hydrocarbon for Bioimaging and Sensing of Fe3+ and Hydrogen Peroxide. Part. Part. Syst. Charact. 2013, 30, 1086–1092. 10.1002/ppsc.201300170. [DOI] [Google Scholar]
- Zhang H.; Chen Y.; Liang M.; Xu L.; Qi S.; Chen H.; Chen X. Solid-Phase Synthesis of Highly Fluorescent Nitrogen-Doped Carbon Dots for Sensitive and Selective Probing Ferric Ions in Living Cells. Anal. Chem. 2014, 86, 9846–9852. 10.1021/ac502446m. [DOI] [PubMed] [Google Scholar]
Associated Data
This section collects any data citations, data availability statements, or supplementary materials included in this article.


