

Abstract

Prednisolone, an important active pharmaceutical ingredient, is a synthetic glucocorticoid used for the preparation of various pharmaceutical products with anti-inflammatory and immunosuppressive properties. It is a challenge in high-performance liquid chromatography (HPLC) to separate the prednisolone peak and its structurally related substance (hydrocortisone), which only differs in a double bond at the C-1 position. Successful application of the HPLC method according to the European Pharmacopoeia monograph for related substances of prednisolone is very often limited to the chromatographic system available. This is due to the nonbaseline separation of the prednisolone and hydrocortisone peaks, which is strongly influenced by the instrument parameters and the chosen C18 column. First, an adjusted European Pharmacopoeia method for related substances of prednisolone was developed within the allowable adjustments. Next, an improved stability-indicating reversed-phase HPLC method for related substances of prednisolone was developed and validated for use in quality control laboratories for routine analysis. The optimized separation was performed on a Phenomenex Gemini C18 column (150 mm × 4.6 mm, 3 μm) using a gradient mobile-phase system consisting of acetonitrile/tetrahydrofuran/water (15:10:75 v/v/v), acetonitrile/water (80:20 v/v), and ultraviolet detection at 254 nm. A baseline separation was achieved, and stability indicating capability was demonstrated by a forced degradation study. A full validation procedure was performed in accordance with International Conference on Harmonization of Technical Requirements for Registration of Pharmaceuticals for Human Use guidelines.
1. Introduction
Prednisolone (11β,17,21-trihydroxypregna-1,4-diene-3,20-dione) is a synthetic glucocorticoid, a class of steroid hormones, which is produced by the adrenal gland and is known for its anti-inflammatory and immunosuppressive actions.1,2 Glucocorticoids, the pregnane class containing C-21 derivatives, are the most common therapeutic agents used in human and veterinary medicine.3,4 Prednisolone was discovered and approved for medical use in 19555 and is listed in the World Health Organization’s List of Essential Medicines.6 Various pharmaceutical dosage forms of prednisolone and its combination with other drugs are available. The analytical methods for the quantification of prednisolone in pharmaceutical products and biological fluids (plasma, blood, and urine) are mainly reversed-phase high-performance liquid chromatography (RP-HPLC), liquid chromatography coupled with mass spectrometry (LC/MS), and even more hyphenated LC–MS/MS methods.7−26 The methods used for routine analysis in quality control laboratories are either validated in-house or incorporated within the regulatory procedures for a specific pharmaceutical final product. Manufacturers of the active ingredient must supply a certificate of analysis (CoA), which is issued by their quality control department. Such analyses of related substances (impurities) of prednisolone in the active ingredient are performed according to official monograph methods (e.g., the European Pharmacopoeia monograph, hereinafter, Ph. Eur.) or other methods depending on the market/legislation or even customer requirements. The impurity profile is of immense importance in synthetic drug production. The importance of assay methods for characterizing the quality of bulk drug materials has decreased considerably in the last decade with the increasing importance of impurity and degradation profiling.27−29
The application and method verification of the Ph. Eur. monograph for related substances of prednisolone30 are frequently problematic as it makes achieving the acceptable criteria for the system suitability test (SST) more difficult. This RP-HPLC method is applied on an end-capped octadecylsilyl silica stationary phase (C18) with dimensions of 150 mm × 4.6 mm and a 3 μm particle size for the separation of prednisolone and its impurities (classified as A, B, C, F, and J according to ref (30)). Among the 10 known prednisolone impurities, five impurities are specified and identified using EDQM (European Directorate for the Quality of Medicines) chemical reference substances (prednisolone for system suitability, hereinafter, was designated as prednisolone FSS, and prednisolone for peak identification, hereinafter, was designated as prednisolone FPI). The specified five impurities of prednisolone as classified in the Ph. Eur. monograph for related substances of prednisolone are as follows:30 impurity A, hydrocortisone (11β,17,21-trihydroxypregna-4-ene-3,20-dione); impurity B, prednisone (17,21-dihydroxypregna-1,4-diene-3,11,20-trione); impurity C, prednisolone acetate (11β,17-dihydroxy-3,20-dioxopregna-1,4-dien-21-yl acetate); impurity F, 11-epi-prednisolone (11α,17,21-trihydroxypregna-1,4-diene-3,20-dione); and impurity J, 11-deoxyprednisolone (17,21-dihydroxypregna-1,4-diene-3,20-dione). The chemical structures of these compounds and prednisolone are given in Figure 1.
Figure 1.

Chemical structures of prednisolone and its related substances (impurities).
The main challenge is to separate the peaks of prednisolone and impurity A (hydrocortisone), which structurally differ only in the double bond at the C-1 position (Figure 1), which will be the main focus of this study. Hence, the suitable separation of the two peaks is strongly dependent on the chosen C18 column and the instrumental parameters of the chromatographic system. One would expect that it would be sufficient to choose the appropriate C18 column if it is listed in the EDQM knowledge database.31 However, what is more frequently needed is to optimize the chromatographic conditions within the allowable adjustments, choose suitable detector settings, and run additional tests to achieve a suitable chromatographic system for analysis. The major task in achieving the SST criteria is the separation of the peaks due to prednisolone and its impurity A, as described above. The maximum allowed content of impurity A in the prednisolone active ingredient is 1.0 wt %. Separating these two chemically similar molecules in such a ratio (prednisolone and hydrocortisone in a wt % ratio of approximately 99:1) on the baseline is, thus, challenging using any of the C18 columns. The SST criterion for this method is the peak-to-valley ratio (Hp/Hv) with regard to the peak of impurity A (criteria Hp/Hv ≥ 3, where Hp is the height above the baseline of the peak due to impurity A, and Hv is the height above the baseline of the lowest point of the curve separating this peak from the peak of prednisolone, the valley). The main drawback of the official Ph. Eur. method for related substances of prednisolone30 (herein referred to as the official Ph. Eur. method) is the difficulty in achieving a suitable value for Hp/Hv and a satisfactory reporting limit, which is strongly dependent on the C18 column used, the chromatographic system, and the detector settings (data acquisition, type of detector, etc.).
Motivated by the above given facts, this work describes the analysis of the prednisolone active ingredient and the quantification of its related substances (in this work referred to as impurities) using the current Ph. Eur. monograph for related substances of prednisolone.30 Emphasis was placed on the choice of the C18 column, whereas method optimization was also required. Next, an improved method was developed and validated for related substances of prednisolone. The experimental methodology was validated according to the ICH (International Conference on Harmonization of Technical Requirements for Registration of Pharmaceuticals for Human Use) guidelines for the validation of analytical procedures.32 Finally, a sample of prednisolone active ingredient (real sample) was analyzed using the official Ph. Eur. method30 and the developed method. The results obtained by means of the official Ph. Eur. method and the developed method were compared.
2. Results and Discussion
2.1. Method Development and Optimization
The official Ph. Eur. method30 consists of two isocratic steps in gradient elution, i.e., the first isocratic step in the first 14 min of the chromatographic run (the elution of impurities F, A, B, and prednisolone; Figures 2 and 3) and then a second isocratic step from 20 to 25 min of the chromatographic run (the elution of impurity C). Impurity J elutes within the gradient step from 14 to 20 min (Figure 3). The official Ph. Eur. method was initially developed using the Venusil AQ C18 column (150 mm × 4.6 mm, 3 μm; Agela Technologies), as reported in the EDQM knowledge database30,33 and given in Table 1. The obtained chromatogram for prednisolone FSS using this column was in accordance with the chromatogram that was delivered with the prednisolone FSS: a similar separation of peaks, comparable tR, and SST criteria were acceptable, i.e., passed. The SST criteria are given in Table 1. The robustness of the method (in terms of SST) was tested by applying the chromatographic conditions of the official Ph. Eur. method on nine different C18 columns (three core–shell columns) and three phenyl-type columns (all core–shell columns), as given in Table 2. Phenyl phases are useful when separating aromatic compounds due to the π–π interactions between the electron-rich double bonds in the analyte (prednisolone molecule and its related substances) and stationary-phase phenyl moieties. The columns differ in resolution and retention of prednisolone-related compounds, as reported by the suppliers. All tested columns had dimensions of 150 mm × 4.6 mm and a particle size from 2.6 to 4.0 μm (Table 2). The SST was denoted as acceptable (passed) when all the SST criteria shown in Table 1 were met.
Figure 2.

Chromatogram of prednisolone FSS obtained using the Venusil AQ C18 column (150 mm × 4.6 mm, 3 μm) with the official Ph. Eur. method (Table 1).
Figure 3.

Chromatogram of prednisolone FPI obtained using the Venusil AQ C18 column (150 mm × 4.6 mm, 3 μm) with the official Ph. Eur. method (Table 1).
Table 1. Chromatographic Conditions for the Official Ph. Eur. Method.
| column | Venusil AQ C18 (150 mm × 4.6 mm, 3 μm) | ||
|---|---|---|---|
| mobile phase A | water | ||
| mobile phase B | acetonitrile/methanol (50:50 v/v) | ||
| gradient program | t (min) | mobile phase A (%) | mobile phase B (%) |
| 0 | 60 | 40 | |
| 14 | 60 | 40 | |
| 20 | 20 | 80 | |
| flow rate | 1.0 mL/min | ||
| injection volume | 10 μL | ||
| column temperature | 40 °C | ||
| detection | UV at 254 nm | ||
| SST and SST criteria | SST | SST criteria | |
| chromatogram of prednisolone FSS | Hp/Hv ≥ 3 | ||
| chromatogram of prednisolone reference solution at 0.05% concentration of the working concentration (0.25 μg prednisolone/mL) | S/N has to be ≥10:1 for the prednisolone peak | ||
Table 2. Different Columns Used for the Official Ph. Eur. Method and the Reported Results According to SST Criteria.
| column no. | column | comment |
|---|---|---|
| 1 | Venusil AQ C18 (150 mm × 4.6 mm, 3 μm) | The SST criteria passed (Figure 4a); Hp/Hv = 4–7; S/N = 10; tRa = 12.679 min. |
| 2 | Gemini C18 (150 mm × 4.6 mm, 3 μm) | The SST criteria passed (Figure 4b); Hp/Hv = 4–5; S/N = 20; tRa = 9.602 min. |
| 3 | Synergi Hydro-RP (150 mm × 4.6 mm, 4 μm) | The SST criteria did not pass (Figure 4c); tRa = 9.355 min; coelution of impurity A with the prednisolone peak. |
| 4 | Luna C18(2) (150 mm × 4.6 mm, 4 μm) | The SST criteria did not pass (Figure 4d); tRa = 9.817 min; insufficient separation of impurity A and the prednisolone peak. |
| 5 | Gemini NX-C18 (150 mm × 4.6 mm, 5 μm) | The SST criteria did not pass (Figure 4e); tRa = 7.136 min; coelution of impurity A with the prednisolone peak. |
| 6 | Luna Omega Polar C18 (150 mm × 4.6 mm, 3 μm) | The SST criteria did not pass (Figure 4f); tRa = 10.332 min; coelution of impurity A with the prednisolone peak. |
| 7 | Kinetex F5 (150 mm × 4.6 mm, 2.6 μm) | The SST criteria did not pass (Figure 4g); tRa = 4.441 min; different elution orders of the impurities; possible coelution of the impurities with the prednisolone peak; poor retention. |
| 8 | Kinetex Biphenyl (150 mm × 4.6 mm, 2.6 μm) | The SST criteria did not pass (Figure 4h); tRa = 5.697 min; coelution of impurity A with the prednisolone peak; different elution orders of the impurities; poor retention. |
| 9 | Kinetex C18 (150 mm × 4.6 mm, 2.6 μm) | The SST criteria did not pass (Figure 4i); tRa = 5.656 min; insufficient separation of impurity A and the prednisolone peak; poor retention. |
| 10 | Kinetex Phenyl-Hexyl (150 mm × 4.6 mm, 2.6 μm) | The SST criteria did not pass (Figure 4j); tRa = 5.199 min; different elution orders of the impurities; poor retention. |
| 11 | Kinetex XB-C18 (150 mm × 4.6 mm, 2.6 μm) | The SST criteria did not pass (Figure 4k); tRa = 6.816 min; coelution of impurity A with the prednisolone peak; poor retention. |
| 12 | Kinetex Polar C18 (150 mm × 4.6 mm, 2.6 μm) | The SST criteria did not pass (Figure 4l); tRa = 6.524 min; coelution of impurity A with the prednisolone peak; poor retention of compounds. |
tR is the retention time of the prednisolone peak.
The chromatogram sections for the successful or unsuccessful separation of the peaks for impurity A and prednisolone using 12 different columns are shown in Figure 4. In some cases, even though a resolution (Rs) of 1.5 (the usual criterion for baseline peak separation in chromatography) or higher was obtained, separation on the baseline was not achieved (column nos. 1 and 2, Figure 4a,b, respectively). Furthermore, the SST Hp/Hv ratio criterion was only met when using the Venusil AQ C18 column (Hp/Hv was 4–7; for three replicate measurements, the Rs values were in a range of 1.5–1.7, Figure 4a) and the Gemini C18 column (Hp/Hv was 4–5; for three replicate measurements, the Rs values were in a range of 1.4–1.6, Figure 4b). Therefore, in general, the official Ph. Eur. method30 is not robust in terms of such column exchange. Moreover, the required maximum LOQ of the official Ph. Eur. method at the concentration of the reporting limit for impurities (0.25 μg prednisolone/mL) was barely achieved for the Venusil AQ C18 column and was strongly dependent on the detector settings. To obtain S/N ≥ 10 at that concentration, the detector settings and the chromatographic system had to be optimized. Detector settings, which were changed to achieve satisfactory results were peak width (response time) and slit width using a diode array detector (DAD) and a variable wavelength detector (VWD), both equipped with a standard detector flow cell with a 10 mm optical path. In case when using a DAD, the default detector settings (5 Hz) were not sufficient enough to achieve the required LOQ value. Thus, the peak width using the DAD had to be set at least to 10 Hz. In the case of a worn out deuterium lamp, the excessive noise in the baseline may alter the required sensitivity. The use of a VWD is, in this case, an option, which results in greater sensitivity by significantly reducing the noise in the baseline.
Figure 4.

(a–l) Separation of prednisolone and impurity A and B peaks obtained with the official Ph. Eur. method using different columns: (a) Venusil AQ C18, (b) Gemini C18, (c) Synergi Hydro-RP, (d) Luna C18(2), (e) Gemini NX-C18, (f) Luna Omega Polar C18, (g) Kinetex F5, (h) Kinetex Biphenyl, (i) Kinetex C18, (j) Kinetex Phenyl-Hexyl, (k) Kinetex XB-C18, and (l) Kinetex Polar C18 (Table 2). All of the chromatograms are on the same y-axis scale and have a 5 min time interval.
The S/N value for the prednisolone peak obtained using the Gemini C18 column was much higher compared to the value obtained using the Venusil AQ C18 column, indicating that the Gemini C18 column is a good starting point for further method development and optimization. The other 10 columns (apart from Venusil AQ C18 and Gemini C18) showed either the poor retention of compounds (Figure 4g–l, the columns were designated as column nos. 7–12 in Table 2, respectively, belong to core–shell columns), the coelution of the peaks for impurity A and prednisolone (Figure 4c,e,f,g,h,k, column Nos. 3, 5, 6, 7, 8, and 11 in Table 2), or different orders of impurity peak elution (Figure 4g,h,j, the columns were designated as column nos. 7, 8, and 10, respectively, belong to phenyl types of columns in Table 2). These drawbacks are not acceptable for the official Ph. Eur. method to analyze the related substances of prednisolone. The above given facts, therefore, show that the major impact on successful Ph. Eur. method application is on choosing the appropriate C18 column, which makes the method nonrobust.
Based on the test results in Table 2 and Figure 4, the Gemini C18 column (Figure 4b) was chosen as the most promising for method optimization. Since the official Ph. Eur. method is a gradient elution method, the allowable adjustments include minor changes in the mobile-phase component ratio and gradient (minor adjustments), dwell volume (adaptation of gradient time points), column length (±70%) and column inner diameter (±25%), flow rate (in case the column dimensions are changed), column temperature (±5 °C), and injection volume (which may only be reduced).
Among the above reported allowable adjustments, only the mobile-phase composition and gradient were optimized in this study. Herein, these minor adjustments are acceptable provided that the SST is fulfilled, the prednisolone peak elutes within ±15% of the indicated tR (12 min ± 1.8 min), and the final composition of the mobile phase is not weaker in elution power than the prescribed composition. These changes resulted in a significant improvement in separation, and consequently, an Hp/Hv value of 7–12 was obtained for three replicate measurements (one example is given in Figure 5). The adjusted chromatographic conditions are shown in Table 3. However, the adjusted official Ph. Eur. method developed acquires a three-channel gradient program, which requires a quaternary pump in the chromatographic system. On the other hand, no mobile-phase preparation is herein required as pure solvents were used for each mobile-phase channel. Moreover, using this method, a lower LOQ value (0.15 μg prednisolone/mL) was obtained compared with the LOQ value obtained using the official Ph. Eur. method by employing the Gemini C18 column. The tR for prednisolone obtained was also very similar (12.972 min) as that obtained with the official Ph. Eur. method on the Venusil AQ C18 column (12.606 min) and was within the allowed tR (±15% of tR = 12 min).
Figure 5.
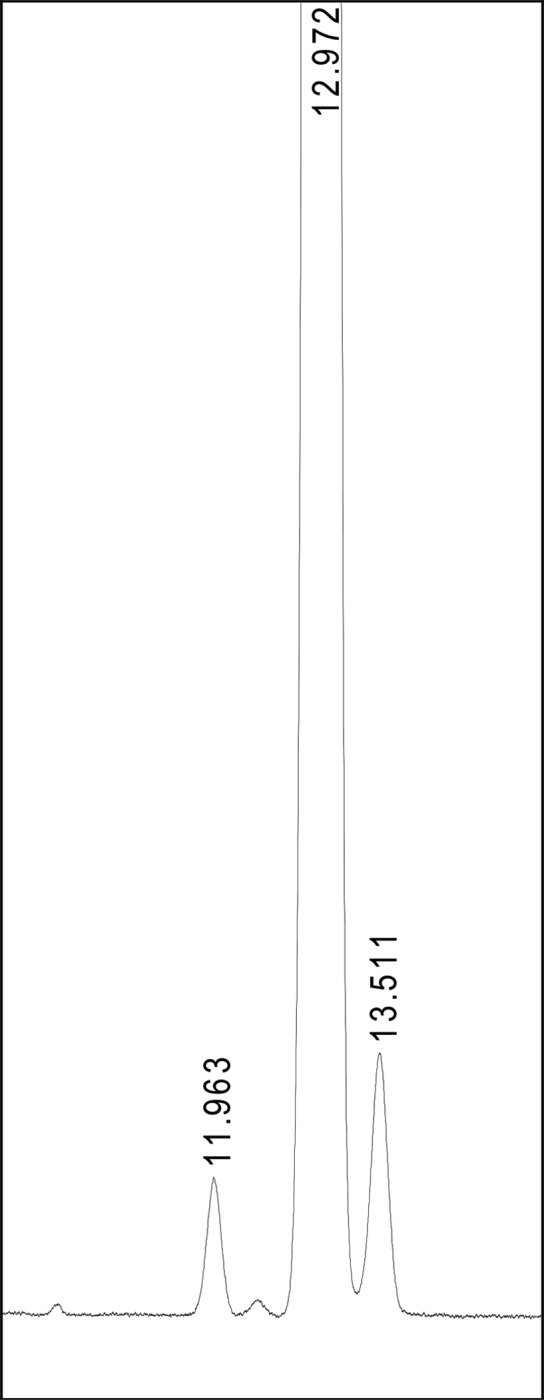
Separation of the prednisolone (tR = 12.972 min), impurity A (tR = 13.511 min), and impurity B (tR = 11.963 min) peaks obtained with the adjusted official Ph. Eur. method using the Gemini C18 column (150 mm × 4.6 mm, 3 μm) given in Table 3. (The y-scale is the same as in Figure 4.)
Table 3. Chromatographic Conditions for the Adjusted Official Ph. Eur. Method Using the Gemini C18 Column.
| column | Gemini C18 (150 mm × 4.6 mm, 3 μm) | |||
|---|---|---|---|---|
| mobile phase A | water | |||
| mobile phase B | acetonitrile | |||
| mobile phase C | methanol | |||
| gradient program | t (min) | mobile phase A (%) | mobile phase B (%) | mobile phase C (%) |
| 0 | 64 | 18 | 18 | |
| 5 | 64 | 18 | 18 | |
| 6 | 70 | 24 | 6 | |
| 15 | 70 | 24 | 6 | |
| 20 | 20 | 40 | 40 | |
| flow rate | 1.0 mL/min | |||
| injection volume | 10 μL | |||
| column temperature | 40 °C | |||
| detection | UV at 254 nm | |||
An RP-HPLC method for the separation of nine corticosteroids with similar structures was reported previously in a Dionex/Thermo Scientific application brief.34 A mobile phase consisting of methanol/tetrahydrofuran/water (8:19:73 v/v/v) was used in an isocratic run on the Acclaim 120 C18 column (150 mm × 4.6 mm, 3 μm). Excellent separation of prednisone (herein, impurity B), cortisone, prednisolone, and hydrocortisone (herein, impurity A) was reported. However, the concentrations of these compounds in that sample were similar and not in a ratio, which is expected in the case of the determination of related substances of prednisolone, where the wt % ratio is approximately prednisolone/hydrocortisone = 99:1. In such cases, the separation of two peaks usually differs greatly. The additional disadvantage of the method reported in the Dionex/Thermo Scientific application brief is the use of a relatively high concentration of tetrahydrofuran in the mobile phase, which is known to damage polyetheretherketone (PEEK) tubing and fittings and pump and degasser seals. High concentrations of such a volatile solvent in the mobile phase may also greatly influence the stability of the mobile-phase composition, thus resulting in tR shifts throughout a long-term analysis.
Hereinafter, the development of an improved method was based on the reported chromatographic conditions of the Dionex/Thermo Scientific application brief and by using the Gemini C18 column with the aim of reducing the amount of tetrahydrofuran in the mobile phase and retaining the good separation of prednisolone and impurity A peaks. An isocratic run with a mobile phase of methanol/tetrahydrofuran/water (20:10:70) and a flow rate of 0.8 mL/min (Table 4) resulted in an excellent Hp/Hv value of 21. The latter has a significantly higher Hp/Hv ratio compared with the official Ph Eur. method in Table 1 and the adjusted official Ph. Eur. method in Table 3 (as reported above) using the Venusil AQ C18 and Gemini C18 columns. The corresponding chromatograms of prednisolone FSS and prednisolone FPI are shown in Figure 6. These reference standards were dissolved in the mobile phase for isocratic elution. The chromatographic run was 45 min, which is hardly acceptable from a quality control point of view and represents the main drawback of the proposed isocratic method in Table 4.
Table 4. Chromatographic Conditions for the Isocratic Method.
| column | Gemini C18 (150 × 4.6 mm, 3 μm) |
|---|---|
| mobile phase | acetonitrile/tetrahydrofuran/water (20:10:70 v/v/v) |
| flow rate | 0.8 mL/min |
| injection volume | 10 μL |
| column temperature | 50 °C |
| detection | UV at 254 nm |
Figure 6.

(a, b) Chromatograms of (a) prednisolone FSS and (b) prednisolone FPI obtained using the Gemini C18 column (150 mm × 4.6 mm, 3 μm) with the isocratic method in Table 4.
Hence, the method was further optimized by introducing the gradient program given in Table 5. An Hp/Hv value of 16 was achieved, the Rs value between the peaks of impurity A and prednisolone was 2.3, and the chromatographic run was 20 min. For comparison, the Rs value using the official Ph. Eur. method with the Venusil AQ C18 column was in a range of 1.5–1.7, as reported above. The corresponding chromatograms of prednisolone FSS and prednisolone FPI are shown in Figure 7 using the proposed improved gradient method given in Table 5. Therefore, the method proposed in this study with the mentioned gradient elution results in a significantly improved separation of prednisolone and impurity A peaks compared with the official Ph. Eur. method. The value of the Hp/Hv ratio is consequently much higher, resulting in more favorable SST criteria, which can be used for evaluation. Moreover, for the developed method, Rs can be employed as a more reliable separation parameter for the evaluation of the separation between the peaks of prednisolone and impurity A.
Table 5. Chromatographic Conditions for the Improved Gradient Method.
| column | Gemini C18 (150 × 4.6 mm, 3 μm) | ||
|---|---|---|---|
| mobile phase A | acetonitrile/tetrahydrofuran/water (15:10:75 v/v/v) | ||
| mobile phase B | 80% acetonitrile | ||
| gradient conditions | t (min) | mobile phase A (%) | mobile phase B (%) |
| 0 | 100 | 0 | |
| 9 | 90 | 10 | |
| 18 | 40 | 60 | |
| 20 | 100 | 0 | |
| flow rate | 0.8 mL/min | ||
| injection volume | 10 μL | ||
| column temperature | 50 °C | ||
| detection | UV at 254 nm | ||
Figure 7.

(a, b) Chromatograms of (a) prednisolone FSS and (b) prednisolone FPI obtained using the Gemini C18 column (150 mm × 4.6 mm, 3 μm) with the improved method reported in Table 5.
Next, using the chromatographic conditions for the gradient method (Table 5), full validation was performed in accordance with ICH guidelines for the validation of analytical procedures.32
2.2. Validation of the Developed Method
Using the developed methodology reported in Table 5, a full validation was performed and the results for the SST and main validation parameters are summarized in Tables 6 and 7, respectively.
Table 6. Results for the SST Using the Improved Method Reported in Table 5.
| system suitability test (SST) | obtained value | criterion |
|---|---|---|
| Prednisolone Reference Solution at the LOQ: 0.05% of the Working Concentration (0.25 μg/mL) | ||
| S/N for the prednisolone peak | 15 | ≥10 |
| Prednisolone Reference Solution at 0.5% of the Working Concentration (2.5 μg/mL) | ||
| number of theoretical plates for the prednisolone peak | 35,226/m | ≥10,000/m |
| tailing factor for the prednisolone peak | 1.01 | 0.8–1.5 |
| RSD of the prednisolone peak area (n = 3) | 0.8% | ≤5% |
| Solution of Prednisolone FSS | ||
| Rs between the peaks of prednisolone and impurity A | 2.3 | ≥1.5 |
Table 7. Summary of the Main Validation Results Using the Improved Method Reported in Table 5.
| Precision of the System | |||||
| RSD of the prednisolone peak area (n = 6) at 0.25 μg/mL (LOQ) | 3.6% | ≤10% | |||
| RSD of the prednisolone peak area (n = 6) at 2.50 μg/mL | 0.6% | ≤5% | |||
| Precision of the Method for the Active Ingredient (Real Sample) | |||||
| RSD for impurity F (tR = 5.357 min) | 2.3% | ≤10% | |||
| RSD for impurity B (tR = 7.387 min) | 7.8% | ≤10% | |||
| RSD for impurity A (tR = 8.747 min) | 2.5% | ≤5% | |||
| RSD for unknown impurity (tR = 11.317 min) | 7.4% | ≤10% | |||
| RSD for total impurities | 2.1% | ≤5% | |||
| LOD and LOQ | |||||
| LOD | 0.025% of the working concentration (0.125 μg/mL) | ||||
| LOQ | 0.05% of the working concentration (0.25 μg/mL) | ||||
| Linearity of the Method | |||||
| parameter | prednisolone | impurity A | impurity B | impurity C | |
| range (μg/mL) | 0.26–6.33 | 0.27–6.34 | 0.28–6.54 | 0.28–6.58 | |
| slope (mL/μg) | 28.310 | 28.150 | 26.029 | 24.236 | |
| intercept | 0.1495 | 0.0972 | 0.1420 | 0.6132 | |
| R | 0.9998 | 0.9999 | 0.9999 | 0.9999 | |
| correction factora | 1.00 | 1.01 | 1.09 | 1.17 | |
| Accuracy of the Method | |||||
| % of the working concentration | prednisolone | impurity A | impurity B | impurity C | |
| 0.05 (maximal LOQ) | average recovery (%)b | 101.3 ± 12.8 | 102.9 ± 12.7 | 97.3 ± 12.6 | 82.0 ± 17.1 |
| RSD (%) | 5.1 | 5.0 | 5.2 | 8.4 | |
| 0.1 | average recovery (%)b | 101.3 ± 4.9 | 97.5 ± 4.5 | 88.7 ± 4.7 | 82.3 ± 6.1 |
| RSD (%) | 2.0 | 1.9 | 2.1 | 3.0 | |
| 0.3 | average recovery (%)b | 97.1 ± 0.5 | 98.4 ± 0.5 | 89.0 ± 3.8 | 82.2 ± 12.1 |
| RSD (%) | 0.2 | 0.2 | 1.7 | 5.9 | |
| 0.5 | average recovery (%)b | 98.2 ± 3.0 | 96.1 ± 1.9 | ||
| RSD (%) | 1.2 | 0.8 | |||
| 1.0 | average recovery (%)b | 100.3 ± 5.9 | 95.5 ± 0.8 | ||
| RSD (%) | 2.4 | 0.3 | |||
| 1.3 | average recovery (%)b | 96.2 ± 1.3 | |||
| RSD (%) | 0.5 | ||||
| Selectivity | |||||
| substance | retention time (min) | relative retention time | |||
| prednisolone | 8.462 | 1.00 | |||
| impurity A | 8.883 | 1.05 | |||
| impurity B | 7.507 | 0.89 | |||
| impurity C | 15.534 | 1.84 | |||
| impurity F | 5.514 | 0.65 | |||
| impurity J | 10.970 | 1.30 | |||
Correction factors for impurities were not included in the calculations as they were within the acceptable 0.8–1.2 range.
Average recovery is reported along with a 95% confidence interval.
The method was suitable for the evaluation of prednisolone impurities at the reporting limit of 0.25 μg/mL (which is the maximum allowed concentration for the LOQ30). The column efficiency and peak symmetry for the prednisolone peak were satisfactory as the number of theoretical plates was significantly higher than 10,000 plates/m and the tailing factor was 1.01. The precision of the system for the SST was satisfactory (RSD was 0.8%). The Rs value between the peaks of prednisolone and impurity A was 2.3 (Table 6).
For the method validation, the precision of the system for prednisolone at the LOQ and at the concentration used for quantification purposes (2.50 μg/mL) was shown to be suitable, i.e., the RSD values of the peak area were 3.6 and 0.6%, whereas the recommended criteria for RSD values were 10.0 and 5.0%, respectively (Table 7). The method was shown to be precise, and the RSD values of the individual and total prednisolone impurity content were within the recommended criteria, i.e., the RSD values for impurities in a concentration range of 0.05–0.10% did not exceed 10.0%, and for impurities in a concentration range of 0.10–1.00%, the RSD values were below 5.0%. The determined LOD and LOQ values for prednisolone and its impurities A, B, and C were similar and were equal or lower than 0.125 μg/mL (0.025% of the working concentration) for the LOD and 0.25 μg/mL for the LOQ, respectively. Linearity for prednisolone and impurities A, B, and C was confirmed in the range from the LOQ to about 6.50 μg/mL (Table 7). All R values were greater than 0.999. The correction factors for impurities A, B, and C were 1.01, 1.09, and 1.17, respectively. The latter suggests that correction factors for quantifications are not needed, i.e., no correction of areas is required for impurities A, B, and C (however, impurity C is in its higher correction factor limit). Correction of an area for an impurity becomes necessary when the response of the impurity is outside the range of 0.8 to 1.2 compared to the test substance according to the Ph. Eur.35,36
The average recovery and RSD values for prednisolone and impurities A, B, and C in the tested concentration ranges were within the recommended criteria (average recoveries were within 100% ± 20% and RSD ≤ 10% for concentrations from the LOQ to 0.3%, and average recoveries were within 100% ± 10% and RSD ≤ 5% for concentrations from 0.5% to 1.3%), as shown in Table 7.
The developed gradient method was also shown to be selective since there were no peaks generated from the solvent mixture, which may overlap with the peaks of prednisolone and its impurities. The retention times are reported in Table 7. The forced degradation study performed on a sample solution of the prednisolone active ingredient using different solvents and conditions indicated that prednisolone is extremely susceptible to alkaline degradation (0.1 M NaOH), during which approximately 80% prednisolone degradation occurred. Prednisolone also showed degradation when exposed to light: in total, about 3% prednisolone impurities were quantified in the sample solution after 4 days of exposure to daylight in a clear glass flask. A negligible amount of impurities formed in the sample solution stored for 4 days at room temperature in amber glassware, indicating that the sample solution was stable for at least 4 days. Prednisolone was slightly susceptible to heat (24 h at 60 °C): about 1% additional degradation products formed in comparison to the content of impurities in the fresh sample solution. Prednisolone showed no degradation when exposed to acid (0.1 M HCl) and oxidative degradation conditions (0.3% H2O2): the content of the impurities and the assay results were almost the same as for the fresh sample solution.
The robustness of the method was confirmed by testing (i) the stability of solutions and (ii) slightly modified chromatographic conditions, with column temperatures at 45 and 55 °C and different columns.
Regarding the stability of solutions, the prednisolone reference solution and sample solution were found to be stable for at least 4 days stored in amber glassware on the workbench at room temperature. The peak area of prednisolone in the chromatogram of prednisolone reference solution was within the recommended criteria (100% ± 20% compared to the initial value), and no additional peaks were observed. Moreover, the content of total prednisolone impurities in the sample solution active ingredient was within the recommended criteria (100% ± 10% compared to the initial value).
Regarding the slightly modified chromatographic conditions, it was shown that they do not influence the SST criteria (Table 8). However, the LOQ at 0.25 μg prednisolone/mL using the Venusil AQ C18 column was not achieved (S/N < 10) without any further optimization of the detector settings. This was also the case when the official Ph. Eur. method was applied using the Venusil AQ C18 column, as reported above. The Venusil AQ C18 column gives a higher retention factor (k′, Table 8) for prednisolone compared with the Gemini C18 column also for the developed method (the same was found with the official Ph. Eur. method, as reported above). Most likely, even much less retention would be expected using a core–shell column, which opens the possibility for further method optimization toward a shorter analysis time. A number of different core–shell columns should be tested regarding this issue and could be the subject of further studies.
Table 8. Robustness of the Method (Different Column Temperatures and Different Columns) in Terms of SST for the Developed Method Reported in Table 5.
| SST | obtained
value |
||||
|---|---|---|---|---|---|
| column | Gemini C18 (150 × 4.6 mm, 3 μm) | Gemini C18 (150 × 4.6 mm, 3 μm) (T = 45 °C) | Gemini C18 (150 × 4.6 mm, 3 μm) (T = 55 °C) | Venusil AQ C18 (150 × 4.6 mm, 3 μm) | SST criterion |
| Prednisolone Reference Solution at the LOQ: 0.05% of the Working Concentration (0.25 μg/mL) | |||||
| tR of prednisolone (min) | 8.4 | 8.8 | 8.0 | 10.1 | |
| S/N | 15 | 11 | 14 | 9 | ≥10 |
| Prednisolone Reference Solution at 0.5% of the Working Concentration (2.5 μg/mL) | |||||
| no. of theoretical plates | 35,226 | 36,668 | 33,136 | 33,100 | ≥10,000 |
| tailing factor | 1.01 | 1.00 | 1.02 | 0.95 | 0.8–1.5 |
| Solution of Prednisolone FSS | |||||
| Rs between the peaks of prednisolone and impurity A | . | 2.2 | 2.3 | 2.5 | ≥1.5 |
| k′ | 3.75 | 3.91 | 3.27 | 4.70 | informative |
Furthermore, to additionally test method robustness, the content of the prednisolone impurities in the active ingredient obtained at slightly modified chromatographic conditions (T = 45 and 55 °C and different columns) relative to the results obtained with the developed method (Table 5) is within recommended criteria, i.e., (a) the obtained concentration of individual impurities in the range LOQ to 0.3% should be within 100% ± 40% and (b) the obtained concentration of total impurities should be within 100% ± 20% relative to the concentration obtained with the official Ph. Eur. method (Table 9).
Table 9. Robustness of the Method (Different Column Temperatures and Different Columns).
| method used | impurity F (%) | impurity B (%) | impurity A (%) | unknown (%) | unknown (%) | total impurities (%) |
|---|---|---|---|---|---|---|
| developed method (Table 5) (Gemini C18, 150 × 4.6 mm, 3 μm) | 0.06 | 0.06 | 0.36 | 0.07 | 0.05 | 0.60 |
| developed method (Table 5), column Ta = 45 °C (Gemini C18, 150 × 4.6 mm, 3 μm) | 0.05 | 0.06 | 0.35 | 0.08 | 0.07 | 0.61 |
| developed method (Table 5), column Ta = 55 °C (Gemini C18, 150 × 4.6 mm, 3 μm) | 0.07 | 0.06 | 0.34 | 0.07 | 0.07 | 0.61 |
| developed method (Table 5), using Venusil AQ C18 (150 × 4.6 mm, 3 μm; instead of Gemini C18) | 0.06 | 0.07 | 0.34 | 0.08 | 0.06 | 0.61 |
T is the temperature.
The content of total impurities in the active ingredient obtained with the official Ph. Eur. method, and as declared in the certificate of analysis, is lower due to the relatively high LOQ of the method, impurity F and an additional unknown impurity were below the LOQ (Table 10). The quantification of an unknown impurity in an active ingredient, which is present at a concentration of the reporting limit, may, in some cases, be unintentionally overseen or neglected as the LOQ value is equal to the reporting limit. In the case of analysis with the developed method, two additional unknown impurities were reported (contents of 0.05 and 0.06%, Table 10), mainly due to the enhanced sensitivity of the method.
Table 10. Comparison of the Prednisolone Active Ingredient Impurity Profile with the Certificate of Analysis and the Results Obtained with the Official Ph. Eur. Method.
| method used | impurity F (%) | impurity B (%) | impurity A (%) | unknown (%) | unknown (%) | total impurities (%) |
|---|---|---|---|---|---|---|
| certificate of analysis obtained by the prednisolone producer | <LOQ | 0.05 | 0.33 | 0.06 | <LOQ | 0.44 |
| official Ph. Eur. (Table 1) (Venusil AQ C18; 150 × 4.6 mm, 3 μm) | <LOQ | 0.06 | 0.36 | 0.06 | <LOQ | 0.48 |
| developed gradient method (Table 5) (Gemini C18; 150 × 4.6 mm, 3 μm) | 0.06 | 0.06 | 0.36 | 0.07 | 0.05 | 0.60 |
3. Conclusions
In this work, the problematic separation of the peaks of hydrocortisone and the prednisolone active ingredient was studied using reversed-phase high-performance liquid chromatography (RP-HPLC). It was shown that the official Ph. Eur. monograph for the related substances of the prednisolone method has poor robustness in terms of the system suitability test when different C18 columns were employed. It was shown that the system suitability test was passed only when the Venusil AC C18 (as suggested by the European Directorate for the Quality of Medicines) and Gemini C18 columns were used and by employing optimized detector settings. In particular, the separation of structurally very similar molecules, i.e., prednisolone and hydrocortisone (impurity A), was not easily achieved using different C18 columns.
On this basis, the official Ph. Eur. method was optimized using the Gemini C18 column (150 mm × 4.6 mm, 3 μm) within the allowable adjustments according to the Ph. Eur. It was shown that by using the adjusted method, Hp/Hv values of 7–12 were obtained and were higher compared with the Hp/Hv values of 4–7 that were measured using the official Ph. Eur. method and the Venusil AQ C18 column. For the latter, Rs values of 1.5–1.7 were obtained for three replicate measurements. Additionally, to obtain even better analytical performance, in terms of enhanced method robustness, and to offer an alternative to routine analyses in quality control departments, an improved method was developed. Based on the prednisolone molecule structure, it was expected that phenyl selectivity would solve the separation between peaks of prednisolone and impurity A. However, tests showed that the influence of tetrahydrofuran in the mobile phase greatly influenced the selectivity, thus making separation on a C18 column significantly better. The RP-HPLC method was developed on the Gemini C18 column (150 mm × 4.6 mm, 3 μm) by employing a gradient of mobile phases consisting of acetonitrile/tetrahydrofuran/water (15:10:75 v/v/v) and acetonitrile/water (80:20 v/v) within a 20 min chromatographic run. The separation of the peaks of prednisolone and hydrocortisone in prednisolone reference solution to evaluate system suitability was significantly improved, i.e., an Rs value of 2.3 and an Hp/Hv value of 16 were obtained using the developed gradient method. Finally, the method for related substances of prednisolone was fully validated in accordance with ICH guidelines and proved to be a selective and stability-indicative method. The analysis of a real sample of the prednisolone active ingredient to determine the content of related substances with the official Ph. Eur. method and the improved method was comparable. The improved method is therefore a good alternative for analysis of the prednisolone active ingredient in quality control facilities, which have reported problems on achieving suitable chromatographic systems with the official Ph. Eur. monograph for the related substances of prednisolone.
4. Experimental Section
4.1. Materials and Reagents
In this work, all units in percent are mass fractions, if not stated otherwise. The solvents used for the mobile phase were acetonitrile (gradient HPLC grade, 99.9% (v/v); Fisher Chemical, Leicestershire, UK), methanol (gradient HPLC grade, 99.9% (v/v); J.T. Baker, Gliwice, Poland), and tetrahydrofuran (CHROMASOLV Plus for HPLC, ≥99.9% (v/v); Honeywell, Morristown, USA). Sodium hydroxide (puriss p.a., ≥98%; Sigma-Aldrich, St. Louis, USA), hydrochloric acid (puriss p.a., ≥37% (v/v); Fluka, St. Louis, USA), and hydrogen peroxide (Perhydrol for analysis, 30% (v/v); Merck, Darmstadt, Germany) were used for the forced degradation study. Ultrapure water (resistivity, 18.2 MΩ cm) was obtained by means of an ELGA water purification system (Lane End, UK).
The prednisolone FSS (containing prednisolone impurities A, B, and C; batch 2.0), prednisolone FPI (containing prednisolone impurities F and J, batch 1.1), the chemical reference substance of prednisolone (batch 9.0), and impurity C (prednisolone acetate, batch 4.1) were obtained from EDQM (Strasbourg, France). To identify the peaks of prednisolone impurities A and B during the method optimization, chemical reference substances of each were used. Prednisolone impurity A (hydrocortisone, batch SLBL4101V) and impurity B (prednisone, batch P50042) were obtained from Sigma-Aldrich and Fluka, respectively. The prednisolone active ingredient (real sample) was obtained from a Chinese manufacturer. Standard solutions and sample solution were prepared in amber glassware using a mixture of acetonitrile and water (40:60 v/v) as a solvent, this solution is hereinafter designated as the solvent mixture.
4.2. Instrumentation
A 1200 Agilent HPLC system was used, consisting of a 400 bar quaternary pump, a diode array detector (DAD) with a standard cell (10 mm optical path), an autosampler, and a thermostatted column compartment. The detection wavelength was 254 nm with data acquisition at 10 Hz (4 nm slit). The columns used for method development (listed in Table 1) were obtained from Phenomenex and Agela Technologies (Torrance, USA). Chromatographic data were acquired and processed using Agilent ChemStation software. The same software was used to calculate the number of theoretical plates and the tailing factor.
4.3. Preparation of Solutions
4.3.1. Preparation of Standard Solutions for System Suitability
Standard solutions for the chromatographic SST and the identification of prednisolone impurities were prepared in accordance with the Ph. Eur. monograph for related substances of prednisolone.30
The prednisolone FSS was dissolved (5 mg) in the solvent mixture and diluted to 10.0 mL with the solvent mixture. Prednisolone FSS reference solution was used for the identification of prednisolone impurities A, B, and C and for the determination of the Hp/Hv ratio.
Prednisolone FPI was dissolved (5 mg) in the solvent mixture and diluted to 10.0 mL with the solvent mixture. Prednisolone FPI reference solution was used for the identification of prednisolone impurities F and J.
To prepare the prednisolone reference solution, 5 mg of the chemical reference substance of prednisolone was dissolved in the solvent mixture and diluted to 10.0 mL with the solvent mixture. A volume of 0.5 mL of this solution was diluted to 100 mL with the solvent mixture (to prepare 2.50 μg prednisolone/mL). Prednisolone reference solution was used for calibration purposes and the system suitability assessment.
4.3.2. Preparation of the Active Ingredient Sample Solution
The prednisolone active ingredient (real sample) was dissolved (25 mg) in the solvent mixture and diluted to 50 mL with the solvent mixture (to obtain a final concentration of 0.5 mg prednisolone/mL).
4.3.3. Preparation of Solutions and Method Validation
4.3.3.1. System Suitability Test
The SST is an integral part of a liquid chromatographic method used to verify that the chromatographic system is adequate before any further analysis and is required by all regulatory agencies.
The working concentration of prednisolone is the concentration of prednisolone in the sample solution at 0.5 mg prednisolone/mL.30 A signal-to-noise (S/N) ratio of the prednisolone peak was evaluated by injecting prednisolone reference solution at 0.25 μg prednisolone/mL (the concentration of the reporting limit according to the official Ph. Eur. method, which is 0.05% of the working concentration and is defined as the maximum limit of quantification, LOQ). The precision of the system for the SST was determined by three consecutive injections of prednisolone reference solution at 2.50 μg prednisolone/mL (0.5% of the working concentration of prednisolone in the sample solution), and the relative standard deviation (RSD) of the prednisolone peak area was calculated. Moreover, the number of theoretical plates and the tailing factor of the prednisolone peak were determined. The preparation of FSS is described in Section 4.3.1.
4.3.3.2. Method Validation Test
The precision of the system for the method validation test was assessed by six consecutive injections of prednisolone reference solutions at two concentrations, i.e., at 0.25 μg prednisolone/mL (at LOQ) and 2.50 μg prednisolone/mL (the test at this concentration is the same as explained above). RSD of the prednisolone peak area was calculated to evaluate the precision of the system for the method validation test.
The precision of the method (repeatability and intermediate precision) was determined by injecting six replicates of sample solutions of the prednisolone active ingredient (real sample) at a working concentration of 0.5 mg prednisolone/mL. To determine the precision for impurities in the sample solution of the prednisolone active ingredient, the content of specified and unknown impurities was determined based on an external standard method evaluation at 2.50 μg prednisolone/mL (the concentration used for quantification purposes).
The limit of detection (LOD) and the LOQ were determined for prednisolone reference solution at the concentration, giving an S/N ratio ≥ 3:1 and an S/N ratio ≥ 10:1, respectively. According to the Ph. Eur. monograph for related substances of prednisolone,30 the LOQ for prednisolone should not be higher than a concentration of 0.25 μg prednisolone/mL.
Accuracy was assessed using prednisolone reference solutions and standard solutions of impurities A, B, and C. Prednisolone reference solutions were prepared at six different concentrations in three replicates in a concentration range from the LOQ to about 130% of the maximum specification for impurities (which is 1.0% of the working concentration; therefore, 130% results in 6.50 μg/mL). To determine the accuracy for the impurity A, a standard solution of impurity A was prepared at five different concentrations in three replicates in a concentration range from the LOQ (0.25 μg/mL) to its specification concentration (1.0% of the working concentration, i.e., 5.00 μg/mL). To test the accuracy of impurities B and C, standard solutions of impurities B and C were prepared at three concentrations in three replicates in a concentration range from the LOQ (0.25 μg/mL) to their specification concentration (0.3% of the working concentration, i.e., 1.50 μg/mL). The accuracy was calculated as the percentage recovery along with a 95% confidence interval. The impurities were quantified with respect to prednisolone at 2.50 μg prednisolone/mL in prednisolone reference solution.
The linear concentration range for prednisolone and impurities A, B, and C was tested in a concentration range from the LOQ (0.25 μg/mL) to about 130% of the maximum specification for the impurities (which is 1.0% of the working concentration; therefore, 130% results in 6.50 μg/mL). As a criterion to accept the linear concentration range, the correlation coefficient (R) needed to be ≥0.999. Standard stock solutions of prednisolone reference solution and standard solutions of impurities A, B, and C were diluted, and linearity was determined based on six measured calibration points. Each standard solution was injected in triplicate, whereas the standard solution at a concentration of the LOQ was injected six times. To construct a linear calibration curve, the average value of the response was employed.
The R, the y-intercept, the slope of the linear calibration curve, and the bias of the y-intercept at approximately 2.50 μg prednisolone/mL were determined. The correction factor (the reciprocal value of the relative response factor) for each impurity was calculated for the tested linear concentration range. Correction of the area of an impurity becomes necessary when the response of the impurity is outside the range of 0.8 to 1.2 compared to the test substance, in this case, prednisolone.35,36
The selectivity of the method was shown by comparing the chromatograms of the solvent mixture, prednisolone reference solutions, prednisolone FSS, prednisolone FPI, and sample solution. The identification of prednisolone impurities A, B, and C was confirmed by comparing tR using reference solutions of impurities A, B, and C, which were prepared at a concentration of 2.50 μg/mL.
The robustness of the method was tested based on the stability of the solutions and the influence of slightly different chromatographic conditions. Prednisolone reference solution at 2.50 μg prednisolone/mL and the sample solution of the active ingredient at 0.5 mg prednisolone/mL, which were stored in amber glassware on the workbench for 4 days at room temperature, were injected into a suitable chromatographic solution. The peak areas for prednisolone in a chromatogram of freshly prepared and stored prednisolone reference solutions were compared. The contents of the impurities in the freshly prepared and stored sample solutions of active ingredient were also compared. The influence of column temperature (50 °C ± 5 °C) and a different column (Venusil AQ C18 150 × 4.6 mm, 3 μm) were tested with regard to the SST and the content of the prednisolone impurities.
4.3.3.3. Forced Degradation
Additionally, a forced degradation study of the prednisolone active ingredient was performed to show that prednisolone degradation products are separated from the prednisolone peak and to determine whether the method is stability-indicating.
For the forced degradation study, four replicates of sample solution were prepared. The prednisolone active ingredient (5 mg) was dissolved in 7.0 mL of the solvent mixture in a 10.0 mL volumetric flask. To each volumetric flask, 1.0 mL of solvent mixture, 1.0 mL of 1 M HCl (to test acid degradation), 1.0 mL of 1 M NaOH (to test alkaline degradation), and 1.0 mL of 3.0% H2O2 (v/v) (to test oxidative degradation) were added and finally diluted with the solvent mixture to 10.0 mL. Sample solution was prepared in a single replicate and split into two parts. One was exposed to heat (24 h at 60 °C, to test thermal degradation), and the second one was stored in daylight at room temperature for 4 days (to test photolytic degradation). The content of the degradation products was determined with respect to prednisolone at 2.50 μg prednisolone/mL in prednisolone reference solution.
Acknowledgments
The authors would like to acknowledge the financial support provided by the Slovenian Research Agency (grant numbers P2-0046, P2-0032, and J1-9169).
The authors declare no competing financial interest.
References
- Goyal R. N.; Bishnoi S. Simultaneous voltammetric determination of prednisone and prednisolone in human body fluids. Talanta 2009, 79, 768–774. 10.1016/j.talanta.2009.04.067. [DOI] [PubMed] [Google Scholar]
- Feng J.; Liu X.; Li Y.; Duan G. Microwave-assisted enzymatic hydrolysis followed by extraction with restricted access nanocomposites for rapid analysis of glucocorticoids residues in liver tissue. Talanta 2016, 159, 155–162. 10.1016/j.talanta.2016.06.013. [DOI] [PubMed] [Google Scholar]
- Frew A. J.86 - Glucocorticoids. In Clinical Immunology, Fifth Ed.; Rich R. R.; Fleisher T. A.; Shearer W. T.; Schroeder H. W.; Frew A. J.; Weyand C. M., Eds.; Elsevier: London, 2019; pp 1165–1175. [Google Scholar]
- Papich M. G.Glucocorticoids. In Handbook of Veterinary Pain Management; Third Ed.;, Gaynor J. S.; Muir W. W., Eds.; Mosby: St. Louis, 2015; pp 266–279. [Google Scholar]
- Kim K.-W.; Roh J. K.; Wee H.-J.; Kim C.. Cancer Drug Discovery: Science and History; Springer Netherlands: 2016. [Google Scholar]
- World Health Organization World Health Organization’s Model List of Essential Medicines (20th List), World Health Organization: March 2017.
- Marley A.; Stalcup A. M.; Connolly D. Development and validation of a new stability indicating reversed phase liquid chromatographic method for the determination of prednisolone acetate and impurities in an ophthalmic suspension. J. Pharm. Biomed. Anal. 2015, 102, 261–266. 10.1016/j.jpba.2014.09.023. [DOI] [PubMed] [Google Scholar]
- Izumoto S.-i.; Machida Y.; Nishi H.; Nakamura K.; Nakai H.; Sato T. Chromatography of crotamiton and its application to the determination of active ingredients in ointments. J. Pharm. Biomed. Anal. 1997, 15, 1457–1466. 10.1016/S0731-7085(96)02052-3. [DOI] [PubMed] [Google Scholar]
- Gai M. N.; Pinilla E.; Paulos C.; Chávez J.; Puelles V.; Arancibia A. Determination of Prednisolone and Prednisone in Plasma, Whole Blood, Urine, and Bound-to-Plasma Proteins by High-Performance Liquid Chromatography. J. Chromatogr. Sci. 2005, 43, 201–206. 10.1093/chromsci/43.4.201. [DOI] [PubMed] [Google Scholar]
- Haneef J.; Shaharyar M.; Husain A.; Rashid M.; Mishra R.; Parveen S.; Ahmed N.; Pal M.; Kumar D. Application of LC–MS/MS for quantitative analysis of glucocorticoids and stimulants in biological fluids. J. Pharm. Anal. 2013, 3, 341–348. 10.1016/j.jpha.2013.03.005. [DOI] [PMC free article] [PubMed] [Google Scholar]
- Ionita I. A.; Fast D. M.; Akhlaghi F. Development of a sensitive and selective method for the quantitative analysis of cortisol, cortisone, prednisolone and prednisone in human plasma. J. Chromatogr., B 2009, 877, 765–772. 10.1016/j.jchromb.2009.02.019. [DOI] [PubMed] [Google Scholar]
- Frerichs V. A.; Tornatore K. M. Determination of the glucocorticoids prednisone, prednisolone, dexamethasone, and cortisol in human serum using liquid chromatography coupled to tandem mass spectrometry. J. Chromatogr., B 2004, 802, 329–338. 10.1016/j.jchromb.2003.12.015. [DOI] [PubMed] [Google Scholar]
- DiFrancesco R.; Frerichs V.; Donnelly J.; Hagler C.; Hochreiter J.; Tornatore K. M. Simultaneous determination of cortisol, dexamethasone, methylprednisolone, prednisone, prednisolone, mycophenolic acid and mycophenolic acid glucuronide in human plasma utilizing liquid chromatography–tandem mass spectrometry. J. Chromatogr., B 2007, 859, 42–51. 10.1016/j.jchromb.2007.09.003. [DOI] [PubMed] [Google Scholar]
- Rudaz S.; Souverain S.; Schelling C.; Deleers M.; Klomp A.; Norris A.; Vu T. L.; Ariano B.; Veuthey J. L. Development and validation of a heart-cutting liquid chromatography–mass spectrometry method for the determination of process-related substances in cetirizine tablets. Anal. Chim. Acta 2003, 492, 271–282. 10.1016/S0003-2670(03)00339-8. [DOI] [Google Scholar]
- Quaglia M. G.; Bossù E.; Donati E.; Mazzanti G.; Brandt A. Determination of silymarine in the extract from the dried silybum marianum fruits by high performance liquid chromatography and capillary electrophoresis. J. Pharm. Biomed. Anal. 1999, 19, 435–442. 10.1016/S0731-7085(98)00231-3. [DOI] [PubMed] [Google Scholar]
- Toussaint B.; Duchateau A. L. L.; van der Wal S.; Albert A.; Hubert P.; Crommen J. Determination of the enantiomers of 3-tert.-butylamino-1,2-propanediol by high-performance liquid chromatography coupled to evaporative light scattering detection. J. Chromatogr. A 2000, 890, 239–249. 10.1016/S0021-9673(00)00609-9. [DOI] [PubMed] [Google Scholar]
- Salatti-Dorado J. Á.; González-Rubio S.; García-Gómez D.; Lucena R.; Cárdenas S.; Rubio S. A high thermally stable oligomer-based supramolecular solvent for universal headspace Gas Chromatography: Proof-of-principle determination of residual solvents in drugs. Anal. Chim. Acta 2019, 1046, 132–139. 10.1016/j.aca.2018.09.023. [DOI] [PubMed] [Google Scholar]
- Rocheleau M.-J.; Titley M.; Bolduc J. Measuring residual solvents in pharmaceutical samples using fast gas chromatography techniques. J. Chromatogr., B 2004, 805, 77–86. 10.1016/j.jchromb.2004.02.018. [DOI] [PubMed] [Google Scholar]
- Galaev I. Y.; Mattiasson B. Poly(N-vinylpyrrolidone) shielding of matrices for dye-affinity chromatography: Improved elution of lactate dehydrogenase from Blue Sepharose and secondary alcohol dehydrogenase from Scarlet Sepharose. J. Chromatogr. A 1994, 662, 27–35. 10.1016/0021-9673(94)85292-8. [DOI] [Google Scholar]
- Barbarin N.; Tilquin B.; de Hoffmann E. Radiosterilization of cefotaxime: investigation of potential degradation compounds by liquid chromatography–electrospray mass spectrometry. J. Chromatogr. A 2001, 929, 51–61. 10.1016/S0021-9673(01)01175-X. [DOI] [PubMed] [Google Scholar]
- Lamalle C.; Servais A.-C.; Radermecker R. P.; Crommen J.; Fillet M. Simultaneous determination of insulin and its analogues in pharmaceutical formulations by micellar electrokinetic chromatography. J. Pharm. Biomed. Anal. 2015, 111, 344–350. 10.1016/j.jpba.2014.12.038. [DOI] [PubMed] [Google Scholar]
- Shek E.; Bragonje J.; Benjamin E. J.; Sutherland M. J.; Gluck J. A. P. A stability indicating high-performance liquid chromatography determination of Triple Corticoid Integrated System in a cream. Int. J. Pharm. 1982, 11, 257–269. 10.1016/0378-5173(82)90044-8. [DOI] [Google Scholar]
- Gaillard Y.; Pépin G. Use of high-performance liquid chromatography with photodiode-array UV detection for the creation of a 600-compound library application to forensic toxicology. J. Chromatogr. A 1997, 763, 149–163. 10.1016/S0021-9673(96)00706-6. [DOI] [PubMed] [Google Scholar]
- Wu S.; Jia A.; Daniels K. D.; Park M.; Snyder S. A. Trace analysis of corticosteroids (CSs) in environmental waters by liquid chromatography–tandem mass spectrometry. Talanta 2019, 195, 830–840. 10.1016/j.talanta.2018.11.113. [DOI] [PubMed] [Google Scholar]
- El Gammal R. N.; Hammouda M. E. A.; El-Wasseef D. R.; El-Ashry S. M. Simultaneous determination of gatifloxacin and prednisolone in their bulk powder, synthetic mixture and their combined ophthalmic preparation using micellar liquid chromatography. J. Chromatogr. Sci. 2018, 56, 367–374. 10.1093/chromsci/bmy011. [DOI] [PubMed] [Google Scholar]
- Abdullah N.; Karamat F.; Qamar S.; Abbas M.; Khan A.; Ullah N. Development and validation of RP-HPLC method for simultaneous quantification of sulfacetamide sodium and prednisolone sodium phosphate. Acta Pol. Pharm. 2019, 76, 37–47. 10.32383/appdr/93843. [DOI] [Google Scholar]
- Görög S. Critical review of reports on impurity and degradation product profiling in the last decade. TrAC, Trends Anal. Chem. 2018, 101, 2–16. 10.1016/j.trac.2017.09.012. [DOI] [Google Scholar]
- Ma J.; Yao Z.; Hou L.; Lu W.; Yang Q.; Li J.; Chen L. Metal organic frameworks (MOFs) for magnetic solid-phase extraction of pyrazole/pyrrole pesticides in environmental water samples followed by HPLC-DAD determination. Talanta 2016, 161, 686–692. 10.1016/j.talanta.2016.09.035. [DOI] [PubMed] [Google Scholar]
- Zhang J.; Liu D.; Cao P.; Wang Y.; Keesing J. K.; Li J.; Chen L. A highly sensitive method for analyzing marker phytoplankton pigments: Ultra-high-performance liquid chromatography-tandem triple quadrupole mass spectrometry. Limnol. Oceanogr.: Methods 2016, 14, 623–636. 10.1002/lom3.10117. [DOI] [Google Scholar]
- European Pharmacopoeia Supplement 7.0, Prednisolone 07/2011:0353, European Directorate for the Quality of Medicines, Council of Europe: Strasbourg France.
- European Directorate for the Quality of Medicines Knowledge database. Detailed view of Prednisolonum. https://extranet.edqm.eu/4DLink1/4DCGI/Web_View/mono/353.
- ICH Harmonised tripartite guideline. Validation of analytical procedures: text and methodology Q2(R1). In International Conference on Harmonization of Technical Requirements for registration of pharmaceuticals for human use, ICH: 2005.
- European Directorate for the Quality of Medicines & HealthCare European Directorate for the Quality of Medicines, Pharmaeuropa archives, Vol. 21, No. 4, Council of Europe: October 2009, p. 592.
- Dionex application brief 123. UHPLC Separation of Nine corticosteroids in under four minutes; Thermo Scientific LPLN 2729, Dionex corporation: 2016.
- General chapter 2.2.46. Chromatographic separation techniques. In European Pharmacopoeia; The Stationary Office: 2007.
- Technical guide for the elaboration of monographs, European Pharmacopoeia, 7th Ed.; European Directorate for the Quality of Medicines & HealthCare, 2015.