Abstract
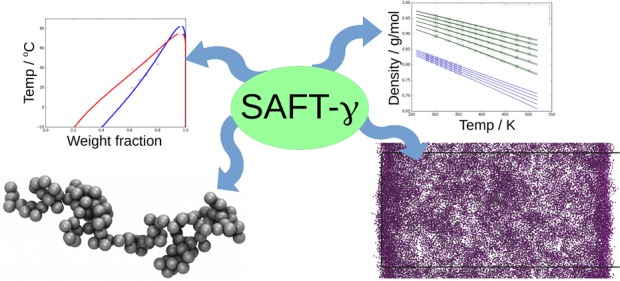
The compatibility and surface behavior of squalane–polybutadiene mixtures are studied by experimental cloud point and neutron reflectivity measurements, statistical associating fluid theory (SAFT), and molecular dynamics (MD) simulations. A SAFT-γ Mie model is shown to be successful in capturing the cloud point curves of squalane–polybutadiene and squalane–cis-polybutadiene binary mixtures, and the same SAFT-γ Mie model is used to develop a thermodynamically consistent top-down coarse-grained force field to describe squalane–polybutadiene. Coarse-grained molecular dynamics simulations are performed to study surface behavior for different concentrations of squalane, with the system exhibiting surface enrichment and a wetting transition. Simulated surface profiles are compared with those obtained by fitting to neutron reflectivity data obtained from thin films composed of deuterated squalane (d-sq)–polybutadiene. The presented top-down parametrization methodology is a fast and thermodynamically reliable approach for predicting properties of oligomer–polymer mixtures, which can be challenging for either theory or MD simulations alone.
Introduction
Quantitative prediction of the effect of oligomers in mixtures with polymers is a challenging problem and is the subject of considerable active research.1,2 In many industrially relevant polymers, oligomers are ubiquitous, appearing as additives, (e.g., tackifiers, plasticizers, compatibilizers, and reactive species) and as low molecular weight components of many polydisperse compounds.3,4 Understanding their role is therefore of critical interest in the development of new applications.5−7 In typical oligomer–polymer mixtures, micro- and macroscopic properties are affected by the molecular weight distribution, the mixture composition, the current temperature, and thermal history, in addition to chemical effects arising from (for example) differences in polarizability, polarity, and the ability to form hydrogen bonds.
Oligomers play a significant role in influencing polymer properties both in the bulk and at an interface. In bulk polymers, slow phase separation of oligomers can prove a major problem when designing stable polymer mixtures for specific applications.8 However, oligomers also exhibit a significant (sometimes beneficial) influence on polymer surfaces through surface migration, wetting transitions,9 and surface segregation (including blooming).10−15
Much progress has been made in studying phenomena such as oligomer phase separation, including theoretical approaches such as lattice integral equation theories.16 Moreover, the role of entropy in causing surface migration of low molecular weight species is well-understood.12,17 However, the influence of the surface on phase separation and the influence of bulk phase separation on surface migration, the formation of wetting layers, and surface blooming of additives are more complicated to predict quantitatively.17
Coarse-grained (CG) simulation models18−25 provide a way of studying the influence of oligomers at a molecular level. Here, accessible times scales can be many orders of magnitude longer than those available from atomistic simulations. CG models provide a way of studying surface enrichment26 and provide a direct link to surface sensitive experimental measurements, such as neutron reflectivity.2,27−30 However, there is a considerable challenge associated with the production of quantitative coarse-grained models that work well in both the bulk and at an interface and can properly represent the mixing thermodynamics (that drives phase separation) over a range of concentrations. For example, bottom-up approaches to develop coarse-grained models from an underlying atomistic description, such as iterative Boltzmann inversion (IBI)31,32 and multiscale coarse graining (MSCG)33 (force matching), have been extensively used for polymers.22,23,26,34 However, these approaches usually rely on atomistic structural information from intra- and intermolecular distribution functions, typically at a single state point. Consequently, they often perform poorly in predicting mixing free energies that determine phase separation and are often not sufficiently transferable to represent accurately the effects of temperature and pressure changes in systems with chemically distinct interaction sites.24
In contrast to bottom-up models, top-down approaches, based on SAFT theories,35−37 and MARTINI-like models25,38−40 focus on capturing macroscopic thermodynamic experimental information in the development of CG polymer models. Hence, they might be expected to perform better under conditions where oligomer–polymer phase separation may be present. The most recent incarnation of the SAFT equation of state, SAFT-γ Mie,36,37 shows improved accuracy over previous SAFT-VR versions by including higher-order perturbations. It employs a Mie potential, which provides more adaptive models and which demonstrates an improved link to molecular simulations.35,41,42 SAFT-γ Mie has successfully been applied to describe thermodynamic properties of low molecular weight compounds and their mixtures.43−53 Excellent agreement with experimental results has been demonstrated even for second-order properties such as heat capacities.36,37,44 Few SAFT-γ Mie models have been developed for higher molecular weight compounds. However, two recent successful examples involve the prediction of polyethylene densities37 and the study of polystyrene melts and polystyrene solutions in alkanes.35 These studies suggest that it may be possible to use SAFT-γ-based approaches to develop successful theoretical descriptions of oligomer/polymer systems and use the link between SAFT-γ Mie and molecular simulation to study surface behavior.
In this paper we use a combined SAFT-γ Mie and coarse-grained MD approach to build a coarse-grained model to describe a mixture of squalane and polybutadiene. This system acts as a simple model for a hot melt adhesive (HMA) in which molecular migration of the oligomeric species can take place. The theoretical approach correctly captures densities and the binary phase diagram and explains the changing surface concentration profile of squalane at the polybutadiene surface as a function of concentration. We validate the results by experimentally measuring cloud points of squalane in polybutadiene and by measuring vertical concentration profiles of deuterated squalane in a thin polymer film by neutron reflectometry (NR).
Materials and Experiments
Polybutadiene (PB) (Sigma-Aldrich P181382, cis-1,4 36%, trans-1,4, 56%, vinyl 8%) and cis-polybutadiene (cisPB) (Sigma-Aldrich P181374, cis-1,4 98%) were selected as the base polymers, along with squalane (sq) (Sigma-Aldrich P234311) as a model oligomer. Its deuterated analogue (d-sq), used in neutron reflectometry experiments, was supplied by Qmx Laboratories, U.K., D-0958/0.5, C30D62 99% deuterated. The squalane/polymer mixtures provide simple models for HMA films. The key characteristics of the polymers and model additives relevant to this study are summarized in Table 1. The molecular weights and polydispersity of the polymers were determined by gel permeation chromatography. The scattering length densities (SLDs) were calculated from the compound’s density and molecular formula.
Table 1. Physical Properties for Key Components of the Model HMA Films.
| component | Mw (g mol–1) | Mw/Mn | ni | SLD (106/Å2) |
|---|---|---|---|---|
| PB | 280000 | 2.1 | 1.5173a | 0.416 |
| cisPB | 567000 | 4.4 | 1.5230a | 0.416 |
| squalane (this work) | 423 | 1.4501a | –0.37 | |
| squalane (literature) | 423 | 1.4474b | –0.37 | |
| d-squalane | 484 | 6.75 |
Measured at 25 °C using a refractometer RFM 390 from Bellingham & Stanley Ltd.
Value of the hydrogenated analogue found in the literature (Polymer Handbook54).
Phase Diagrams
Polymer films of ≈1 mm thickness, containing various proportions of squalane, were cast from 10% (w/w) toluene solutions in Teflon dishes. The solvent was evaporated at room temperature and pressure. Evaporation was considered complete when no more weight loss could be measured with a precision scale (typically more than 4 days). The use of a vacuum oven was avoided to ensure that a minimum amount of squalane would be lost during sample preparation. The films were peeled from the Teflon dish and transferred onto a glass slide. The turbidity of the samples was assessed by the naked eye at temperatures between 0 and 60 °C to determine the cloud point, i.e., phase boundary. The Peltier stage of an AR2000ex rheometer was used to accurately heat the sample at a rate of 2 °C/min. The cloud point was measured at least twice on each sample to ensure consistency of the results.
Neutron Reflectometry (NR)
Oligomer/polymer thin films (≈100 nm) were prepared by spin-coating ∼1 mL of a 2% (w/w) toluene solution onto silicon blocks. To obtain the desired thickness, a Laurell spin-coater model WS-650-23 was used at a rotation speed of 2500 rpm (typical spinning time 30 s). The neutron reflectivity measurements were performed at the Rutherford Appleton Laboratory (ISIS pulsed neutron and muon source) in Chilton nr. Didcot, UK. The experiments used a standard air/layer/silicon setup for neutron reflectivity.55 The d-sq/PB films were analyzed by using the SURF reflectometer, while for the d-sq/PBcis mixtures, the INTER reflectometer was used. The composition profiles were obtained for these films by measuring the specular reflectivity as a function of the momentum transfer Q = 4π sin(θ/λ), with λ the neutron wavelength and θ the incident angle. Generally, measurements are performed from before the critical edge (Q ≈ 0.01 Å–1 for silicon/air) to the point at which the signal is indistinguishable from the background (Q ≈ 0.25 Å–1). Such measurements typically lasted 2.5 h but were somewhat more rapid on INTER due to the large flux and simultaneous Q range. The analysis software IGOR pro with the Motofit package56 was used to fit the neutron reflectivity data. Scattering length densities for the silicon and the native oxide layer were 2.07 × 10⁻⁶ and ≈3.45 × 10⁻⁶ Å–1, which are consistent with values reported elsewhere.2,57−59 Although it is necessary to fit NR data with model concentration profiles, the generic form of these has been previously verified by ion beam analysis,2 and key features such as the total film thickness and thickness of the excess layer are unambiguously related to the frequency of fringes in the R(Q) data.
Computational Methods
SAFT-γ Mie Models
The statistical association fluid theory (SAFT) version used in this work is the SAFT-γ Mie36,37 theory. In the nonassociating form of the theory, the Helmholtz free energy can be expressed as
| 1 |
where Aideal accounts for the ideal kinetic and translational energy contributions, Amonomer for the change in free energy due to attractive and repulsive interactions of the beads, and Achain for the free energy contribution by forming chains.
The molecular model in the SAFT-γ Mie equation of state (EoS) is a chain of tangentially connected beads interacting through Mie potentials, which can be expressed for the interaction between bead i and j as
 |
2 |
with
| 3 |
where ϵij is the potential well depth, σij is the bead diameter, and λr,ij and λa,ij are the repulsive and attractive exponents. For λr = 12 and λa = 6, the potential takes the usual form of the Lennard-Jones potential.
The unlike interactions can be obtained from the like interactions with the usual arithmetic combining rule for contact distances, σij = 1/2(σii + σjj), and the geometric combining rule for the well depth
| 4 |
Here, the additional parameter, kij, measures the extent to which the unlike interaction well depth deviates from the values given by the standard combining rules. Similarly, for the repulsive exponent
| 5 |
the additional γij parameter quantifies the deviation from the combining rule introduced by Lafitte.36 For the attractive exponent, the same combining rule is applied, but without introducing a correction factor
| 6 |
Our in-house SAFT program,60 based on the equations in the work of Lafitte et al.36 and validated against the results in this paper, and the gSAFT package (Process Systems Enterprise Ltd.)61 were used to develop the SAFT-γ Mie model.
The SAFT-γ Mie models of the PB/sq and cisPB/sq mixtures were developed in a two-step process. First, the pure component Mie potential parameters of PB, cisPB, and sq were optimized to reproduce densities across a wide range of temperatures and pressures (pVT data)62−64 of each compound. The four Mie potential parameters ϵ, σ, λr, and λa were optimized simultaneously to minimize the average absolute deviation from the reference set of densities
| 7 |
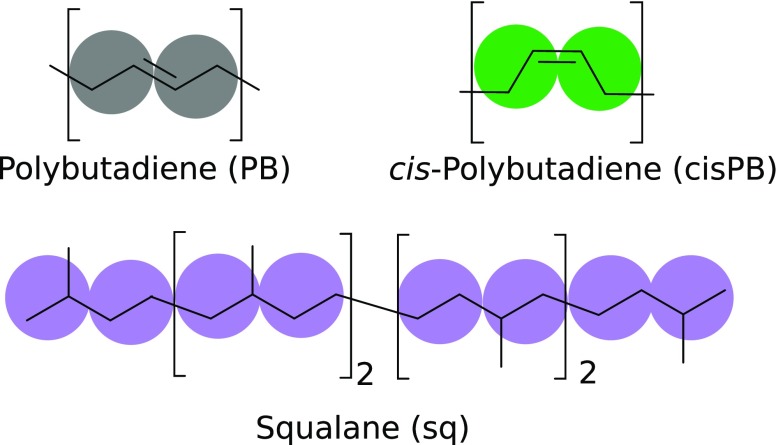
where Nexp is the number of experimental reference points. Here, the experimental density, ρexp, was compared with the density predicted by the SAFT-γ Mie model, ρSAFT, for each data point k. The number of beads per chain was set to give two beads per monomer for each compound (see Figure 1), which corresponds to a bead mass of 27 g mol–1 for PB and cisPB and 35 g mol–1 for sq. This mapping was chosen to reduce the number of beads compared to the number of atoms (coarse graining). A further decrease of the number of beads was not feasible as it either required large repulsive exponents or could not capture the compressibility and thermal expansion with the same parameter set.
Figure 1.
Mapping of SAFT beads to squalane and polybutadiene. Two beads per repetitive unit are used, one type per compound.
Second, the unlike interaction parameters between PB and sq and cisPB and sq were adjusted to reproduce each experimental cloud point curve.
We note that for many low molecular weight systems λa is often fixed at 6 in the fitting of SAFT-γ Mie models, as the exponents of optimal models are not completely independent.65 In some of our fitting work we also tried fixing λa = 6, which has the added advantage of reducing the number of variables to fit. However, this typically led to λr greater than 12 and higher than those obtained with λa free to vary. Higher repulsive exponents limit the time step that can be used in coarse-grained MD studies and thus restrict one of the major advantages of using coarse-grained MD. Hence, throughout this work, Mie parameters have been fitted for both repulsive and attractive exponents λr and λa.
In principle, SAFT can be extended to surfaces by combination with a theoretical method capable of representing the new spatial dimension while using the SAFT equations to represent the bulk free energy. Such methods are typically based on square gradient theory (SGT)66−68 and classical density functional theory (DFT).69,70 Here, however, we use a molecular dynamics (MD) approach to study surfaces based directly on the SAFT-γ Mie parameters obtained in this study, allowing surface segregation to arise naturally from the intermolecular interactions present in the model.
Coarse-Grained Molecular Dynamics Simulations
SAFT-γ Mie models have been used previously to develop force fields for a number of low-molecular-weight pure compounds44−47 and mixtures.48−52 Recently, such studies have been extended to lyotropic53 and chromonic25 liquid crystals and polymer solutions.35 The latter were developed by fitting SAFT-γ Mie theory for component parts, i.e., building blocks, and in a second step, some or all of the unlike interactions were adjusted in the molecular dynamics framework.35 However, in the current work we attempt to produce polymer and oligomer MD models directly from SAFT-γ Mie fits to experimental data.
The CGMD force field used in this work was based on the SAFT-γ Mie model developed above. Mie potentials were used to describe nonbonding interactions, together with LINCS bond constraints with equilibrium bond lengths of r0 = σij, to provide tangentially bonded spheres of diameter σij (see Figure 2). No explicit angle and dihedral potentials were applied. However, nonbonded interactions were calculated for all sites with the exception of bonded neighbors, which were excluded.
Figure 2.
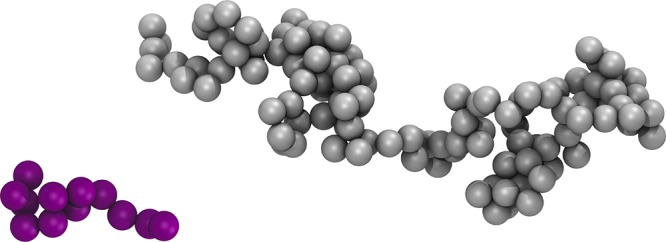
CGMD models of squalane (left, palatinate purple) consists of 12 sq beads and polybutadiene (right, gray) of 120 PB beads.
All molecular dynamics simulations were performed using GROMACS 4.6.7.71,72 The equations of motion were solved using the leapfrog integrator with a time step of 5 fs (4 fs for higher temperatures). If not stated otherwise, simulations were performed at a temperature of 298 K using the Nosé–Hoover thermostat.
The polymer chains and initial configurations were built with the Assemble! program.73 Here, we restrict the maximum size of the polymer chain to 120 beads (Figure 2), as the full length of a 2 bead per monomer chain, matching the experimental molecular weight, would be prohibitively expensive to equilibrate due to slow diffusion, high viscosity, and slow chain relaxation. For pure squalane we simulate 181 chains (2172 beads). For pure polymers we simulate chains of length 30, 40, 60, and 120 beads (4200 beads in each case). We note that the longest (120 bead) polymer chain simulated is 10× longer than the squalane chain and is therefore expected to be long enough to capture, at least semiquantitatively, the behavior of squalane–polybutadiene mixtures.
For mixtures, the following procedure was adopted by using appropriate bead numbers for different weight fractions of squalane. A randomly generated vapor mixture configuration of 48 PB and 92 squalane chains was prepared initially (∼20% (w/w) squalane). The system of cubic box size was compressed at 500 bar and 450 K for 1000 ps and pre-equilibrated at 450 K and 1 bar for 500 ps by using the Berendsen thermostat and Berendsen barostat in the constant-NpT ensemble. A full equilibration run was then performed of at least 1.5 μs duration with the Nosé–Hoover thermostat (coupling constant, τT = 1 ps) and the Parrinello–Rahman barostat (coupling constant, τp = 5 ps). The equilibrated cubic box was stacked 3 × 1 × 1 to give a 3× larger system size of ∼20K beads and further equilibrated. Additionally, a larger system size of 4 × 2 × 2 boxes with over 100000 beads was studied to look at the influence of finite size effects. The larger systems showed similar surface profiles as the smaller box of miscible systems. Lastly, a vacuum layer was added, and the system re-equilibrated in the canonical (constant-NVT) ensemble. Phase-separating systems, or systems at conditions close to the phase boundary, required extremely long equilibration times when started from a fully mixed initial state due to kinetically trapped layers. In these cases, elongated simulation boxes helped facilitate the formation of vapor–liquid interfaces.
Density profiles along the box were obtained at a series of time steps by using the GROMACS gdensity tool. As there will always be (at least) two interfaces, the slab was split into two, and the surface profiles were averaged over both interfaces. This was done by an automated postprocessing step for each saved coordinate set. Simulation snapshots were rendered with the VMD visualization package.74,75
Finally, it should be noted that in both the simulations and SAFT work only single components or binary mixtures are considered, and so the effects of polydispersity are not modeled explicitly; however, the Mie parameters used come from a fit over the range of molecular weights present in the real polymer. In terms of phase boundaries this should be a reasonable approximation for cases, such as here, where the polymer chains are much longer than oligomer. However, in other cases, where a polymer contained a significant fraction of low-molecular-weight oligomer as part of the molecular weight distribution, we would also expect to see surface enrichment of this species due to entropic reasons.12
Results and Discussion
SAFT-γ Models for Squalane, PB, and CisPB
Pure component SAFT-γ models for squalane, PB, and cisPB were obtained by simultaneously fitting the ϵii, σii, λrii, and λaii Mie potential parameters to reproduce the experimental liquid densities across a wide range of temperatures and pressures (Figure 3). The fits obtained are excellent, with average absolute deviations obtained of 0.016% for sq, 0.036% for PB, and 0.11% for cisPB, across a wide temperature (60 K for squalane, 175 K for PB, and 198.1 K for cisPB) and pressure range (400 bar for squalane and 2000 bar for PB and cisPB). The deviations of the model predictions are below the experimental uncertainties (e.g., 0.4% for ref (63)). For each system, SAFT-γ Mie leads to a single transferable set of Mie parameters that can be used to represent the entire range of experimental data (Table 2).
Figure 3.
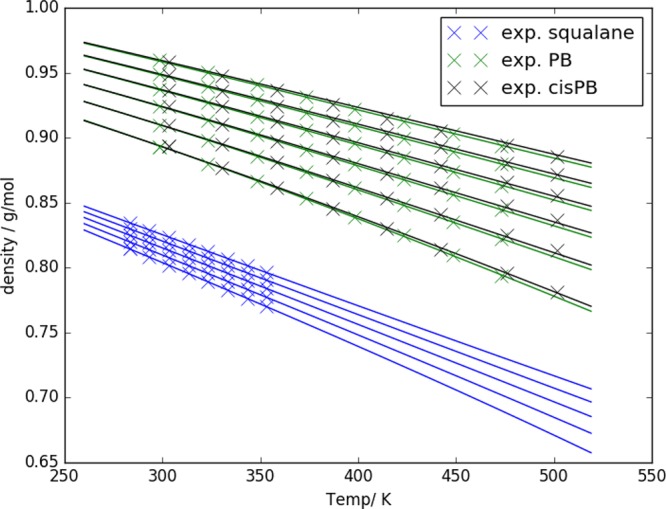
Experimental densities (symbols) of polybutadiene,62cis-polybutadiene,63 and squalane64 as a function of temperature and pressure. Results of the corresponding SAFT-γ Mie models are represented with lines. For squalane curves range from 1 bar (lowest) to 400 bar (highest), and for PB and cisPB curves range from 1 bar (lowest) to 2000 bar (highest).
Table 2. SAFT-γ Mie Nonbonded Parameters Obtained in This Study.
| bead i | bead j | λr,ij | λa,ij | σij (nm) | ϵij/kB (K) | mass (g/mol) | combining rule |
|---|---|---|---|---|---|---|---|
| PB | PB | 10.0 | 5.7 | 0.3583 | 272.0 | 27 | |
| cisPB | cisPB | 8.5 | 6.5 | 0.3574 | 282.3 | 27 | |
| sq | sq | 10.2 | 7.6 | 0.4006 | 358.7 | 35 | |
| PB | sq | 9.303 | 6.524 | 0.3795 | 301.3 | 27, 35 | k = 0.03088, γ = 0.1122 |
| cisPB | sq | 8.208 | 7.012 | 0.3790 | 294.4 | 27, 35 | k = 0.07021, γ = 0.1724 |
Although a wide range of experimental state points is covered in Figure 3, we note that only PVT data have been considered in the fitting process. For many low-molecular-weight molecules, additional high-quality data are often available: for example, derivative properties, such as speed of sound measurements, can often be measured to high precision and are considered challenging to fit for thermodynamics models.76 While such data are not easy to obtain for polymers (e.g., for high-viscosity reasons in the case of speed of sound measurements), including additional high-quality thermodynamic-derived data in the fitting process may further improve upon the transferability of the Mie parameters obtained in this work.
Molecular Dynamics Simulations of Pure Components
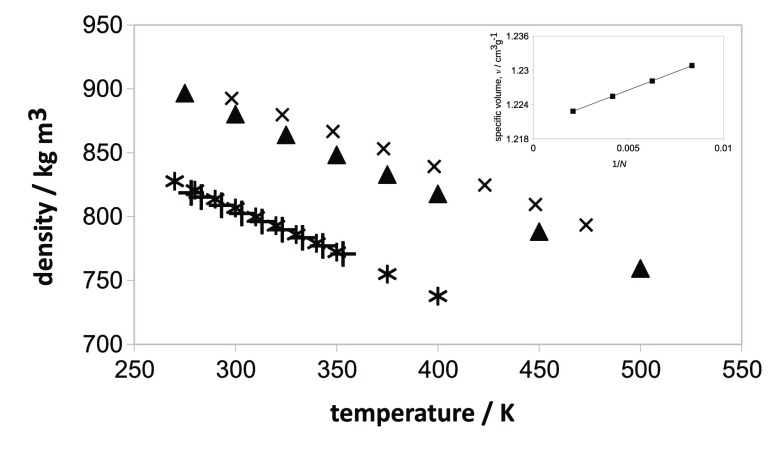
Figure 4 shows a comparison of simulated and experimental densities for pure squalane and pure polybutadiene. The simulation results are surprisingly good and testify to the effectiveness of SAFT-γ Mie as a procedure for generating coarse-grained simulation models without reference to an underlying atomistic description. For squalane, agreement is particularly good at higher temperatures (<0.01% error at 343.15 K) but even at the lowest experimental temperature in Figure 4 of 278.15 K, where we would expect some differences between simulation and experiment due to the lack of chain rigidity (no angle bending terms are included), the error is only 0.4%.
Figure 4.
Comparison of simulated and experimental densities as a function of temperature at 1 atm for squalane and for polybutadiene. Squalane simulation: stars; squalane experiment: pluses; PB simulation: triangles (for 120 beads, Mw = 3210 g mol–1); PB experiment: crosses (Mw = 280000 g mol–1). Simulation results use potentials generated directly from the SAFT-γ Mie model with bond constraints. The inset shows the specific volume, v, plotted as a function of 1/N, where N is the number of backbone carbons, in chains corresponding to 120, 60, 40, and 30 coarse-grained beads at 400 K and 1 atm.
For polybutadiene, we expect density to increase with increasing chain length for the moderate chain lengths simulated here but for the density to become largely independent of chain length as the chain becomes sufficiently long (i.e., an indicator of true polymeric behavior). It is usual to represent the specific volume, v, by a hyperbolic equation77
| 8 |
where N is the number of backbone carbon atoms in a chain (2 per coarse-grained bead), v∞ is the specific volume at infinite chain length, and v0 is a proportionality constant describing the rate of decrease of v with increasing chain length. For PB chains with 120, 60, 40, and 30 coarse-grained beads, eq 8 yields a straight line plot (inset diagram in Figure 4) allowing v∞ to be estimated as 1.2202 cm3 g–1. This is an error of 2.1% in comparison to experiment for chains of Mw = 280000 g mol–1, ignoring any effects arising from polydispersity or the presence of 1,2-PB or cis-1,4-PB chains. As the SAFT model has been parametrized for experimental chain lengths (rather than the simulated chain lengths), this represents an excellent degree of transferability between molecular weights.
In addition, from the slope of the lines in Figure 4, the coarse-grained models for squalane and PB correctly capture the isobaric thermal expansion behavior, a good indicator of transferability of nonbonded bonded potentials. We note that thermal expansion is often represented poorly within bottom-up structure-based coarse-grained models (particularly if these are obtained from iterative Boltzmann inversion24) because of the strong density dependence of IBI nonbonded potentials.
We note in passing that, by design, the coarse-grained simulation model does not include angular terms in the force field. For longer chains these are expected to improve the structural representation of the chains (e.g., by providing a better radius of gyration). In the work of Morgado et al.,78 for short perfluoroalkylalkanes, bond length and bond angle potentials were successfully added to intermolecular parameters obtained by using the SAFT-γ Mie EoS. However, for the polymers used in this work, this approach cannot be used without a reparametrization of the nonbonded interactions (otherwise bulk densities are effected by addition of bond angle potentials). A slightly different approach was adopted in the work of Walker et al.,79 who have developed a fused-sphere SAFT-γ Mie force field for poly(vinyl alcohol) and poly(ethylene). This approach uses the shape factor parameter within the fused-sphere SAFT-γ Mie theory, together with iterative Boltzmann inversion from fully atomistic simulations, to derive effective bond stretch and bend parameters, in addition to developing empirical correlations between the shape factor and the standard Mie parameters. Although this approach requires several steps, good agreement was obtained between the atomistic and coarse-grained radius of gyration and end-to-end distance distribution functions. A valuable extension to the SAFT-γ Mie theory would be provided by the addition of angle terms, which would allow a SAFT-based top-down coarse-graining methodology to better capture structural data in addition to thermodynamic data for longer chain polymers. However, this is not easy to achieve within the current formulation of the theory.
Mixture Compatibility
The measurements of cloud point temperatures for squalane in polybutadiene and cis-polybutadiene are plotted in Figure 5 along with fits obtained from SAFT-γ. If standard combining rules for Mie potentials could be used without kij and γij parameters, then SAFT-γ Mie would provide an easy way to predict directly multicomponent phase diagrams for polymer–polymer and polymer–oligomer systems without the need for additional experimental data on mixing. Unfortunately, setting kij = γij = 0, and using only combining rules for all unlike interaction Mie parameters (ϵij, σij, λrij, and λaij), SAFT-γ Mie predicts complete immiscibility for squalane–polymer binary mixtures of polybutadiene and cis-polybutadiene. For kij = γij = 0, we attempted also to fit the mixture and pure component data at the same time using combining rules for (ϵij, σij, λrij, and λaij) values and also attempted to fit the same data with λaij fixed to a value of 6 (the usual value for the attractive exponent). Neither of these approaches was successful. Keeping the SAFT-γ Mie parameters from pure component systems and adjusting kij to fit the cloud point curves provides a model that predicts partial miscibility, as seen experimentally, but with lower miscibility at high temperatures (LCST behavior), not improved miscibility at higher temperatures (UCST behavior). However, the γij parameter can change the system from an LCST to UCST mixture, as both Mie potential exponents change the cloud point curve’s slope and curvature around the critical region. Optimized simultaneously, kij and γij give enough flexibility to obtain partially miscible UCST models for both systems, in good agreement with the experimental cloud point temperatures. The optimized Mie potential parameters for the mixtures are listed in Table 2.
Figure 5.
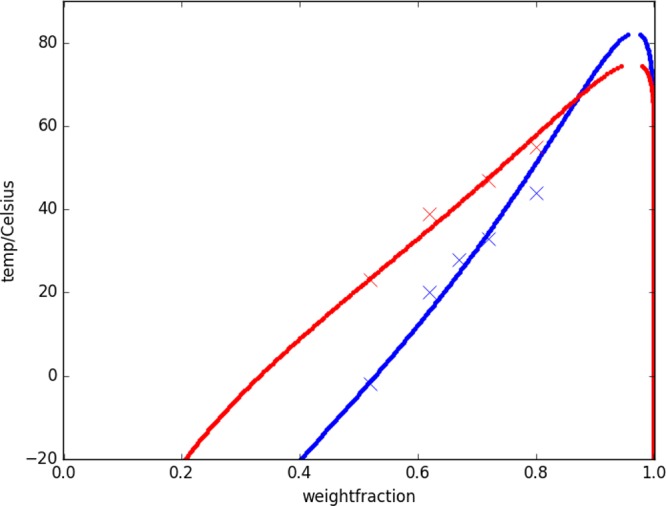
Cloud point temperatures of squalane in polybutadiene (blue) and cis-polybutadiene (red). Comparison of results with the SAFT-γ Mie models (lines) and experimental data (crosses).
The final binary SAFT-γ Mie models for the mixtures sq/PB and sq/cisPB capture the cloud point curves and its UCST nature well. The exact UCST could not be experimentally measured due to the fact that samples at concentration of squalane above 80% (w/w) were not homogeneous enough to properly determine the temperature of the cloud point. However, it can be inferred that the experiment UCST, based on the curvature of the cloud point curve, is at a slightly lower squalane weight fraction than predicted by the SAFT model.
It is well-known that deuterium labeling can cause a small shift to phase boundaries. Because of the limited amount of deuterated squalane available, it was not possible to test this fully by measuring a complete phase diagram. However, we did confirm that deuteration of squalane has little effect on the UCST phase boundary with PB, with values of 53.8 and 49.2 ± 1 °C at 15 and 20 wt % PB in squalane, respectively.
Surface Enrichment/Partial Wetting: Neutron Reflectivity
Initially, we checked for the presence of a wetting layer of squalane at the surface of PB for a 50% (w/w) mixture (Figure 6). The wetting layer shows some temperature dependence, with surface segregation decreasing with increasing temperature. In addition, increasing the temperature to 45 °C from 25 °C, and then cooling back to the lower temperature, recovers the lower temperature results, suggesting that the results are equilibrium data and do not show hysteresis or suffer from significant problems with evaporation.
Figure 6.
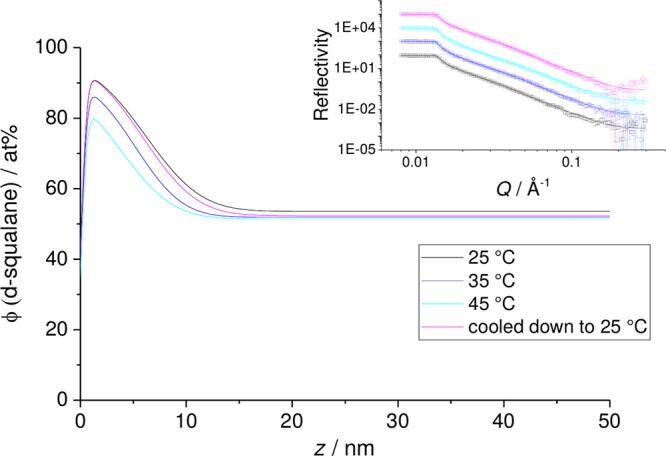
50% (w/w) d-sq in a thin film PB sample, as a function of increasing temperature from 25 °C, followed by cooling back to 25 °C. Inset: NR data measured with SURF and fits. Main figure: volume fraction profiles corresponding to the fits in the inset.
In Figure 7, we look at the surface enrichment of squalane for PB and PBcis films of different bulk concentrations. As the concentration of squalane in the mixture increases for both systems, we see a transition from surface segregation (up to a monolayer of squalane) to a full wetting layer. For PB–squalane this occurs at a bulk concentration of ∼40% (w/w). The presence of a wetting layer of higher scattering length density than the silicon substrate is evident as a shift in critical edge of R(Q) to Q > 0.01 Å–1. The thickness of the wetting layer continues to increase with increasing bulk concentration. (We note in passing that specular NR is only sensitive to a one-dimensional concentration profile and not to any variation in concentration lateral to the surface.) For PBcis the transition to a wetting layer occurs at a lower bulk concentration of squalane (∼30% (w/w)). This result can be expected from the two binary phase diagrams where for fixed temperature the two-phase region extends to lower squalane concentrations for PBcis.
Figure 7.
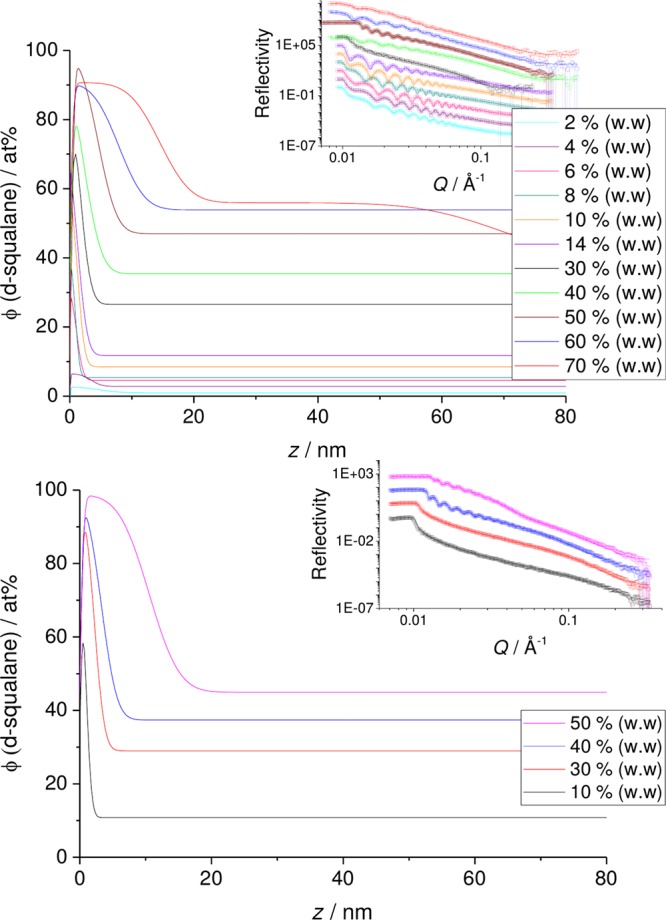
d-sq in thin films of PB (top) and PBcis (bottom) plotted for films of varying d-sq concentration. Insets: NR data measured with SURF and INTER and fits. Main figures: profiles corresponding to the fits in the inset.
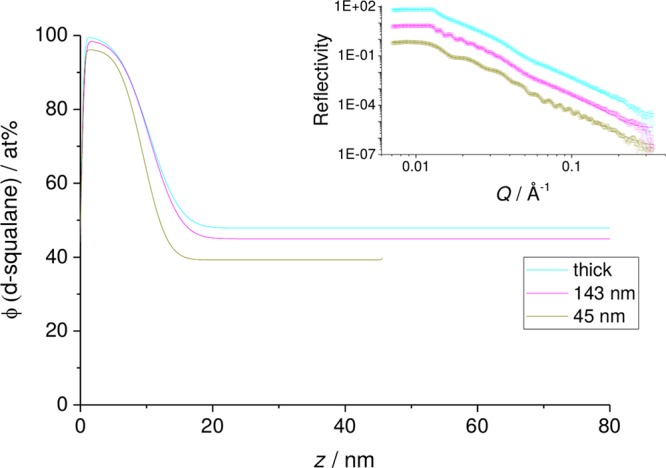
Within the two-phase region it might be expected that the thickness of the surface wetting layer of squalane would depend on the thickness of the bulk film. However, this appears not to be the case. In Figure 8 we show results for PBcis from films of thickness 45 and 145 nm and a thick film (>300 nm). In these measurements the surface layer appears to be largely independent of film thickness and so appears to be in equilibrium with a phase-separated bulk system.
Figure 8.
50% (w/w) d-sq in a thin film PB sample, as a function of increasing temperature from 25 °C, followed by cooling back to 25 °C. Inset: NR data measured with SURF and fits. Main figure: volume fraction profiles corresponding to the fits in the inset.
Surface Enrichment/Partial Wetting: Molecular Dynamics
While the full experimental PB chain lengths are not accessible to the two-bead per-monomer chains used in this study, MD simulations can still be used in a semiquantitative way to study surface enrichment. Initial MD simulations of the squalane–polybutadiene mixture were performed at 450 K using parameters directly obtained from the SAFT-γ Mie models (above) and the standard mixing rules (eqs 3–6, kij = 0). As the concentration of squalane is increased, the mixture undergoes phase separation, as seen experimentally. At all concentrations, the presence of a polymer surface leads directly to migration of the squalane to the surface, as shown by the simulation snapshot in Figure 9. At lower concentrations of squalane, for miscible mixtures, simple surface enrichment occurs. This behavior changes to a wetting layer at higher compositions with the wetting transition occurring between 40% and 60% (w/w) of squalane. As discussed above, the surface enrichment of the lower molecular weight species can be an entropy-driven effect, arising from the greater number of chain ends present in the lower molecular weight species. This effect has been seen previously in lattice models and in neutron reflectivity studies of mixtures and also single species polymers with different molecular weight components.12,13
Figure 9.
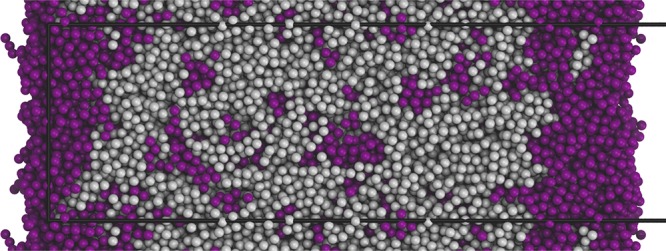
Molecular dynamics snapshot of an equilibrated polybutadiene (gray) and squalane (palatinate purple) layer after 290 ns of migration time (initial concentration of squalane 40% (w/w)). The snapshot shows a slice through the layer with surfaces at the left and right side. The surface enrichment and bulk depletion of squalane is visible. The black box represents the explicitly modeled unit cell.
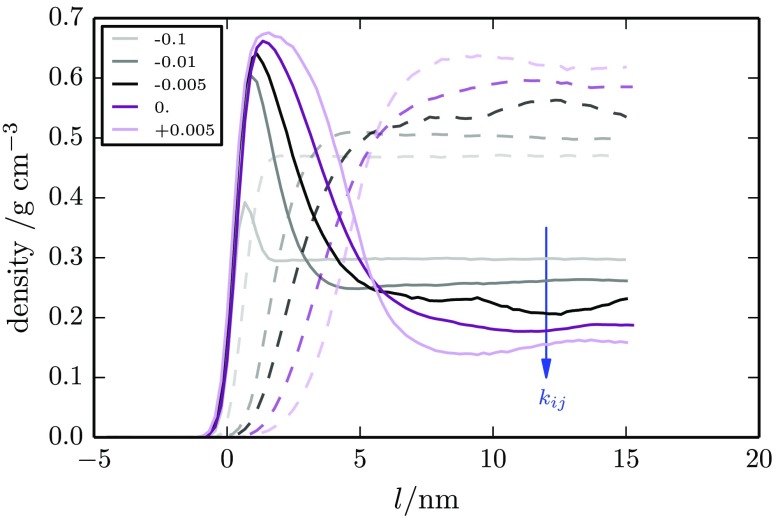
We additionally performed a series of simulation sweeps at 450 K as a function of squalane concentration and mixing parameter kij. Entropy-driven migration of squalane to the surface was found for all kij values studied. Here, bulk compatibility occurs at all concentrations for kij ≤ −0.01 and bulk immiscibility for kij > +0.005. For miscible systems, equilibration times are very fast on the order of a few tens of nanoseconds. However, equilibration becomes much slower when bulk phase separation occurs (see the Supporting Information for time sequence snapshots). Phase separation typically occurred over 80 ns when started from an initially homogeneous system, but equilibration of the surface layer depends on slow diffusion of phase-separated regions of squalane to the surface through the polymer film (microseconds time scales). Consequently, the time required for equilibration also increases with increasing system size. A typical sequence of curves is shown in Figure 10 for an initial bulk squalane concentration of 40% (w/w) with kij parameters ranging from −0.1 (most compatible) to +0.005 (least compatible). As the unlike interaction parameter, kij, is reduced, we see a move from surface segregation to a full wetting layer, with the thickness of the surface enrichment layer influenced by the value of kij. Thicknesses of between 2 and 7 nm are found for the 40% (w/w) system (see Figure 10). These are consistent with experiment and in many cases larger than molecular dimensions. For comparison, a fully stretched squalane chain is 4.8 nm long. (Concentration sweeps are included in the Supporting Information for kij = 0.0, −0.00165, and −0.01 along with results for larger systems of 102K particles, including results for a full wetting layer at kij = +0.02.)
Figure 10.
Squalane and polymer surface density profiles obtained by CGMD at 450 K for systems with differing unlike interaction parameter kij, ranging from attractive (kij = −0.1) to repulsive (kij = +0.005). The partial density of oligomers is shown by bold lines, and the partial density of polymers is shown by dashed lines. Surface enrichment varies from a small concentration increase at the surface to a pure squalane surface layer. An initial constant global squalane concentration of 40% (w/w) was used for each simulation. Results for higher values of kij are shown in the Supporting Information.
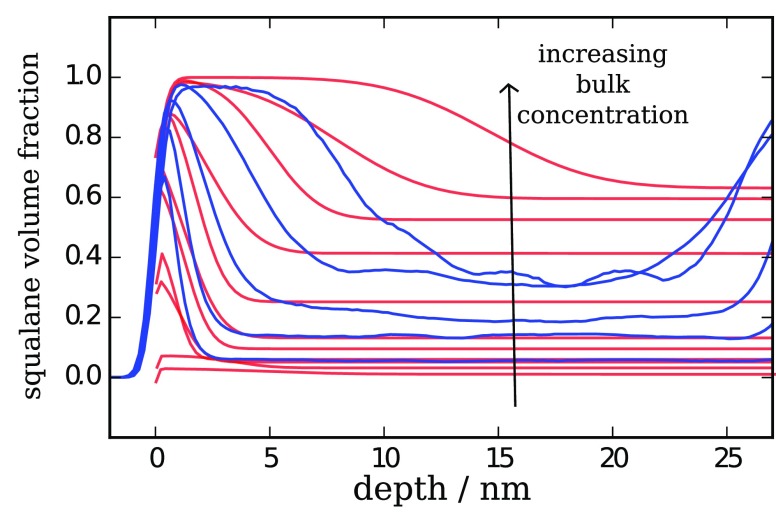
A useful semiquantitative comparison to the experimentally obtained NR surface profiles is provided when the energetic unlike interaction is set to kij = 0, as given directly by the combining rules. Here, the slightly higher temperature used for simulations to achieve fast equilibration and the lower molecular weight of the PB chains offsets the need for the correction factors kij and γij required for the full SAFT-γ Mie mixture model. We show comparison plots in Figure 11 for a range of concentrations experimentally and from simulation. As the bulk concentrations within the simulations are strongly influenced by migration, we note that comparison should be made for curves with similar bulk volume fractions. For CGMD and experiment we see incomplete surface coverage at low concentrations, and with increasing bulk concentrations, we see the maximum surface volume fraction of squalane approaches unity before the surface layer thickens significantly. In both cases, at the highest squalane concentrations, the surface layer thickness exceeds the dimensions of a single squalane molecule, ∼3 nm. However, we note that the predicted profiles are slightly steeper than the experimentally determined profiles, at both low and high squalane compositions, which are likely attributable to chain conformations being slightly too collapsed (smaller radius of gyration for chains) within the SAFT-derived MD model and also noting we are simulating polymer chains of shorter length than experiment. As above, we note that potential improvements to the MD force fields could be made through the simulation of longer chains and also the addition of angle and dihedral potentials, which will slightly increase the radius of gyration of the chains. These changes are also expected to result in rougher interfaces.
Figure 11.
Squalane concentration profiles at a PB surface. A semiquantitative comparison is shown for experimental neutron reflectometry (red) and coarse-grained molecular dynamics simulation results (blue) at a series of d-squalane concentrations. Red lines show the changing profile for increasing concentrations of bulk d-squalene: 2, 4, 6, 8, 10, 14, 30, 40, 50, 60, and 70% (w/w). Blue lines show the effect of increasing the initial bulk concentration of squalane in a series of simulations. Note that for the CGMD results the second surface at roughly 30 nm impacts the bulk region for higher concentrations, and surface enrichment significantly reduces the bulk concentration within the simulation.
Conclusion
SAFT-γ Mie models for the sq/PB and sq/cisPB mixture are presented, which capture both liquid melt densities over a large pressure and temperature range and the blend compatibility across a wide range of temperatures and compositions.
In addition, the SAFT-γ Mie theory was used to directly produce a coarse-grained molecular dynamics (CGMD) model for the pure PB and squalane components and PB/sq mixtures in the presence of free surfaces. The CGMD provided excellent predictions for the temperature dependence of densities for squalane and very good predictions for PB, showing good transferability over different state points. The PB/sq mixture simulations were used to provide insights into the oligomer surface concentration profiles measured with neutron reflectrometry. For the latter we saw surface enrichment at lower squalane concentrations and a full wetting layer at high concentrations. Simulations with the CGMD force field were able to capture comparable surface enrichment from small bulk concentrations to the formation of a wetting layer.
This work provides one of the first CGMD simulations of a partially miscible oligomer/polymer mixture developed using the SAFT-γ Mie equation of state. Using this approach, it should be possible to predict, at least semiquantitatively, the surface migration behavior of a wide range of oligomers and polymers from their pVT data and phase behavior alone. Limitations of the method and possible improvements to SAFT-γ Mie and the CGMD potentials were discussed.
Acknowledgments
We are grateful to the European Commission (through the Marie Sklodowska-Curie actions 606869-MICSED) for funding this project and to Procter and Gamble (Germany), our partner, for helpful discussions. We also thank EPSRC for funding through grant EP/P007864/1. We thank STFC for provision of the ISIS neutron reflectometry facilities and beamtime award RB1510402. We thank Dr. Buddhapriya Chakrabarti (Sheffield University), Dr. Gabriela Schafer, Dr. Torsten Lindner, and Dr. Jan Claussen (P&G, Germany) for many helpful and stimulating discussions. The authors thank PSE Ltd. for the use of its numerical solvers provided by the gSAFT package.
Supporting Information Available
The Supporting Information is available free of charge at https://pubs.acs.org/doi/10.1021/acs.macromol.9b02155.
Phase boundaries obtained for PB/d-sq using different heating and cooling rates; simulation time snapshots showing development of a surface wetting layer for a 102K bead CGMD simulation 40% w/w oligomer; squalane and polymer surface density profiles obtained by CGMD for a larger 102K bead system for different values of kij and different bulk concentrations (PDF)
The authors declare no competing financial interest.
Supplementary Material
References
- Stein G. E.; Laws T. S.; Verduzco R. Tailoring the Attraction of Polymers toward Surfaces. Macromolecules 2019, 52, 4787–4802. 10.1021/acs.macromol.9b00492. [DOI] [Google Scholar]
- Sabattié E. F.; Tasche J.; Wilson M. R.; Skoda M. W.; Hughes A.; Lindner T.; Thompson R. L. Predicting oligomer/polymer compatibility and the impact on nanoscale segregation in thin films. Soft Matter 2017, 13, 3580–3591. 10.1039/C7SM00048K. [DOI] [PubMed] [Google Scholar]
- Feldstein M. M.; Dormidontova E. E.; Khokhlov A. R. Pressure sensitive adhesives based on interpolymer complexes. Prog. Polym. Sci. 2015, 42, 79–153. 10.1016/j.progpolymsci.2014.10.006. [DOI] [Google Scholar]
- Ojijo V.; Ray S. S. Super toughened biodegradable polylactide blends with non-linear copolymer interfacial architecture obtained via facile in-situ reactive compatibilization. Polymer 2015, 80, 1–17. 10.1016/j.polymer.2015.10.038. [DOI] [Google Scholar]
- DeVane R. H.; Wagner M. S.; Murch B. P. In Materials Research for Manufacturing; Madsen L. D., Svedberg E. B., Eds.; Springer International Publishing: Cham, 2016; Vol. 224, pp 303–328. [Google Scholar]
- Li J.; Pu K. Development of organic semiconducting materials for deep-tissue optical imaging, phototherapy and photoactivation. Chem. Soc. Rev. 2019, 48, 38–71. 10.1039/C8CS00001H. [DOI] [PubMed] [Google Scholar]
- Lin Y.; Zhan X. Oligomer molecules for efficient organic photovoltaics. Acc. Chem. Res. 2016, 49, 175–183. 10.1021/acs.accounts.5b00363. [DOI] [PubMed] [Google Scholar]
- Dopico-García M.; Lopez-Vilarino J.; González-Rodríguez M. Antioxidant content of and migration from commercial polyethylene, polypropylene, and polyvinyl chloride packages. J. Agric. Food Chem. 2007, 55, 3225–3231. 10.1021/jf070102+. [DOI] [PubMed] [Google Scholar]
- Geoghegan M. Wetting at Polymer Surfaces and Interfaces. Prog. Polym. Sci. 2003, 28, 261–302. 10.1016/S0079-6700(02)00080-1. [DOI] [Google Scholar]
- Nouman M.; Saunier J.; Jubeli E.; Yagoubi N. Additive blooming in polymer materials: Consequences in the pharmaceutical and medical field. Polym. Degrad. Stab. 2017, 143, 239–252. 10.1016/j.polymdegradstab.2017.07.021. [DOI] [Google Scholar]
- Torregrosa-Coque R.; Álvarez-García S.; Martín-Martínez J. M. Effect of temperature on the extent of migration of low molecular weight moieties to rubber surface. Int. J. Adhes. Adhes. 2011, 31, 20–28. 10.1016/j.ijadhadh.2010.09.002. [DOI] [Google Scholar]
- Hariharan A.; Kumar S. K.; Russell T. P. A lattice model for the surface segregation of polymer chains due to molecular weight effects. Macromolecules 1990, 23, 3584–3592. 10.1021/ma00217a009. [DOI] [Google Scholar]
- Hariharan A.; Kumar S. K.; Russell T. P. Reversal of the Isotopic Effect in the Surface Behavior of Binary Polymer Blends. J. Chem. Phys. 1993, 98, 4163–4173. 10.1063/1.465024. [DOI] [Google Scholar]
- Briddick A.; Fong R. J.; Sabattié E. F.; Li P.; Skoda M. W.; Courchay F.; Thompson R. L. Blooming of smectic surfactant/plasticizer layers on spin-cast poly (vinyl alcohol) films. Langmuir 2018, 34, 1410–1418. 10.1021/acs.langmuir.7b04046. [DOI] [PubMed] [Google Scholar]
- Koberstein J. T. Molecular design of functional polymer surfaces. J. Polym. Sci., Part B: Polym. Phys. 2004, 42, 2942–2956. 10.1002/polb.20157. [DOI] [Google Scholar]
- Higgins J. S.; Lipson J. E. G.; White R. P. A Simple Approach to Polymer Mixture Miscibility. Philos. Trans. R. Soc., A 2010, 368, 1009–1025. 10.1098/rsta.2009.0215. [DOI] [PMC free article] [PubMed] [Google Scholar]
- Krawczyk J.; Croce S.; McLeish T. C. B.; Chakrabarti B. Elasticity Dominated Surface Segregation of Small Molecules in Polymer Mixtures. Phys. Rev. Lett. 2016, 116, 208301. 10.1103/PhysRevLett.116.208301. [DOI] [PubMed] [Google Scholar]
- Kremer K.; Grest G. S. Dynamics of Entangled Linear Polymer Melts: A MD Simulation. J. Chem. Phys. 1990, 92, 5057. 10.1063/1.458541. [DOI] [Google Scholar]
- Baschnagel J.; Binder K.; Doruker P.; Gusev A. A.; Hahn O.; Kremer K.; Mattice W. L.; Muller-Plathe F.; Murat M.; Paul W.; Santos S.; Suter U. W.; Tries V. Bridging the Gap between Atomistic and Coarse-Grained Models of Polymers: Status and Perspectives. Advances in polymer science 2000, 152, 41–156. 10.1007/3-540-46778-5_2. [DOI] [Google Scholar]
- Carbone P.; Varzaneh H. A. K.; Chen X.; Müller-Plathe F. Transferability of Coarse-Grained Force Fields: The Polymer Case. J. Chem. Phys. 2008, 128, 064904. 10.1063/1.2829409. [DOI] [PubMed] [Google Scholar]
- Faller R.; Muller-Plathe F. Modeling of Poly(Isoprene) Melts on Different Scales. Polymer 2002, 43, 621–628. 10.1016/S1089-3156(01)00013-7. [DOI] [Google Scholar]
- Peter C.; Kremer K. Multiscale Simulation of Soft Matter Systems. Faraday Discuss. 2010, 144, 9–24. 10.1039/B919800H. [DOI] [PubMed] [Google Scholar]
- Peter C.; Kremer K. Multiscale Simulation of Systems – from the Atomistic to the Coarse-Grained Level and Back. Soft Matter 2009, 5, 4357. 10.1039/b912027k. [DOI] [Google Scholar]
- Potter T. D.; Tasche J.; Wilson M. R. Assessing the transferability of common top-down and bottom-up coarse-grained molecular models for molecular mixtures. Phys. Chem. Chem. Phys. 2019, 21, 1912–1927. 10.1039/C8CP05889J. [DOI] [PubMed] [Google Scholar]
- Potter T. D.; Tasche J.; Barrett E. L.; Walker M.; Wilson M. R. Development of New Coarse-Grained Models for Chromonic Liquid Crystals: Insights from Top-down Approaches. Liq. Cryst. 2017, 44, 1979–1989. 10.1080/02678292.2017.1342005. [DOI] [Google Scholar]
- Prasitnok K.; Wilson M. R. A Coarse-Grained Model for Polyethylene Glycol in Bulk Water and at a Water/Air Interface. Phys. Chem. Chem. Phys. 2013, 15, 17093. 10.1039/c3cp52958d. [DOI] [PubMed] [Google Scholar]
- Jones R. A.; Norton L. J.; Shull K. R.; Kramer E. J.; Felcher G. P.; Karim A.; Fetters L. J. Interfacial segment density profiles of end-anchored polymers in a melt. Macromolecules 1992, 25, 2359–2368. 10.1021/ma00035a012. [DOI] [Google Scholar]
- Norton L. J.; Kramer E. J.; Bates F. S.; Gehlsen M. D.; Jones R. A. L.; Karim A.; Felcher G. P.; Kleb R. Neutron Reflectometry Study of Surface Segregation in an Isotopic Poly(Ethylenepropylene) Blend: Deviation from Mean-Field Theory. Macromolecules 1995, 28, 8621–8628. 10.1021/ma00129a022. [DOI] [Google Scholar]
- Mansfield T.; Iyengar D.; Beaucage G.; McCarthy T.; Stein R.; Composto R. Neutron reflectivity studies of end-grafted polymers. Macromolecules 1995, 28, 492–499. 10.1021/ma00106a012. [DOI] [Google Scholar]
- Briddick A.; Li P.; Hughes A.; Courchay F.; Martinez A.; Thompson R. L. Surfactant and plasticizer segregation in thin poly (vinyl alcohol) films. Langmuir 2016, 32, 864–872. 10.1021/acs.langmuir.5b03758. [DOI] [PubMed] [Google Scholar]
- Faller R. Automatic Coarse Graining of Polymers. Polymer 2004, 45, 3869–3876. 10.1016/j.polymer.2003.11.053. [DOI] [Google Scholar]
- Sun Q.; Faller R. Phase Separation in Polyisoprene/Polystyrene Blends by a Systematically Coarse-Grained Model. J. Chem. Phys. 2007, 126, 144908. 10.1063/1.2715588. [DOI] [PubMed] [Google Scholar]
- Rosch T. W.; Brennan J. K.; Izvekov S.; Andzelm J. W. Exploring the Ability of a Multiscale Coarse-Grained Potential to Describe the Stress-Strain Response of Glassy Polystyrene. Phys. Rev. E 2013, 87, 042606. 10.1103/PhysRevE.87.042606. [DOI] [PubMed] [Google Scholar]
- Sun Q.; Faller R. Systematic Coarse-Graining of a Polymer Blend: Polyisoprene and Polystyrene. J. Chem. Theory Comput. 2006, 2, 607–615. 10.1021/ct600065v. [DOI] [PubMed] [Google Scholar]
- Jiménez-Serratos G.; Herdes C.; Haslam A. J.; Jackson G.; Müller E. A. Group contribution coarse-grained molecular simulations of polystyrene melts and polystyrene solutions in alkanes using the SAFT-γ force field. Macromolecules 2017, 50, 4840–4853. 10.1021/acs.macromol.6b02072. [DOI] [Google Scholar]
- Lafitte T.; Apostolakou A.; Avendaño C.; Galindo A.; Adjiman C. S.; Müller E. A.; Jackson G. Accurate Statistical Associating Fluid Theory for Chain Molecules Formed from Mie Segments. J. Chem. Phys. 2013, 139, 154504. 10.1063/1.4819786. [DOI] [PubMed] [Google Scholar]
- Papaioannou V.; Lafitte T.; Avendaño C.; Adjiman C. S.; Jackson G.; Müller E. A.; Galindo A. Group Contribution Methodology Based on the Statistical Associating Fluid Theory for Heteronuclear Molecules Formed from Mie Segments. J. Chem. Phys. 2014, 140, 054107. 10.1063/1.4851455. [DOI] [PubMed] [Google Scholar]
- Panizon E.; Bochicchio D.; Monticelli L.; Rossi G. MARTINI Coarse-Grained Models of Polyethylene and Polypropylene. J. Phys. Chem. B 2015, 119, 8209–8216. 10.1021/acs.jpcb.5b03611. [DOI] [PubMed] [Google Scholar]
- Marrink S. J.; Risselada H. J.; Yefimov S.; Tieleman D. P.; de Vries A. H. The MARTINI Force Field: Coarse Grained Model for Biomolecular Simulations. J. Phys. Chem. B 2007, 111, 7812–7824. 10.1021/jp071097f. [DOI] [PubMed] [Google Scholar]
- Nawaz S.; Carbone P. Coarse-Graining Poly(Ethylene Oxide)–Poly(Propylene Oxide)–Poly(Ethylene Oxide) (PEO–PPO–PEO) Block Copolymers Using the MARTINI Force Field. J. Phys. Chem. B 2014, 118, 1648–1659. 10.1021/jp4092249. [DOI] [PubMed] [Google Scholar]
- Müller E. A.; Jackson G. Force-Field Parameters from the SAFT-γ Equation of State for Use in Coarse-Grained Molecular Simulations. Annu. Rev. Chem. Biomol. Eng. 2014, 5, 405–427. 10.1146/annurev-chembioeng-061312-103314. [DOI] [PubMed] [Google Scholar]
- Herdes C.; Ervik Å.; Mejía A.; Müller E. A. Prediction of the water/oil interfacial tension from molecular simulations using the coarse-grained SAFT-γ Mie force field. Fluid Phase Equilib. 2018, 476, 9–15. 10.1016/j.fluid.2017.06.016. [DOI] [Google Scholar]
- Doubek M.; Vacek V. Speed of Sound Data in Pure Refrigerants R-116 and R-218 and Their Mixtures: Experiment and Modeling. J. Chem. Eng. Data 2016, 61, 4046–4056. 10.1021/acs.jced.6b00536. [DOI] [Google Scholar]
- Avendaño C.; Lafitte T.; Galindo A.; Adjiman C. S.; Jackson G.; Müller E. A. SAFT-γ Force Field for the Simulation of Molecular Fluids. 1. A Single-Site Coarse Grained Model of Carbon Dioxide. J. Phys. Chem. B 2011, 115, 11154–11169. 10.1021/jp204908d. [DOI] [PubMed] [Google Scholar]
- Avendaño C.; Lafitte T.; Adjiman C. S.; Galindo A.; Müller E. A.; Jackson G. SAFT-γ Force Field for the Simulation of Molecular Fluids: 2. Coarse-Grained Models of Greenhouse Gases, Refrigerants, and Long Alkanes. J. Phys. Chem. B 2013, 117, 2717–2733. 10.1021/jp306442b. [DOI] [PubMed] [Google Scholar]
- Lafitte T.; Avendaño C.; Papaioannou V.; Galindo A.; Adjiman C. S.; Jackson G.; Müller E. A. SAFT- γ Force Field for the Simulation of Molecular Fluids: 3. Coarse-Grained Models of Benzene and Hetero-Group Models of n -Decylbenzene. Mol. Phys. 2012, 110, 1189–1203. 10.1080/00268976.2012.662303. [DOI] [Google Scholar]
- Lobanova O.; Avendaño C.; Lafitte T.; Müller E. A.; Jackson G. SAFT-γ Force Field for the Simulation of Molecular Fluids: 4. A Single-Site Coarse-Grained Model of Water Applicable over a Wide Temperature Range. Mol. Phys. 2015, 113, 1228–1249. 10.1080/00268976.2015.1004804. [DOI] [Google Scholar]
- Lobanova O.; Mejía A.; Jackson G.; Müller E. A. SAFT-γ Force Field for the Simulation of Molecular Fluids 6: Binary and Ternary Mixtures Comprising Water, Carbon Dioxide, and n-Alkanes. J. Chem. Thermodyn. 2016, 93, 320–336. 10.1016/j.jct.2015.10.011. [DOI] [Google Scholar]
- Mejía A.; Herdes C.; Müller E. A. Force Fields for Coarse-Grained Molecular Simulations from a Corresponding States Correlation. Ind. Eng. Chem. Res. 2014, 53, 4131–4141. 10.1021/ie404247e. [DOI] [Google Scholar]
- Müller E. A.; Jackson G. Force-Field Parameters from the SAFT-γ Equation of State for Use in Coarse-Grained Molecular Simulations. Annu. Rev. Chem. Biomol. Eng. 2014, 5, 405–427. 10.1146/annurev-chembioeng-061312-103314. [DOI] [PubMed] [Google Scholar]
- Míguez J. M.; Garrido J. M.; Blas F. J.; Segura H.; Mejía A.; Piñeiro M. M. Comprehensive Characterization of Interfacial Behavior for the Mixture CO 2 + H 2 O + CH 4: Comparison between Atomistic and Coarse Grained Molecular Simulation Models and Density Gradient Theory. J. Phys. Chem. C 2014, 118, 24504–24519. 10.1021/jp507107a. [DOI] [Google Scholar]
- Garrido J. M.; Algaba J.; Miguez J. M.; Mendiboure B.; Moreno-Ventas Bravo A. I.; Pineiro M. M.; Blas F. J. On Interfacial Properties of Tetrahydrofuran: Atomistic and Coarse-Grained Models from Molecular Dynamics Simulation. J. Chem. Phys. 2016, 144, 144702. 10.1063/1.4945385. [DOI] [PubMed] [Google Scholar]
- Herdes C.; Santiso E. E.; James C.; Eastoe J.; Müller E. A. Modelling the Interfacial Behaviour of Dilute Light-Switching Surfactant Solutions. J. Colloid Interface Sci. 2015, 445, 16–23. 10.1016/j.jcis.2014.12.040. [DOI] [PubMed] [Google Scholar]
- Brandrup J.; Immergut E. H.; Grulke E. A.; Abe A.; Bloch D. R.. Polymer Handbook, 4th ed.; John Wiley & Sons: 1999. [Google Scholar]
- Sabattié E.Oligomer/polymer mixtures as model adhesives: Impact of compatibility on surface segregationbehaviour. Ph.D. Thesis, Durham University, 2017. [Google Scholar]
- Nelson A. Co-Refinement of Multiple-Contrast Neutron/X-Ray Reflectivity Data Using MOTOFIT. J. Appl. Crystallogr. 2006, 39, 273–276. 10.1107/S0021889806005073. [DOI] [Google Scholar]
- O’Rourke-Muisene P. A. V.; Koberstein J. T.; Kumar S. Optimal Chain Architectures for the Molecular Design of Functional Polymer Surfaces. Macromolecules 2003, 36, 771–781. 10.1021/ma011969q. [DOI] [Google Scholar]
- Bucknall D. G.; Butler S. A.; Higgins J. S. In Scattering from Polymers; Cebe P., Hsiao B. S., Lohse D. J., Eds.; American Chemical Society: Washington, DC, 1999; Vol. 739, pp 57–73. [Google Scholar]
- James C. D.; Jeynes C.; Barradas N. P.; Clifton L.; Dalgliesh R. M.; Smith R. F.; Sankey S. W.; Hutchings L. R.; Thompson R. L. Modifying Polyester Surfaces with Incompatible Polymer Additives. React. Funct. Polym. 2015, 89, 40–48. 10.1016/j.reactfunctpolym.2015.03.002. [DOI] [Google Scholar]
- Tasche J.Theory and simulation of solubility and partitioning in polymers: Application of SAFT-γ Mie and molecular dynamics simulations. Ph.D. Thesis, Durham University, 2018. [Google Scholar]
- gSAFT Advanced Thermodynamics, 2017; https://www.psenterprise.com/products/gsaft/.
- Yi Y. X.; Zoller P. An Experimental and Theoretical Study of the PVT Equation of State of Butadiene and Isoprene Elastomers to 200°C and 200 MPa. J. Polym. Sci., Part B: Polym. Phys. 1993, 31, 779–788. 10.1002/polb.1993.090310705. [DOI] [Google Scholar]
- Zoller P.; Walsh D. J.. Standard Pressure-Volume-Temperature Data for Polymers; Technomic Pub. Co.: Lancaster, PA, 1995. [Google Scholar]
- Fandiño O.; Pensado A. S.; Lugo L.; Comuñas M. J. P.; Fernández J. Compressed Liquid Densities of Squalane and Pentaerythritol Tetra(2-Ethylhexanoate). J. Chem. Eng. Data 2005, 50, 939–946. 10.1021/je049580w. [DOI] [Google Scholar]
- Dufal S.; Lafitte T.; Galindo A.; Jackson G.; Haslam A. J. Developing intermolecular-potential models for use with the SAFT-VR M ie equation of state. AIChE J. 2015, 61, 2891–2912. 10.1002/aic.14808. [DOI] [Google Scholar]
- Müller E. A.; Mejía A. Interfacial Properties of Selected Binary Mixtures Containing N-Alkanes. Fluid Phase Equilib. 2009, 282, 68–81. 10.1016/j.fluid.2009.04.022. [DOI] [Google Scholar]
- Garrido J. M.; Mejía A.; Piñeiro M. M.; Blas F. J.; Müller E. A. Interfacial Tensions of Industrial Fluids from a Molecular-Based Square Gradient Theory. AIChE J. 2016, 62, 1781–1794. 10.1002/aic.15190. [DOI] [Google Scholar]
- Mejía A.; Cartes M.; Segura H.; Müller E. A. Use of Equations of State and Coarse Grained Simulations to Complement Experiments: Describing the Interfacial Properties of Carbon Dioxide + Decane and Carbon Dioxide + Eicosane Mixtures. J. Chem. Eng. Data 2014, 59, 2928–2941. 10.1021/je5000764. [DOI] [Google Scholar]
- Gloor G. J.; Blas F. J.; del Rió E. M.; de Miguel E.; Jackson G. A SAFT–DFT Approach for the Vapour–liquid Interface of Associating Fluids. Fluid Phase Equilib. 2002, 194–197, 521–530. 10.1016/S0378-3812(01)00774-9. [DOI] [Google Scholar]
- Llovell F.; Galindo A.; Blas F. J.; Jackson G. Classical Density Functional Theory for the Prediction of the Surface Tension and Interfacial Properties of Fluids Mixtures of Chain Molecules Based on the Statistical Associating Fluid Theory for Potentials of Variable Range. J. Chem. Phys. 2010, 133, 024704. 10.1063/1.3449143. [DOI] [PubMed] [Google Scholar]
- Hess B.; Kutzner C.; van der Spoel D.; Lindahl E. GROMACS 4: Algorithms for Highly Efficient, Load-Balanced, and Scalable Molecular Simulation. J. Chem. Theory Comput. 2008, 4, 435–447. 10.1021/ct700301q. [DOI] [PubMed] [Google Scholar]
- Pronk S.; Páll S.; Schulz R.; Larsson P.; Bjelkmar P.; Apostolov R.; Shirts M. R.; Smith J. C.; Kasson P. M.; van der Spoel D.; Hess B.; Lindahl E. GROMACS 4.5: A High-Throughput and Highly Parallel Open Source Molecular Simulation Toolkit. Bioinformatics 2013, 29, 845–854. 10.1093/bioinformatics/btt055. [DOI] [PMC free article] [PubMed] [Google Scholar]
- Degiacomi M. T.; Erastova V.; Wilson M. R. Easy Creation of Polymeric Systems for Molecular Dynamics with Assemble!. Comput. Phys. Commun. 2016, 202, 304–309. 10.1016/j.cpc.2015.12.026. [DOI] [Google Scholar]
- Humphrey W.; Dalke A.; Schulten K. VMD – Visual Molecular Dynamics. J. Mol. Graphics 1996, 14, 33–38. 10.1016/0263-7855(96)00018-5. [DOI] [PubMed] [Google Scholar]
- Stone J.An Efficient Library for Parallel Ray Tracing and Animation. M.Sc. Thesis, Computer Science Department, University of Missouri-Rolla, 1998. [Google Scholar]
- Dufal S.; Papaioannou V.; Sadeqzadeh M.; Pogiatzis T.; Chremos A.; Adjiman C. S.; Jackson G.; Galindo A. Prediction of thermodynamic properties and phase behavior of fluids and mixtures with the SAFT-γ Mie group-contribution equation of state. J. Chem. Eng. Data 2014, 59, 3272–3288. 10.1021/je500248h. [DOI] [Google Scholar]
- Tsolou G.; Mavrantzas V. G.; Theodorou D. N. Detailed atomistic molecular dynamics simulation of cis-1, 4-poly (butadiene). Macromolecules 2005, 38, 1478–1492. 10.1021/ma0491210. [DOI] [Google Scholar]
- Morgado P.; Lobanova O.; Müller E. A.; Jackson G.; Almeida M.; Filipe E. J. M. SAFT-γ Force Field for the Simulation of Molecular Fluids: 8. Hetero-Segmented Coarse-Grained Models of Perfluoroalkylalkanes Assessed with New Vapour–liquid Interfacial Tension Data. Mol. Phys. 2016, 114, 2597–2614. 10.1080/00268976.2016.1218077. [DOI] [Google Scholar]
- Walker C. C.; Genzer J.; Santiso E. E. Development of a fused-sphere SAFT-γ Mie force field for poly (vinyl alcohol) and poly (ethylene). J. Chem. Phys. 2019, 150, 034901. 10.1063/1.5078742. [DOI] [PubMed] [Google Scholar]
Associated Data
This section collects any data citations, data availability statements, or supplementary materials included in this article.


