

Abstract
Cochlear synaptopathy, the loss of synaptic connections between inner hair cells and auditory nerve fibers, has been documented in animal models of aging, noise, and ototoxic drug exposure, three common causes of acquired sensorineural hearing loss in humans. In each of these models, synaptopathy begins prior to changes in threshold sensitivity or loss of hair cells; thus, this underlying injury can be hidden behind a normal threshold audiogram. Since cochlear synaptic loss cannot be directly confirmed in living humans, non-invasive assays will be required for diagnosis. In animals with normal auditory thresholds, the amplitude of wave 1 of the auditory brainstem response (ABR) is highly correlated with synapse counts. However, synaptopathy can also co-occur with threshold elevation, complicating the use of the ABR alone as a diagnostic measure. Using an age-graded series of mice and a partial least squares regression approach to model structure-function relationships, this study shows that the combination of a small number of ABR and distortion product otoacoustic emission (DPOAE) measurements can predict synaptic ribbon counts at various cochlear frequencies to within 1–2 synapses per inner hair cell of their true value. In contrast, the model, trained using the age-graded series of mice, overpredicted synapse counts in a small sample of young noise-exposed mice, perhaps due to differences in the underlying pattern of damage between aging and noise-exposed mice. These results provide partial validation of a noninvasive approach to identify synaptic/neuronal loss in humans using ABRs and DPOAEs.
Keywords: cochlear synaptopathy, hidden hearing loss, auditory brainstem response, otoacoustic emissions, least-squares analysis, noise-induced hearing loss
1. Introduction
Animal models of age-, noise-, and ototoxic drug-related hearing loss have demonstrated that cochlear synaptopathy, the loss of synaptic connection between inner hair cells (IHCs) and their auditory nerve fiber (ANF) targets, can occur even in the absence of hair cell loss or auditory threshold changes (Kujawa & Liberman 2009; Sergeyenko et al. 2013; Ruan et al. 2014). In humans, primary loss of cochlear afferents and/or their peripheral processes has been demonstrated through post-mortem examination of temporal bones (Crowe et al. 1934; Hinojosa & Lerner 1987; Nadol 1988; Felder & Schrott-Fischer 1995; Chen et al. 2006; Viana et al. 2015; Wu et al. 2018), but non-invasive methods for estimating deafferentation in living humans have shortcomings. Predicted impacts of synaptopathy on auditory perception include tinnitus, hyperacusis, and difficulty understanding speech in background noise (Kujawa & Liberman 2015), but these remain to be verified. Non-invasive measures of synaptopathy will be necessary for determining its prevalence, causes, and perceptual consequences in humans, informing clinical diagnosis and providing assays of treatment efficacy.
The auditory brainstem response (ABR) has been employed as a non-invasive measure for diagnosing synaptopathy: In animal models with normal auditory thresholds, synaptopathy is reliably associated with a permanent reduction in the amplitude of wave 1 of the ABR in response to a suprathreshold stimulus (Kujawa & Liberman 2009; Lin et al. 2011; Sergeyenko et al. 2013), whereas neural response amplitudes recover after non-synaptopathic exposures (Fernandez et al. 2015). The potential utility of using the ABR to detect damage consistent with synaptopathy in humans has been suggested by studies showing age- and noise exposure-related reductions in ABR wave I amplitude (Konrad-Martin et al. 2012; Stamper & Johnson 2015; Bramhall et al. 2017), although other studies have not observed a relationship between recreational noise exposure and ABR wave I amplitude (Fulbright et al. 2017; Grinn et al. 2017; Prendergast et al. 2017). Use of ABR wave I amplitude as a measure of synaptopathy is complicated by the fact that this metric can be impacted not only by damage to cochlear afferents and their synapses with IHCs, but also by other sources of peripheral auditory dysfunction. In particular, synaptopathy co-occurring with outer hair cell (OHC) injury or loss and auditory threshold elevation may be common and will make reductions in ABR wave I amplitude more difficult to interpret. One approach to aid interpretation of the ABR measure is to non-invasively estimate OHC function using distortion production otoacoustic emissions (DPOAEs).
The objective of this study was to determine whether non-invasive ABR and DPOAE measurements can be used, in combination, to accurately predict synaptic ribbon counts. Measurements of ABR wave 1 amplitudes and suprathreshold DPOAE levels from an age-graded series of mice were used to develop a predictive model of synaptic ribbon numbers, which were verified histologically. A machine learning approach was used to generate a Partial Least Squares (PLS) function that informs on the relative importance of each ABR and DPOAE measure for predicting synaptic ribbon counts. The results suggest that these ABR and DPOAE measurements provide complementary information regarding underlying synaptic loss. The PLS model accurately predicted synapse counts in a series of age-graded, unexposed mice to within 1–2 synapses per inner hair cell of their true value at a variety of cochlear frequencies. This suggests that a combination of ABR and DPOAE measurements may be effective for non-invasively identifying synaptic loss in humans. To test the generalizability of this approach, the model was also used to predict synapse counts in a small sample of noise-exposed mice. The results suggest that further refinement of the model will be necessary to address differences in the pattern of synaptic loss observed in aged versus noise-exposed mice.
2. Methods
2.1. Animals
The data used in this study were taken from two series of CBA/CaJ mice assessed at ages 4–128 weeks (previously published in Sergeyenko et al. 2013; Fernandez et al. 2015) and from CBA/CaJ mice exposed to 100 dB SPL narrowband noise (8–16 kHz) for 2 hours at 16 weeks of age and assessed at 2 weeks post exposure (as described in Kujawa & Liberman 2009). Data from 67 unexposed and 9 noise-exposed mice were used. Initial studies of synaptopathy were restricted to male mice to simplify interpretation because previous work had documented sex differences in age-related threshold elevations (Guimaraes et al. 2004; Henry 2004). All procedures were approved by the Institutional Animal Care and Use Committee of the Massachusetts Eye and Ear Infirmary.
2.2. Synapse counts
As described in Sergeyenko et al. (2013), microdissected cochlear whole mounts from each mouse were immunostained with antibodies to (1) C-terminal binding protein 2 (CtBP2) to reveal pre-synaptic ribbons, (2) N/K-ATPase to identify afferent terminals or (3) GluA2 to identify glutamate receptor patches, and (4) myosin-VIIa to aid in hair cell identification. A mouse cochlear map (Muller et al. 2005) was used to localize cochlear tissues to precisely stereotyped frequency locations from base to apex using Amira software, aided by custom software that computed and displayed synaptic ribbons with or without juxtaposed glutamate receptor patches/terminals (described in Liberman et al. 2011). Only pairs of synaptic ribbons and glutamate receptors/afferent terminals were used as inputs to the model; in these series, “orphan” ribbons were rare. Counts from locations corresponding to frequencies of 5.6, 11.3, and 32 kHz, available from both samples of mice, were used to generate the PLS model.
2.3. Physiological tests
ABR and DPOAE measurements were obtained from all animals as described in Sergeyenko et al. (2013). ABR data for stimulus frequencies of 5.6, 10.1, 12.14, 17.54, and 30.49 kHz and stimulus levels ranging from 30 to 90 dB SPL were used. The amplitude of wave 1 of the ABR was measured from the peak of wave 1 to the following trough. The reported DPOAE level was that of the cubic distortion product (2f1-f2) recorded in response to primary tones f1 and f2, where f2/f1 = 1.2. DPOAE f2 primary frequencies were identical to the ABR stimulus frequencies, with the f2 level (L2) ranging from 30 to 80 dB SPL and the f1 level (L1) set to 10 dB above L2. ABR and DPOAE stimulus levels in increments of 10 dB were used to generate the PLS model.
2.4. Statistical Approach
PLS regression was used to predict synapse counts per inner hair cell (S/IHC). This approach defines coefficients for a weighted sum of ABR amplitudes and DPOAE levels across stimulus levels and frequencies that best predict S/IHC. Let denote the predicted S/IHC for the ith mouse at the tth cochlear frequency (t=5.6, 11.3, or 32 kHz) from ABR amplitude AL,F and DPOAE level DL,F elicited at stimulus level L and frequency F. PLS regression defines ABR coefficients αL,F and DPOAE coefficients δL,F such that
best predicts the observed S/IHC. The PLS algorithm is particularly suited to this dataset because there are multiple synapse count frequencies and the ABR and DPOAE measurements at various stimulus frequencies and levels are highly correlated with each other. Split-sample cross-validation was used to identify the smallest number of PLS factors that adequately predicted the data and to generate nearly unbiased estimates of the model prediction error. Split sample cross-validation is a widely used method in machine learning to reduce bias in the estimated prediction errors when training a model on the same data set that is used to test the model. Specifically, the data are randomly partitioned into blocks and the model is trained on all but one block. The trained model is then used to predict the output variable (i.e. synapse counts) in the held-out block, from which prediction errors are estimated. This process is repeated for each of the remaining blocks. Subsequent estimates of prediction error were based on five-fold (i.e. the data set was split into five blocks) cross-validation. Cross-validation groups were constructed to ensure age balance within each hold-out group. The model was trained and validated on the age-graded unexposed mice, and tested independently on the noise-exposed mice.
3. Results
3.1. Characteristics of raw S/IHC data
Plots of the raw S/IHC data (thin lines, one per mouse) and sample means (thick lines), by age and noise exposure, are shown in Figure 1. Synapse counts decline progressively with age at all frequencies. However, two weeks after exposure, young noise-exposed mice have fewer S/IHC at 32 kHz than unexposed mice of any age.
Figure 1. Observed synapse counts per inner hair cell (S/IHC) across age.
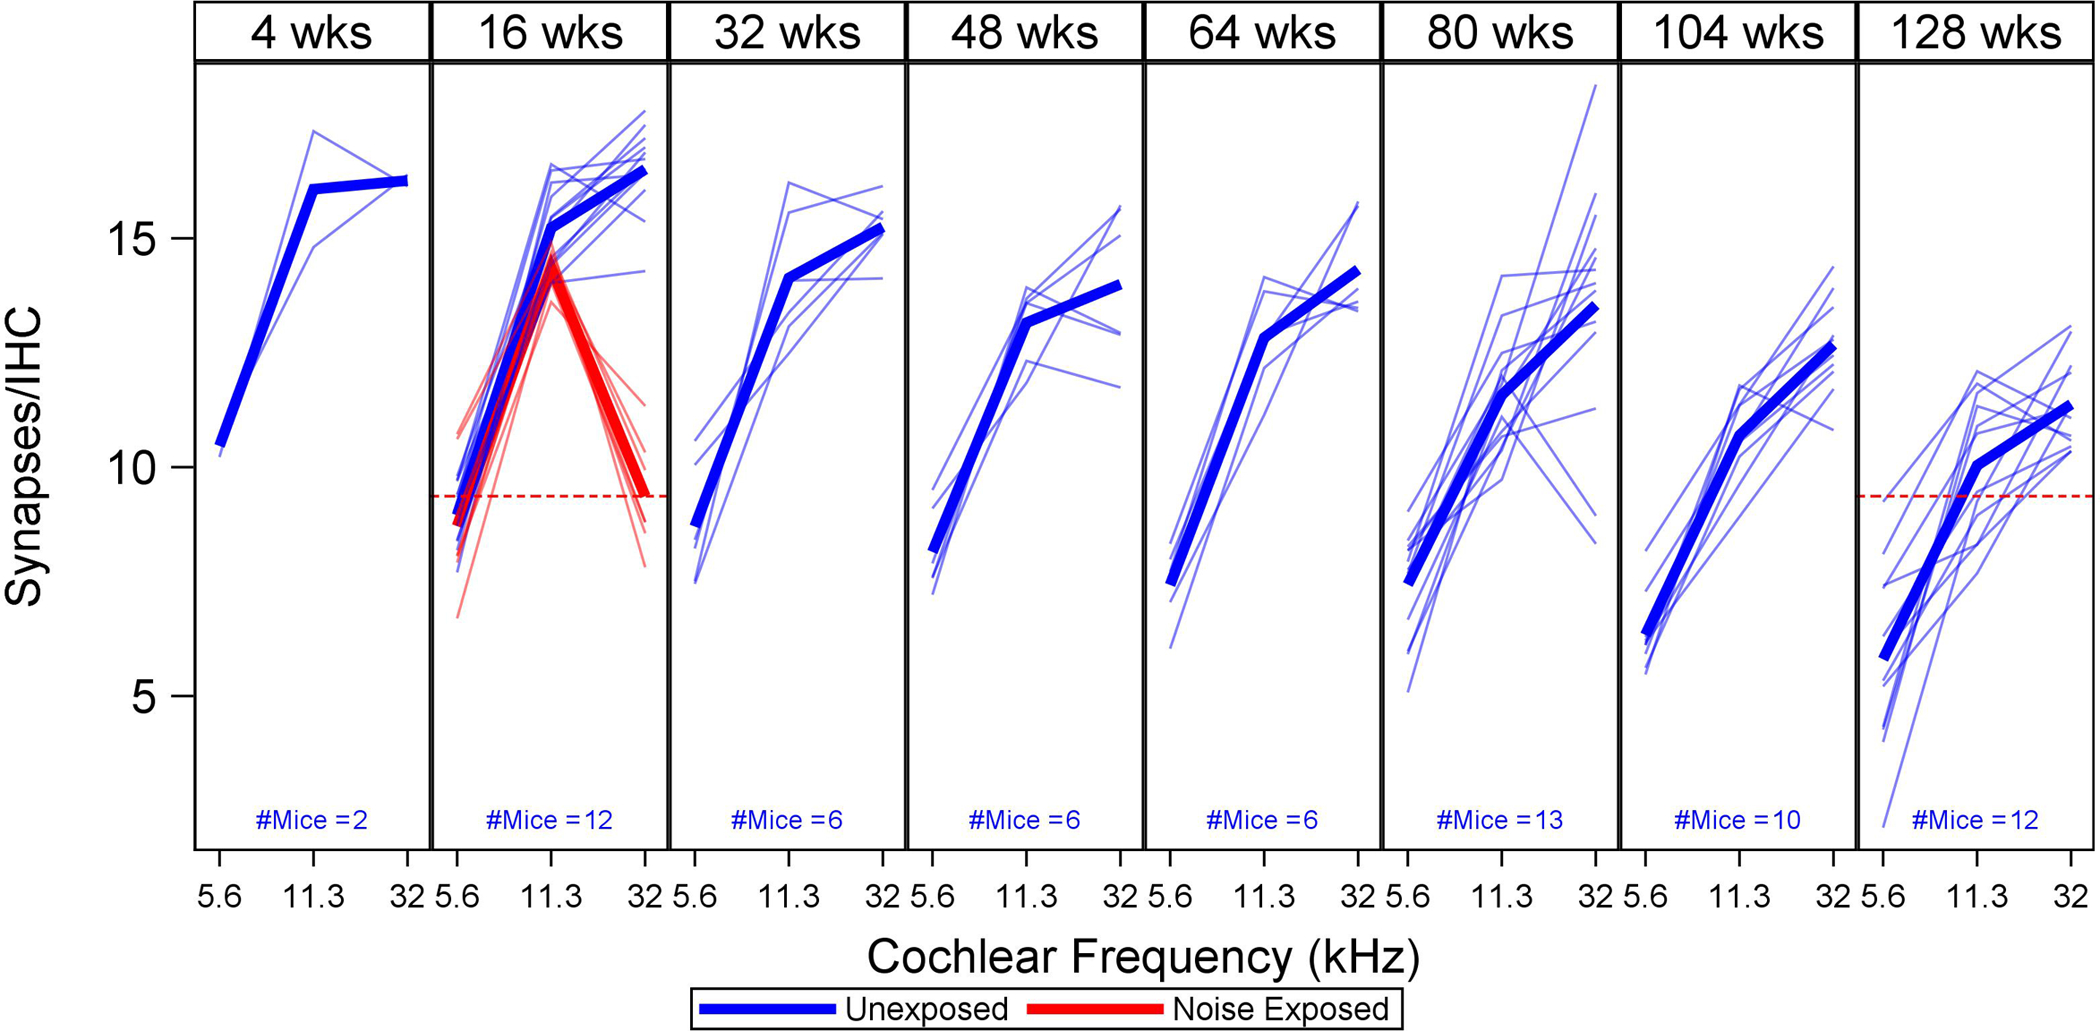
For each age group (expressed in weeks), thin lines show S/IHC for three cochlear frequencies (5.6, 11.3, and 32 kHz) in individual mice, with mean values indicated by thick lines. Unexposed mice are shown in blue, noise-exposed mice in red. A red dotted line shows how S/IHC at 32 kHz in 16-week-old noise-exposed mice compares to 128-week-old unexposed mice. S/IHC decrease across cochlear frequency with age and are reduced at 32 kHz in the noise-exposed mice. (For all figures, please see the online version of this article for interpretation of references to color.)
3.2. Characteristics of raw ABR and DPOAE data
The raw ABR wave 1 amplitude and DPOAE level data for 16-week-old unexposed and noise-exposed mice are compared in Figure 2. Data for unexposed 128-week-old mice are also plotted for comparison. The ABR data were plotted at a high intensity level (90 dB SPL) to maximize sensitivity to synapse loss and the DPOAE data were plotted at a low intensity level (30 dB SPL) to maximize sensitivity to OHC loss. Compared to unexposed age-matched controls, noise-exposed mice show slightly higher ABR wave 1 amplitudes from 5.6–12.4 kHz, and considerably lower ABR wave 1 amplitudes at 30.49 kHz. The 128-week-old mice have very low ABR wave 1 amplitudes across frequency, lower than any of the 16-week-old mice, even at 30.49 kHz. Of note, the young noise-exposed mice have fewer synapses at 32 kHz than the older unexposed mice (Figure 1). DPOAE levels are slightly reduced for the noise-exposed mice at 30.49 kHz compared to the age-matched controls and are reduced across frequency for the 128-week-old mice compared to the younger mice.
Figure 2. ABR wave 1 amplitudes and DPOAE levels across frequency for noise-exposed versus unexposed mice.
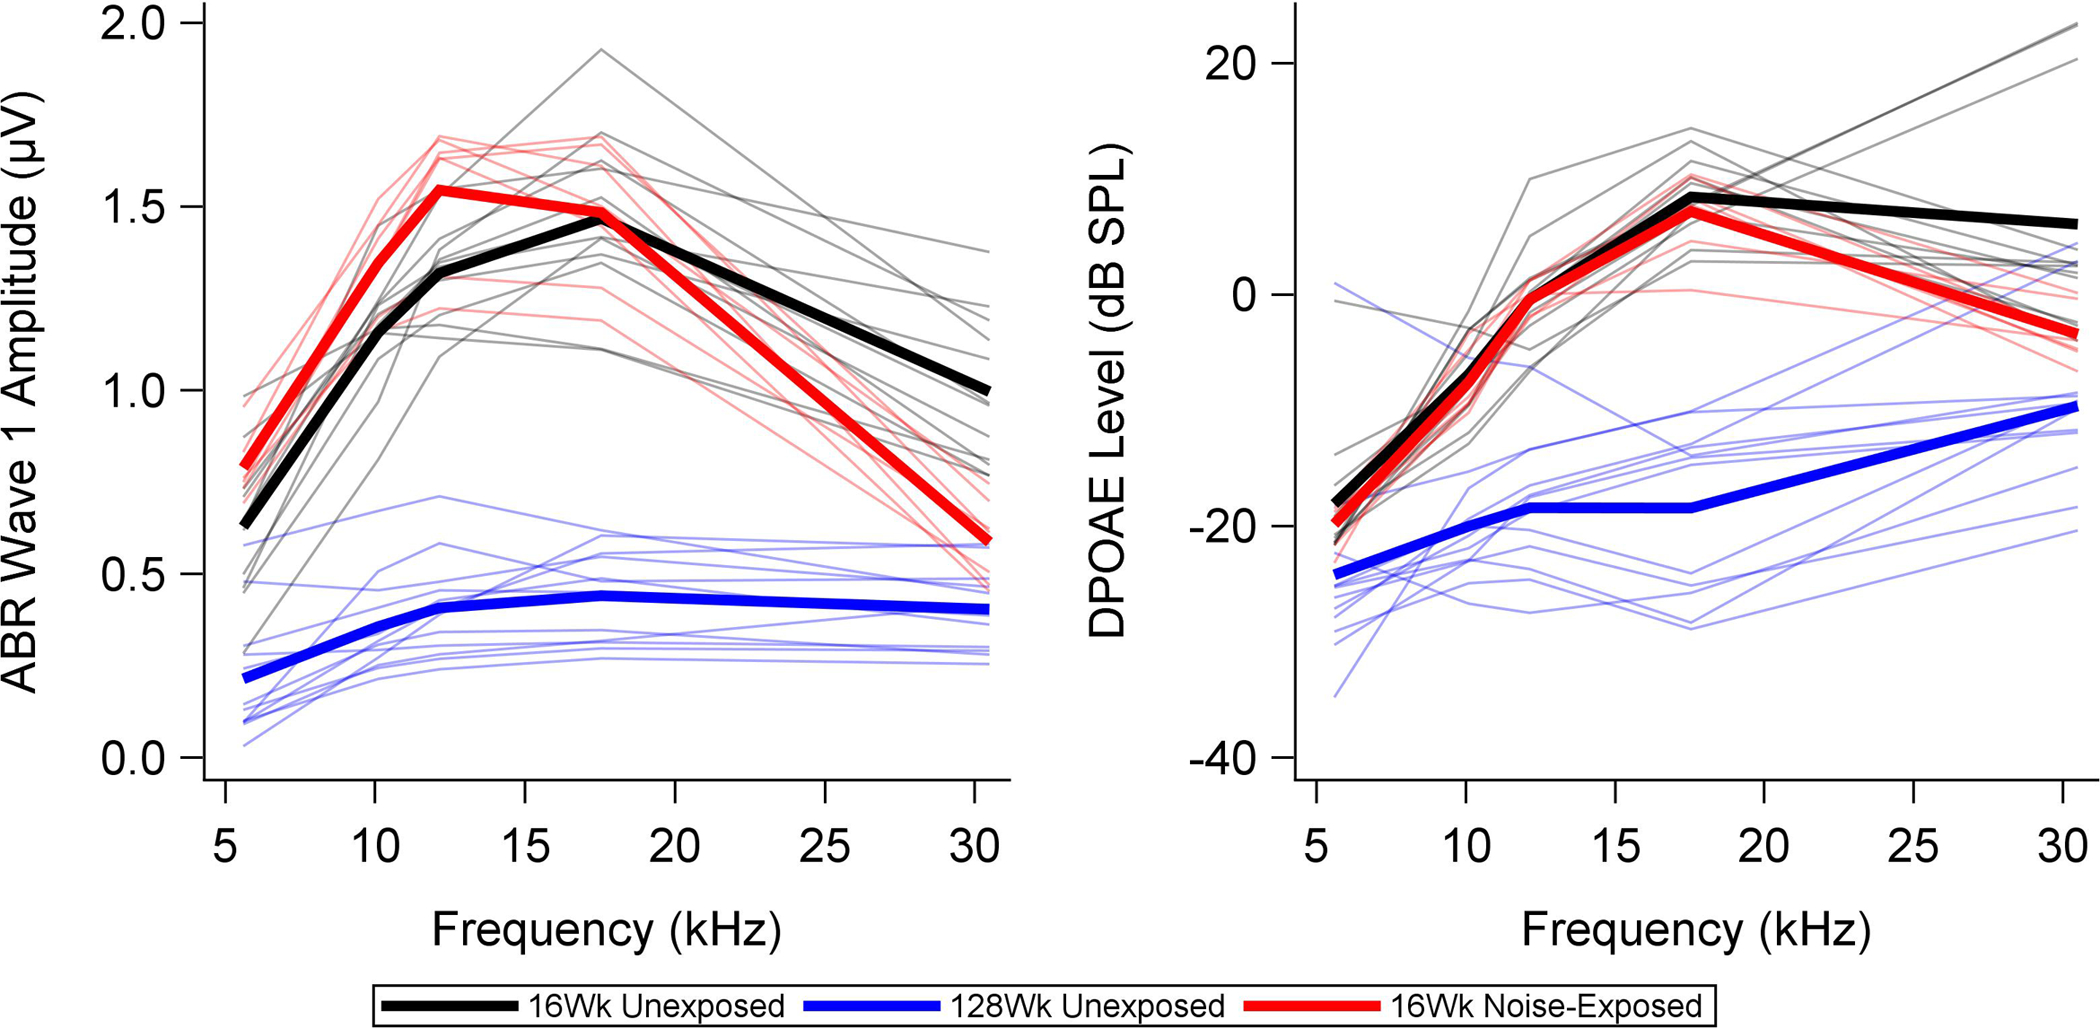
Thin lines show ABR and DPOAE measurements for individual 16-week-old unexposed (black) and noise-exposed mice (red). Group means are indicated with thick lines. Data from 128-week-old unexposed mice (blue) are plotted for comparison. Stimulus levels are 90 dB SPL for the ABR (selected to be sensitive to synaptopathy) and 30 dB SPL for the DPOAEs (selected to be sensitive to OHC loss). The young noise-exposed mice show slightly higher ABR wave 1 amplitudes in the lower frequencies and lower ABR wave 1 amplitudes at 30.49 kHz than the young unexposed mice. DPOAE levels are lower for the noise-exposed mice than the unexposed mice at 30.49 kHz, but are otherwise similar. Old unexposed mice show lower ABR wave 1 amplitudes and DPOAE levels than the younger mice across frequency.
3.3. PLS model coefficients
Centered and scaled ABR and DPOAE coefficients from the PLS model developed on data from unexposed age-graded mice are shown in Figure 3. The PLS coefficients (or weights) indicate the relative weighting of each individual ABR or DPOAE measurement that best predicts synapse counts. Each panel in this plot corresponds to the ABR amplitude (top row) coefficients αL,F and DPOAE level (bottom row) coefficients δL,F identified by the PLS model for cochlear frequencies of 5.6 kHz (left column), 11.3 kHz (middle column), and 32 kHz (right column). Colored squares within each subplot display the magnitude of the PLS coefficient associated with the stimulus frequency F (rows) and level L (columns) of the ABR or DPOAE. The magnitude of the coefficient, given the other predictors in the model, is indicated by the red color intensity in each square. Empty squares denote predictors with Variable Importance for Projection (VIP) less than 0.8. It is apparent from this plot that the most important predictors of S/IHC at each cochlear frequency are ABR wave 1 amplitudes generated in response to stimuli with frequencies of 10.1–17.54 kHz and levels of 40–80 dB SPL. The largest DPOAE coefficients are at f2 = 17.54 kHz across stimulus levels. Interestingly, this plot gives no strong indication that the best prediction of S/IHC at any particular cochlear frequency is given by ABR or DPOAE amplitudes at the corresponding frequency.
Figure 3. ABR and DPOAE coefficients from the PLS model developed on data from unexposed mice.
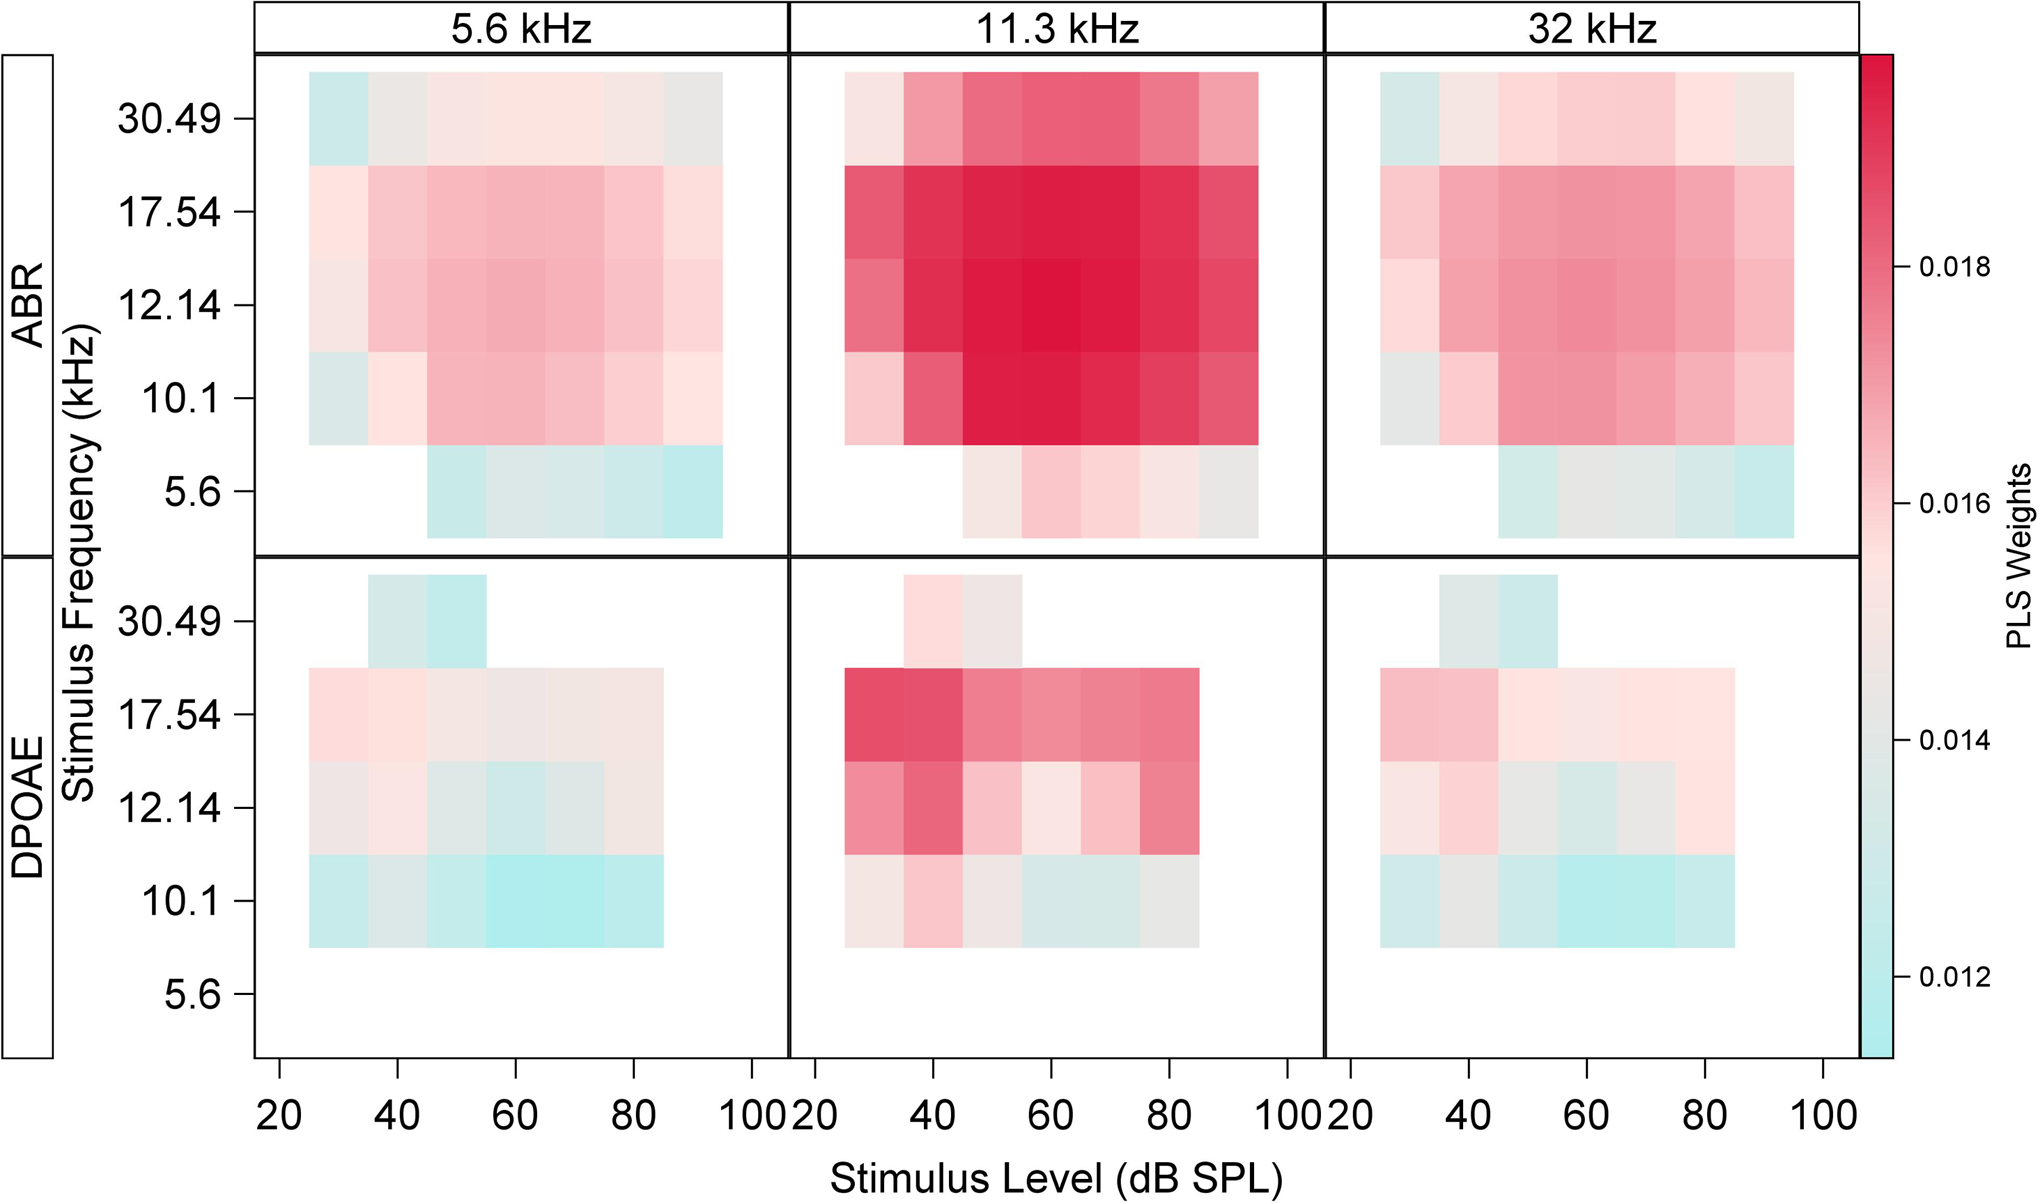
The PLS coefficients (or weights) indicate the relative weighting of each individual ABR or DPOAE measurement that best predict synapse counts. This plot shows ABR wave 1 amplitude (top row) and DPOAE level (bottom row) weights αL,F and δL,F, respectively, identified by the PLS model for cochlear frequencies of 5.6 kHz (left column), 11.3 kHz (middle column), and 32 kHz (right column). Colored squares within each subplot display the magnitude of the PLS coefficient associated with each ABR or DPOAE stimulus frequency (rows) and level (columns) of the ABR or DPOAE. Empty squares denote predictors with Variable Importance for Projection (VIP) less than 0.8. The highest coefficients for ABR wave 1 amplitude are associated with 10.1–17.54 kHz stimuli at levels of 40–80 dB SPL. The largest DPOAE coefficients are at f2 = 17.54 kHz across stimulus levels.
3.4. Accuracy of the PLS model
Figure 4 shows the predicted (x-axis) versus observed (y-axis) S/IHC for each mouse in the sample based on the PLS model. Predictions are based on five-fold cross-validation in the age-graded series of unexposed mice. The diagonal line denotes perfect correspondence between the observed and predicted S/IHC. The accuracy of the model in predicting S/IHC is readily apparent for the unexposed mice at all frequencies. The root mean squared prediction error (RMSPE) is 1.2 S/IHC at 5.6 kHz, 1.33 S/IHC at 11.3 kHz, and 1.62 S/IHC at 32 kHz. Prediction error in the young noise-exposed mice at 5.6 and 11.3 kHz is comparable, with RMSPE of 1.33 S/IHC at 5.6 kHz and 0.78 S/IHC at 11.3 kHz. However, the model overpredicts S/IHC in the noise-exposed mice at 32 kHz, with a RMSPE of 6.85 S/IHC.
Figure 4. PLS model predicted S/IHC versus observed S/IHC.
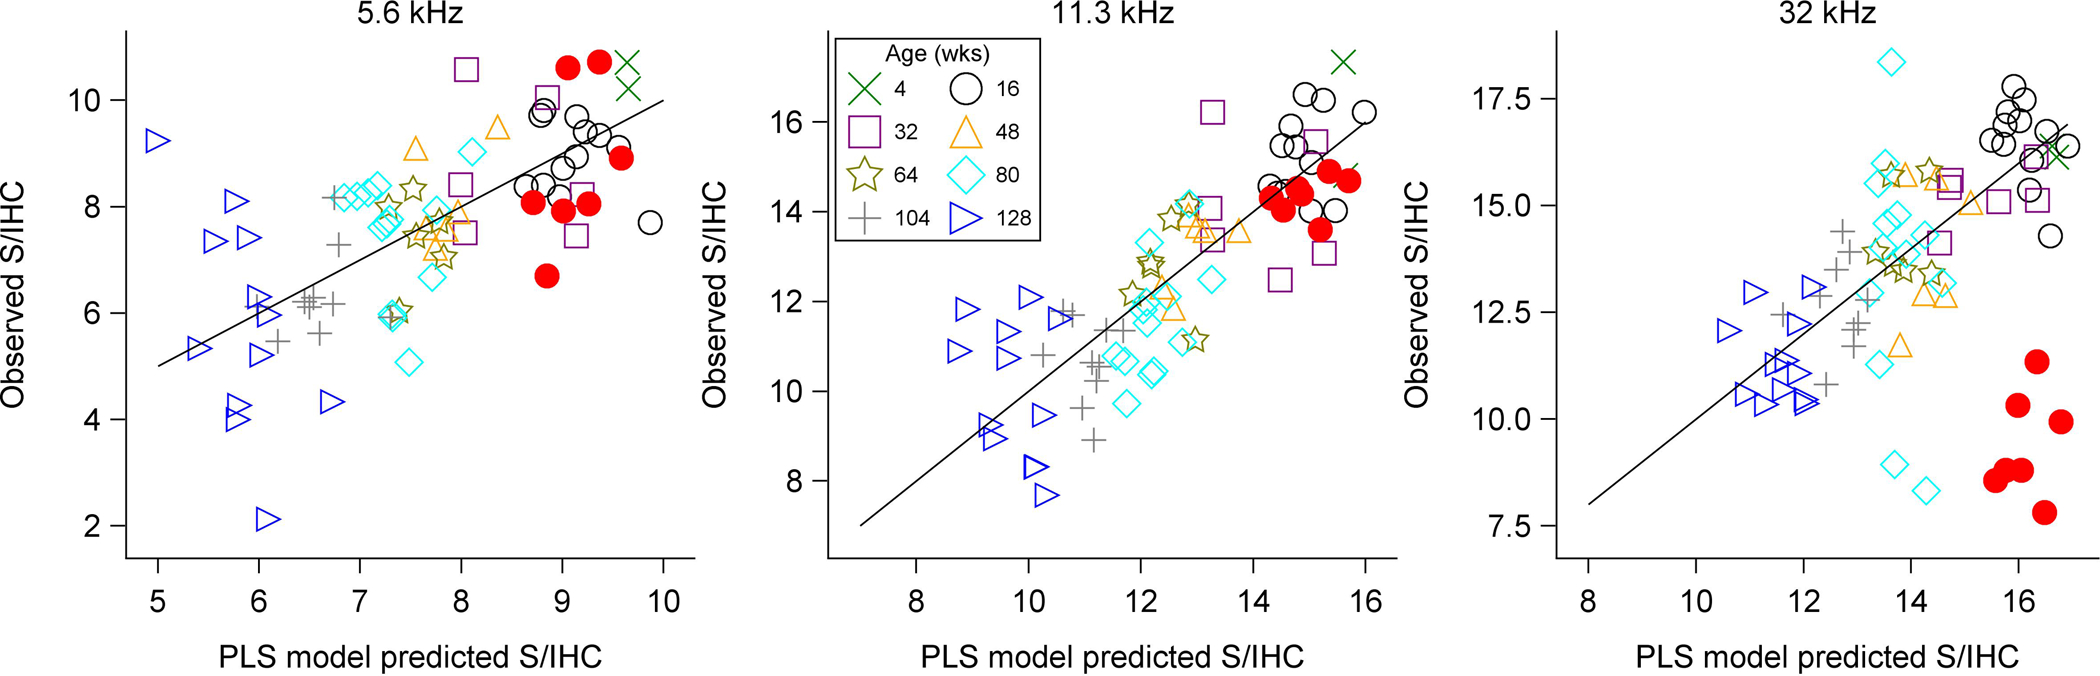
Cross-validated predicted vs. observed S/IHC are plotted for individual mice at each of the three modeled cochlear frequencies. Perfect correspondence between predicted and observed values is indicated by the diagonal line. The age group of each mouse is indicated by color and symbol. Filled circles indicate noise-exposed mice and open symbols indicate unexposed animals. This plot illustrates the high level of accuracy associated with the PLS model in unexposed mice. However, the model overestimates S/IHC in the noise-exposed mice at 32 kHz.
4. Discussion
The overall objective of this study was to determine whether it is possible to use ABR and DPOAE measurements to predict cochlear synapse counts. Machine learning was used to develop a PLS model to test the relative importance of a variety of ABR and DPOAE measurements for predicting synapse counts across cochlear frequency in an age-graded series of mice. The long-term goal is to identify non-invasive measures of cochlear and neural function that go beyond the audiogram and allow for characterization of synaptopathy in humans with or without OHC involvement. DPOAE and ABR measurements provide complementary information regarding cochlear and neural function, thereby enhancing our ability to non-invasively predict synapse counts.
4.1. PLS model accurately predicts S/IHC across age in unexposed, aging mice
The results of this study indicate that a combination of ABR and DPOAE measurements can be used to accurately predict synapse counts at frequencies corresponding to various cochlear locations to within 1–2 S/IHC of their true value. These results provide partial validation of a noninvasive approach to identify synaptic/neuronal loss in humans using both ABR and DPOAE measurements.
4.2. PLS model overpredicts S/IHC in regions of damage in young noise-exposed mice
Although the PLS model predicted synapse counts in the age-graded series of mice with a high degree of accuracy, certain characteristics of age-related deterioration of the auditory system may have contributed to the success of this model. Across frequency, OHCs, cochlear synapses, and spiral ganglion cell numbers decreased with age in these mice (Sergeyenko et al. 2013). The correlation between age and these different elements of the auditory system may have enhanced the success of the PLS model in estimating synaptopathy related to aging. Accordingly, the model was validated in a second dataset consisting of nine young noise-exposed mice. At cochlear frequencies where synapse counts were not impacted by noise exposure, the PLS model predictions corresponded well with observed S/IHC. However, at 32 kHz, the model overpredicted S/IHC by an average of nearly 7 S/IHC.
The comparison of ABR measurements in young (unexposed and noise-exposed) and old (unexposed) mice (Figure 2) shows that ABR wave 1 amplitudes at 30.49 kHz are smaller for old mice than for young noise-exposed mice even though the noise-exposed mice have fewer S/IHC at that frequency (Figure 1). This discrepancy may reflect differences in the sensitivity of the ABR to focal versus widespread cochlear lesions. Toneburst ABR, particularly at suprathreshold stimulus levels, is generated not only by auditory nerve activity at the cochlear frequency of the stimulus, but also by neighboring cochlear regions through the spread of excitation (Folsom 1984; Ruggero 1992). If synaptic numbers are reduced within a relatively narrow region of the cochlea, the ABR is likely to overestimate neuronal function due to the activation of neighboring regions with less damage. In contrast, if synaptic loss is relatively uniform across the cochlea, the ABR will be a more accurate indicator of auditory nerve activity. Therefore, differences in the pattern of synaptic loss for the aged versus the noise-exposed mice, rather than etiology, may explain why ABR wave 1 amplitudes for the noise-exposed mice at 30.49 kHz are higher than one would expect given their synapse counts at 32 kHz. This discrepancy would likely cause the PLS model to overpredict synapse counts in the noise-exposed mice at 32 kHz.
This explanation is supported by better model predictions at 32 kHz for a group of mice exposed to a lower-frequency noise band (4–8 kHz, 112 dB SPL, 6 hour exposure) that produced a less focal pattern of synaptic loss. Shown in Figure 5a, synaptic survival after the lower-frequency noise exposure lacked the sharp decrease at 32 kHz that was observed in the mice exposed to an 8–16 kHz noise band. Predicted versus observed synapse counts at 32 kHz (Figure 5b) show that the PLS model predicts synapse counts in these mice with relative accuracy. This suggests that overprediction of synapse numbers for the mice exposed to the 8–16 kHz noise band is related to the focal nature of the synaptic damage in these mice.
Figure 5. Synaptic survival and model predictions for a less focal noise-induced synaptic loss.
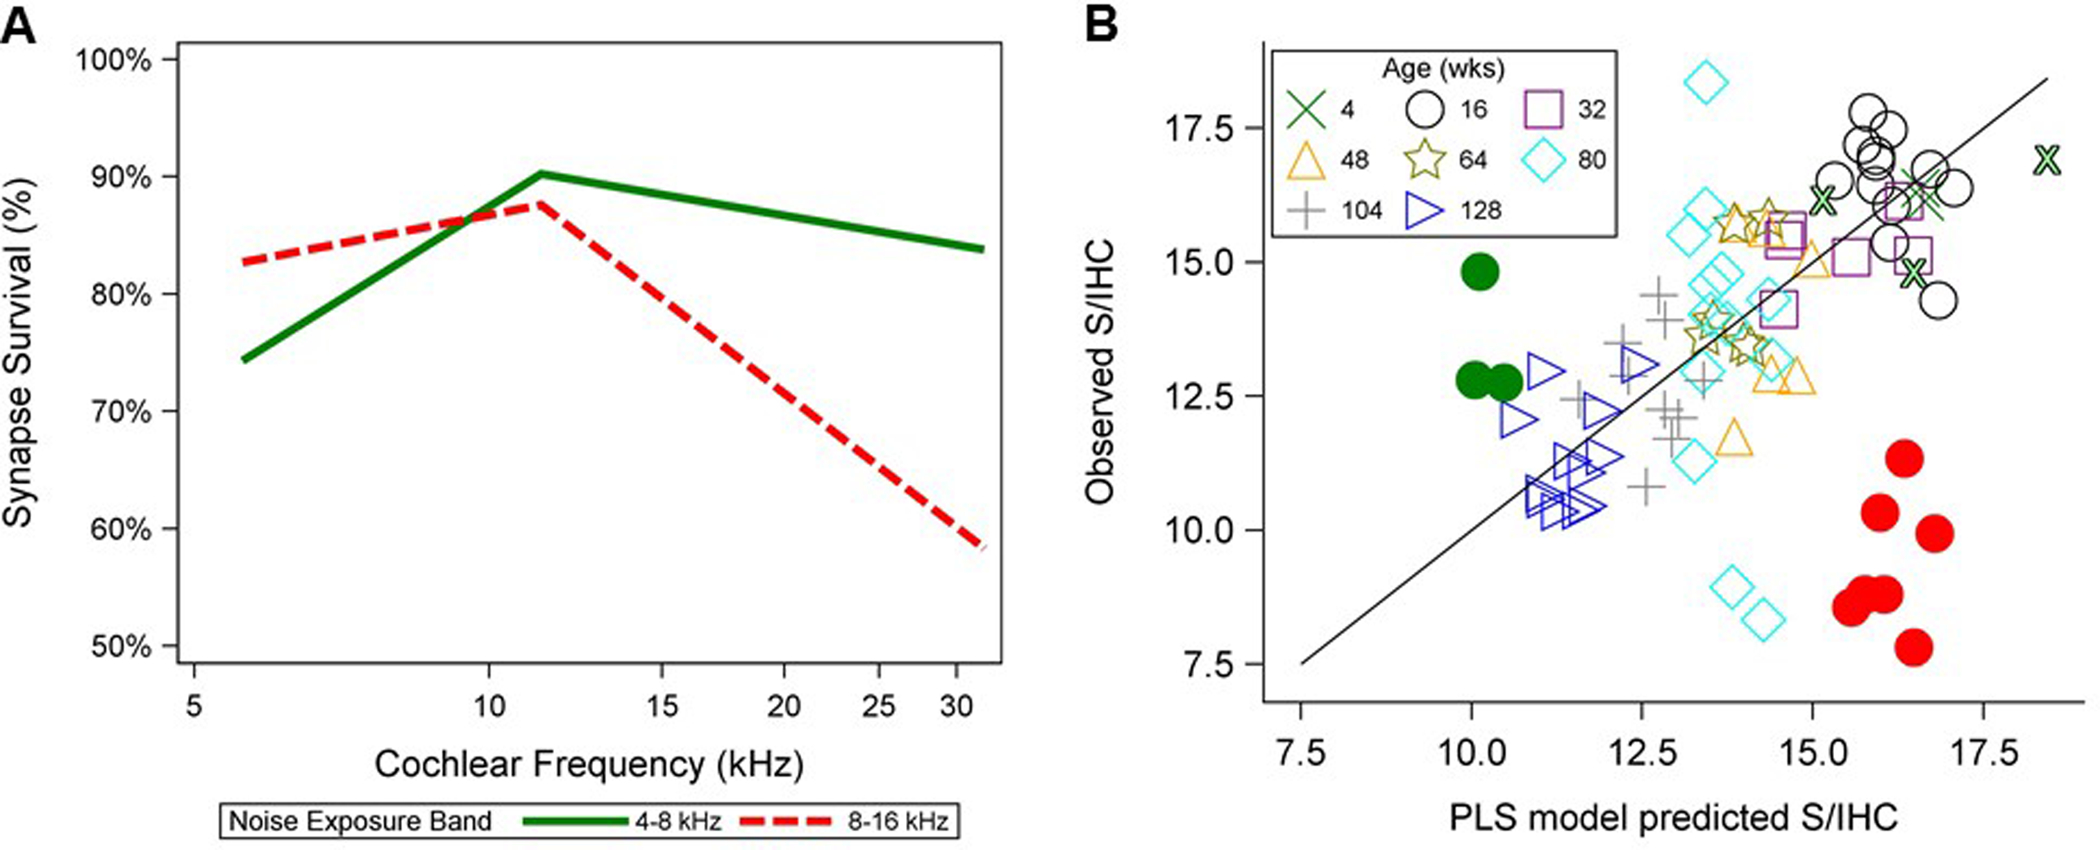
(A) Mean synaptic survival (expressed as a percent and referenced to mean counts for five 4-week-old unexposed mice) is plotted for three 4-week-old mice exposed to a 4–8 kHz band of noise delivered at 112 dB SPL for 6 hours and for nine 16-week-old mice exposed to an 8–16 kHz noise band at 100 dB SPL for 2 hours. Synapse counts were assessed at two weeks post-exposure. The mice exposed to a 4–8 kHz noise band (green line) show a widespread pattern of mild synaptic loss, while the mice with 8–16 kHz exposure (red dashed line) display severe focal loss at 32 kHz. (B) Predicted vs. observed S/IHC, now including three 4–8 kHz-exposed mice (filled green circles) and three additional 4-week-old unexposed mice (outlined green Xs), are plotted for individual mice at 32 kHz as described in Figure 4. The model accurately predicts synapse counts in the mice exposed to a 4–8 kHz exposure band, but overpredicts synapse numbers in the mice exposed from 8–16 kHz.
Other potential differences between the aging and the noise-exposed mice can also be considered. Since ABR wave 1 amplitude is more sensitive to loss of high spontaneous rate (SR) fibers than loss of low-SR fibers (Bourien et al. 2014), an etiology-related difference (aging versus noise exposure) in the SR distribution of the remaining fibers could contribute to the observed differences. However, a comparison of auditory nerve fiber discharge rates from noise-exposed guinea pigs (Furman et al. 2013) and aged gerbils (Schmiedt et al. 1996) reveals a similar proportion of low- versus high-SR fibers in both cases (Bharadwaj et al. 2015). Alternatively, age-related changes in endocochlear potential (EP) or increased likelihood of conductive pathology in older mice could lead to reductions in both DPOAE and ABR responses in older mice compared to younger mice that are unrelated to synapse counts. Although mice with obvious or suspected middle ear pathology were not analyzed (see Rosowski et al. 2003 for assessment details) and previous analysis of the unexposed mouse data showed that it was not necessary to invoke processes beyond OHC loss to account for the observed threshold changes in aging mice (Sergeyenko et al. 2013), additional contributors to the age-related response declines cannot be ruled out.
An ideal model would accurately predict S/IHC in both noise-exposed and unexposed mice across the lifespan. The model presented here performs well in unexposed mice and in undamaged or minimally damaged cochlear regions of exposed mice. This suggests that the combination of DPOAE and ABR measurements can be used to predict synapse counts. However, the current PLS model was trained exclusively on mice with widespread synaptic loss, which may have resulted in its overprediction of synapse counts in mice with severe, focal synaptopathy. The relative accuracy of the model predictions for an additional sample of noise-exposed mice with a more widespread, though less severe, pattern of synaptic loss supports this view. The next iteration of the model can be improved by training the model on a combination of mice with widespread and focal synaptic loss. It may also be necessary to use more frequency-specific ABR measurements, for instance by adding notched noise to the toneburst stimulus. These changes should allow the model to predict synapse counts regardless of the underlying etiology.
Further validation will be necessary to determine the generalizability of a refined version of the PLS model to other etiologies of sensory and/or synaptic loss, and across various mouse strains and species, with and without noise exposure. This will help verify how well a combination of OHC loss and synaptic/neuronal loss is handled by the model. Direct translation of the PLS model to humans will require estimates of mean synapse/terminal counts across cochlear locations and age and establishing how these synapse counts relate to ABR wave I amplitudes and DPOAE levels.
Acknowledgements
The research described here was supported by the Department of Defense (W81XWH-15-1-01-3 to SGK with DK-M as NCRAR site PI) and the Department of Veterans Affairs, Veterans Health Administration, Rehabilitation Research and Development Service - Award #C2104-W (to NFB) and #C9230-C (to NCRAR). The opinions and assertions presented are private views of the authors and are not to be construed as official or as necessarily reflecting the views of the VA or the Department of Defense.
Footnotes
Declarations of interest
None.
References
- Bharadwaj HM, Masud S, Mehraei G, et al. (2015). Individual differences reveal correlates of hidden hearing deficits. J Neurosci, 35, 2161–2172. [DOI] [PMC free article] [PubMed] [Google Scholar]
- Bourien J, Tang Y, Batrel C, et al. (2014). Contribution of auditory nerve fibers to compound action potential of the auditory nerve. J Neurophysiol, 112, 1025–1039. [DOI] [PubMed] [Google Scholar]
- Bramhall NF, Konrad-Martin D, McMillan GP, et al. (2017). Auditory Brainstem Response Altered in Humans With Noise Exposure Despite Normal Outer Hair Cell Function. Ear Hear, 38, e1–e12. [DOI] [PMC free article] [PubMed] [Google Scholar]
- Chen MA, Webster P, Yang E, et al. (2006). Presbycusic neuritic degeneration within the osseous spiral lamina. Otology & Neurotology, 27, 316–322. [DOI] [PubMed] [Google Scholar]
- Crowe SJ, Guild SR, Polvogt LM (1934). Observations on the pathology of high-tone deafness. The Journal of Nervous and Mental Disease, 80, 480. [Google Scholar]
- Felder E, Schrott-Fischer A (1995). Quantitative evaluation of myelinated nerve fibres and hair cells in cochleae of humans with age-related high-tone hearing loss. Hear Res, 91, 19–32. [DOI] [PubMed] [Google Scholar]
- Fernandez KA, Jeffers PW, Lall K, et al. (2015). Aging after noise exposure: acceleration of cochlear synaptopathy in “recovered” ears. J Neurosci, 35, 7509–7520. [DOI] [PMC free article] [PubMed] [Google Scholar]
- Folsom RC (1984). Frequency specificity of human auditory brainstem responses as revealed by pure-tone masking profiles. J Acoust Soc Am, 75, 919–924. [DOI] [PubMed] [Google Scholar]
- Fulbright ANC, Le Prell CG, Griffiths SK, et al. (2017). Effects of Recreational Noise on Threshold and Suprathreshold Measures of Auditory Function. Semin Hear, 38, 298–318. [DOI] [PMC free article] [PubMed] [Google Scholar]
- Furman AC, Kujawa SG, Liberman MC (2013). Noise-induced cochlear neuropathy is selective for fibers with low spontaneous rates. J Neurophysiol, 110, 577–586. [DOI] [PMC free article] [PubMed] [Google Scholar]
- Grinn SK, Wiseman KB, Baker JA, et al. (2017). Hidden Hearing Loss? No Effect of Common Recreational Noise Exposure on Cochlear Nerve Response Amplitude in Humans. Frontiers in neuroscience, 11, 465. [DOI] [PMC free article] [PubMed] [Google Scholar]
- Guimaraes P, Zhu X, Cannon T, et al. (2004). Sex differences in distortion product otoacoustic emissions as a function of age in CBA mice. Hearing research, 192, 83–89. [DOI] [PubMed] [Google Scholar]
- Henry KR (2004). Males lose hearing earlier in mouse models of late-onset age-related hearing loss; females lose hearing earlier in mouse models of early-onset hearing loss. Hearing research, 190, 141–148. [DOI] [PubMed] [Google Scholar]
- Hinojosa R, Lerner SA (1987). Cochlear neural degeneration without hair cell loss in two patients with aminoglycoside ototoxicity. Journal of Infectious Diseases, 156, 449–455. [DOI] [PubMed] [Google Scholar]
- Konrad-Martin D, Dille MF, McMillan G, et al. (2012). Age-related changes in the auditory brainstem response. J Am Acad Audiol, 23, 18–35; quiz 74–15. [DOI] [PMC free article] [PubMed] [Google Scholar]
- Kujawa SG, Liberman MC (2009). Adding insult to injury: cochlear nerve degeneration after “temporary” noise-induced hearing loss. J Neurosci, 29, 14077–14085. [DOI] [PMC free article] [PubMed] [Google Scholar]
- Kujawa SG, Liberman MC (2015). Synaptopathy in the noise-exposed and aging cochlea: Primary neural degeneration in acquired sensorineural hearing loss. Hear Res, 330, 191–199. [DOI] [PMC free article] [PubMed] [Google Scholar]
- Liberman LD, Wang H, Liberman MC (2011). Opposing gradients of ribbon size and AMPA receptor expression underlie sensitivity differences among cochlear-nerve/hair-cell synapses. J Neurosci, 31, 801–808. [DOI] [PMC free article] [PubMed] [Google Scholar]
- Lin HW, Furman AC, Kujawa SG, et al. (2011). Primary neural degeneration in the Guinea pig cochlea after reversible noise-induced threshold shift. J Assoc Res Otolaryngol, 12, 605–616. [DOI] [PMC free article] [PubMed] [Google Scholar]
- Muller M, von Hunerbein K, Hoidis S, et al. (2005). A physiological place-frequency map of the cochlea in the CBA/J mouse. Hear Res, 202, 63–73. [DOI] [PubMed] [Google Scholar]
- Nadol JB (1988). Application of electron microscopy to human otopathology: ultrastructural findings in neural presbycusis, Meniere’s disease and Usher’s syndrome. Acta oto-laryngologica, 105, 411–419. [DOI] [PubMed] [Google Scholar]
- Prendergast G, Guest H, Munro KJ, et al. (2017). Effects of noise exposure on young adults with normal audiograms I: Electrophysiology. Hear Res, 344, 68–81. [DOI] [PMC free article] [PubMed] [Google Scholar]
- Rosowski JJ, Brinsko KM, Tempel BI, et al. (2003). The aging of the middle ear in 129S6/SvEvTac and CBA/CaJ mice: measurements of umbo velocity, hearing function, and the incidence of pathology. Journal of the Association for Research in Otolaryngology, 4, 371–383. [DOI] [PMC free article] [PubMed] [Google Scholar]
- Ruan Q, Ao H, He J, et al. (2014). Topographic and quantitative evaluation of gentamicin-induced damage to peripheral innervation of mouse cochleae. Neurotoxicology, 40, 86–96. [DOI] [PubMed] [Google Scholar]
- Ruggero MA (1992). Responses to sound of the basilar membrane of the mammalian cochlea. Curr Opin Neurobiol, 2, 449–456. [DOI] [PMC free article] [PubMed] [Google Scholar]
- Schmiedt RA, Mills JH, Boettcher FA (1996). Age-related loss of activity of auditory-nerve fibers. J Neurophysiol, 76, 2799–2803. [DOI] [PubMed] [Google Scholar]
- Sergeyenko Y, Lall K, Liberman MC, et al. (2013). Age-related cochlear synaptopathy: an early-onset contributor to auditory functional decline. J Neurosci, 33, 13686–13694. [DOI] [PMC free article] [PubMed] [Google Scholar]
- Stamper GC, Johnson TA (2015). Auditory function in normal-hearing, noise-exposed human ears. Ear Hear, 36, 172–184. [DOI] [PMC free article] [PubMed] [Google Scholar]
- Viana LM, O’Malley JT, Burgess BJ, et al. (2015). Cochlear neuropathy in human presbycusis: Confocal analysis of hidden hearing loss in post-mortem tissue. Hear Res, 327, 78–88. [DOI] [PMC free article] [PubMed] [Google Scholar]
- Wu PZ, Liberman LD, Bennett K, et al. (2018). Primary Neural Degeneration in the Human Cochlea: Evidence for Hidden Hearing Loss in the Aging Ear. Neuroscience. [DOI] [PMC free article] [PubMed] [Google Scholar]