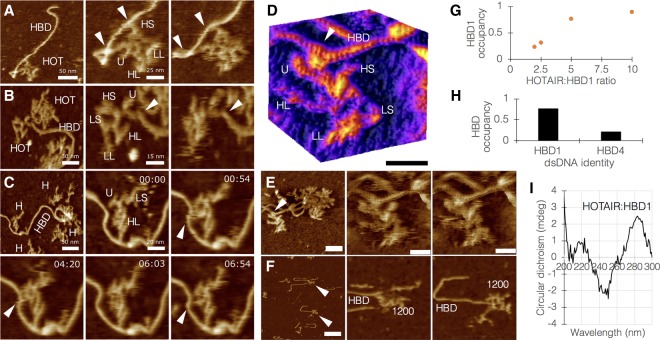
FIGURE 2.
Characterization of the physical interaction between HOTAIR and dsDNA. (A–C) Fast scanning AFM images of HOTAIR interacting with HOTAIR-binding DNA 1 (HBD1). White arrowheads point at sites of interaction. (B) Center panel is at preinteraction; right panel is at interaction. (C) Time series showing a live interaction. HOT, HOTAIR. HBD, HOTAIR-binding DNA 1. Reliably assigned HOTAIR segments are denoted by their abbreviation. HOT (ag) shows HOTAIR molecules in aggregate. (D) 3D surface plot of HOTAIR:HBD1 interaction; white arrowhead points at interaction site. The light–dark stripe pattern on HBD and HOTAIR is the actual major/minor grooves (respectively) that build the double helical structure of dsDNA and dsRNA (bar = 20 nm). Image processing details can be found in Supplemental Note 3. (E) Raw specimen used for D, HOTAIR and HBD1 currently at interaction. White arrowhead points to the interaction site (left bar = 35 nm; center and right bars = 15 nm). (F) Binding of the 1200 nt domain of HOTAIR to HBD1 (bar = 70 nm). (G) Occupancy of HBD1 by various HOTAIR:HBD1 ratios shows ratio dependence (n from 2 to 10 = 73, 240, 60, and 18). (H) Occupancy of HBD1 versus HBD4 by HOTAIR at a 5:1 ratio (n = 60 vs. 66). (I) Circular dichroism spectrum of HOTAIR:HBD1, showing evidence of a physical triplex between ssRNA and dsDNA (negative peak at 210 nm, shifted positive peak at 280 nm).

