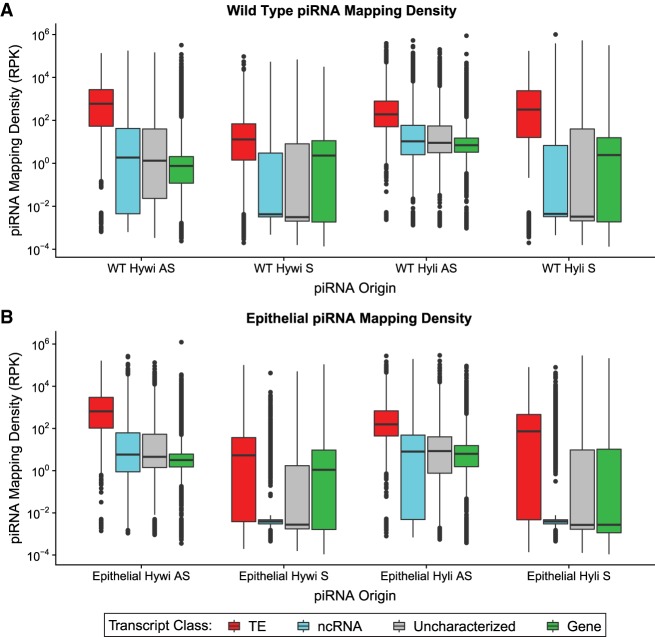
FIGURE 2.
Epithelial piRNAs map predominantly to TE transcripts. Hywi- and Hyli-bound piRNAs isolated from (A) wild-type (WT) Hydra and (B) epithelial Hydra were mapped to the transcriptome. The piRNA mapping density (mapped piRNA counts per kb per million counts) is shown on the y-axis of the box and whisker plots. The results for piRNA mapping are subdivided by: (i) Hywi- or Hyli-bound piRNAs, (ii) sense (S) or antisense (AS) orientation, and (iii) transcript class (see legend). In all cases, TEs (red) have a significantly higher mapping density than other transcript classes as determined using Tukey's range test (P < 0.001; Supplemental Analysis 1).

