

Abstract
Background and Purpose
Alzheimer's disease (AD) is a multifactorial condition leading to cognitive decline and represents a major global health challenge in ageing populations. The lack of effective AD therapeutics led us to develop multifunctional nicotinoyl hydrazones to target several pathological characteristics of AD.
Experimental Approach
We synthesised 20 novel multifunctional agents based on the nicotinoyl hydrazone scaffold, which acts as a metal chelator and a lipophilic delivery vehicle, donating a NAD+ precursor to cells, to target metal dyshomeostasis, oxidative stress, β‐amyloid (Aβ) aggregation, and a decrease in the NAD+/NADH ratio.
Key Results
The most promising compound, 6‐methoxysalicylaldehyde nicotinoyl hydrazone (SNH6), demonstrated low cytotoxicity, potent iron (Fe)‐chelation efficacy, significant inhibition of copper‐mediated Aβ aggregation, oxidative stress alleviation, effective donation of NAD+ to NAD‐dependent metabolic processes (PARP and sirtuin activity) and enhanced cellular NAD+/NADH ratios, as well as significantly increased median Caenorhabditis elegans lifespan (to 1.46‐fold of the control); partly decreased BACE1 expression, resulting in significantly lower soluble amyloid precursor protein‐β (sAPPβ) and Aβ1–40 levels; and favourable blood–brain barrier‐permeation properties. Structure–activity relationships demonstrated that the ability of these nicotinoyl hydrazones to increase NAD+ was dependent on the electron‐withdrawing or electron‐donating substituents on the aldehyde‐ or ketone‐derived moiety. Aldehyde‐derived hydrazones containing the ONO donor set and electron‐donating groups were required for NAD+ donation and low cytotoxicity.
Conclusions and Implications
The nicotinoyl hydrazones, particularly SNH6, have the potential to act as multifunctional therapeutic agents and delivery vehicles for NAD+ precursors for AD treatment.
Abbreviations
- 59Fe2‐Tf
iron‐59 labelled diferric transferrin
- 8‐OH‐QNH
8‐hydroxy‐2‐quinolinecarboxaldehyde nicotinoyl hydrazone
- Aβ
β‐amyloid
- AcNH1
4′‐fluoro‐2′‐hydroxyacetophenone nicotinoyl hydrazone
- AcNH2
5′‐bromo‐2′‐hydroxyacetophenone nicotinoyl hydrazone
- AD
Alzheimer's disease
- APP
amyloid precursor protein
- BBB
blood–brain barrier
- DTPA
diethylenetriaminepentaacetic acid
- InNH1
7‐hydroxy‐1‐indanone nicotinoyl hydrazone
- InNH2
7‐hydroxy‐6‐methyl‐1‐indanone nicotinoyl hydrazone
- InNH3
4‐bromo‐7‐hydroxy‐1‐indanone nicotinoyl hydrazone
- MTT
3‐(4,5‐dimethylthiazol‐2‐yl)‐2,5‐diphenyltetrazolium bromide
- NNH
2‐hydroxy‐1‐naphthaldehyde nicotinoyl hydrazone
- PAMPA‐BBB
parallel artificial membrane permeability assay of the blood–brain barrier
- PCNH
2‐pyridinecarboxaldehyde nicotinoyl hydrazone
- PNH
pyridoxal nicotinoyl hydrazone
- PrNH1
5′‐bromo‐2′‐hydroxypropionylphenone nicotinoyl hydrazone
- QNH
2‐quinolinecarboxaldehyde nicotinoyl hydrazone
- SNH1
salicylaldehyde nicotinoyl hydrazone
- SNH2
3‐chlorosalicylaldehyde nicotinoyl hydrazone
- SNH3
3‐bromo‐salicylaldehyde nicotinoyl hydrazone
- SNH4
3‐hydroxysalicylaldehyde nicotinoyl hydrazone
- SNH5
5‐trifluoromethoxysalicylaldehyde nicotinoyl hydrazone
- SNH6
6‐methoxysalicylaldehyde nicotinoyl hydrazone
- SNH7
5‐fluoro‐3‐methylsalicylaldehyde nicotinoyl hydrazone
- SNH8
5‐bromo‐3‐fluorosalicylaldehyde nicotinoyl hydrazone
- SNH9
3,4‐dihydroxysalicylaldehyde nicotinoyl hydrazone
What is already known
Alzheimer's disease is a complex, multifactorial condition leading to cognitive decline.
No treatments are available to halt or reverse Alzheimer's disease progression.
What this study adds
Frontier therapeutics for Alzheimer's exhibiting novel multi‐targeted activity: NAD+ donation, iron chelation, enhancement of lifespan.
What is the clinical significance
Development of novel therapeutic agents to treat the multiple pathologies that constitute Alzheimer's disease.
1. INTRODUCTION
Although the pathogenesis of Alzheimer's disease (AD) remains complex, this disease has many distinctive characteristics, including (a) deposition of https://www.guidetopharmacology.org/GRAC/LigandDisplayForward?ligandId=4865 (Aβ), resulting in non‐fibrillary pre‐amyloid deposits, fibrillary, dense amyloid plaques, and cerebral amyloid angiopathy (LaFerla & Oddo, 2005); (b) aggregation of hyper‐phosphorylated https://www.guidetopharmacology.org/GRAC/LigandDisplayForward?ligandId=9275 protein, leading to neurofibrillary tangles (LaFerla & Oddo, 2005); (c) metal dyshomeostasis (Greenough, Camakaris, & Bush, 2013); (d) oxidative stress (Eskici & Axelsen, 2012; Greenough et al., 2013); and (e) decreased https://www.guidetopharmacology.org/GRAC/LigandDisplayForward?ligandId=2451/https://www.guidetopharmacology.org/GRAC/LigandDisplayForward?ligandId=4487 ratios (Braidy, Grant, & Sachdev, 2018).
Redox‐active metals, like iron (Fe) and copper (Cu), are involved in ROS generation and are deposited in, and around, amyloid plaques (Eskici & Axelsen, 2012; Greenough et al., 2013). Iron plays a role in amyloid precursor protein (APP) expression (Greenough et al., 2013), and chelation therapy could be beneficial for correcting metal dyshomeostasis. Encouragingly, clioquinol‐based (Ritchie et al., 2003) or desferrioxamine‐based (Crapper McLachlan et al., 1991) chelation therapy has demonstrated some clinical trial success. The planned Deferiprone to Delay Dementia clinical trial aims to give a further perspective of iron chelation therapy in AD (Adlard & Bush, 2018).
Nicotinamide adenine dinucleotide (NAD+) is an essential cofactor and the sole substrate for a variety of enzymes. Oxidative stress during ageing leads to NAD+‐depletion and a decline in NAD‐dependent processes (Clement, Wong, Poljak, Sachdev, & Braidy, 2018). Promotion of NAD+ anabolism represents a new target for AD (Braidy et al., 2018). NAD+ regulates sirtuin deacetylase activity associated with non‐amyloidogenic APP processing (Verdin, 2015). Increased nuclear NAD+ synthesis and activation of https://www.guidetopharmacology.org/GRAC/ObjectDisplayForward?objectId=2707, a nuclear sirtuin, protects against axonal degeneration (Khan, Forouhar, Tao, & Tong, 2007). Additionally, the NAD‐dependent enzyme, https://www.guidetopharmacology.org/GRAC/ObjectDisplayForward?objectId=2771, is activated after oxidative DNA damage (Schreiber, Dantzer, Ame, & de Murcia, 2006). Poly (ADP‐ribose) accumulates at higher levels in AD brains (Love, Barber, & Wilcock, 1999), and PARP expression is also elevated, suggesting increased NAD+ turnover (Khan et al., 2007).
There are no treatments to halt or reverse AD progression, and current drugs target only one characterisitic of AD, such as AChE or NMDA receptor overactivation, and are palliative. Considering this, innovative multi‐targeted agents are desirable for AD (Kaur et al., 2019; Sang et al., 2019). We have synthesised 20 novel nicotinoyl hydrazones (Figure 1a,b) as multifunctional agents that can act as metal chelator and a lipophilic delivery vehicle to donate a NAD+ precursor to cells. In our rational design strategy, the hydrazone moiety was chosen for effective metal‐ion chelation (Kalinowski & Richardson, 2005), whereas a nicotinoyl acid fragment was incorporated to increase cellular NAD+. We have already demonstrated that aroylhydrazones donate isonicotinoyl acid hydrazide to cells (Ellis et al., 2014). Thus, we hypothesised that nicotinoyl hydrazones may undergo hydrolysis, in lysosomes (Ellis et al., 2014), releasing nicotinic acid (https://www.guidetopharmacology.org/GRAC/LigandDisplayForward?ligandId=1588) which may fuel NAD+ production. These agents might act as lipophilic “Trojan Horse” delivery vehicles to gain efficient cellular access, which upon hydrolysis, liberate their active “cargo.”
Figure 1.
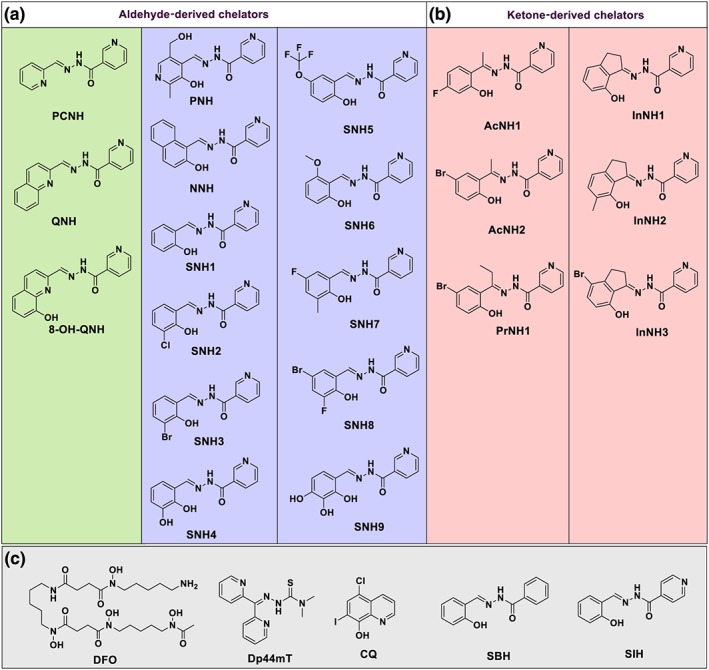
Line drawings of the chemical structures of the nicotinoyl hydrazones developed from various aldehydes (a) and ketones (b). These include 2‐pyridinecarboxaldehyde nicotinoyl hydrazone (PCNH), 2‐quinolinecarboxaldehyde nicotinoyl hydrazone (QNH), 8‐hydroxy‐2‐quinolinecarboxaldehyde nicotinoyl hydrazone (8‐OH‐QNH), pyridoxal nicotinoyl hydrazone (PNH), 2‐hydroxy‐1‐naphthaldehyde nicotinoyl hydrazone (NNH), salicylaldehyde nicotinoyl hydrazone (SNH1), 3‐chlorosalicylaldehyde nicotinoyl hydrazone (SNH2), 3‐bromo‐salicylaldehyde nicotinoyl hydrazone (SNH3), 3‐hydroxysalicylaldehyde nicotinoyl hydrazone (SNH4), 5‐trifluoromethoxysalicylaldehyde nicotinoyl hydrazone (SNH5), 6‐methoxysalicylaldehyde nicotinoyl hydrazone (SNH6), 5‐fluoro‐3‐methylsalicylaldehyde nicotinoyl hydrazone (SNH7), 5‐bromo‐3‐fluorosalicylaldehyde (SNH8) and 3,4‐dihydroxysalicylaldehyde nicotinoyl hydrazone (SNH9), 4′‐fluoro‐2′‐hydroxyacetophenone nicotinoyl hydrazone (AcNH1), 5′‐bromo‐2′‐hydroxyacetophenone nicotinoyl hydrazone (AcNH2), 5′‐bromo‐2′‐hydroxypropionylphenone nicotinoyl hydrazone (PrNH1), 7‐hydroxy‐1‐indanone nicotinoyl hydrazone (InNH1), 7‐hydroxy‐6‐methyl‐1‐indanone nicotinoyl hydrazone (InNH2), and 4‐bromo‐7‐hydroxy‐1‐indanone nicotinoyl hydrazone (InNH3). (c) The structures of the control agents used: desferrioxamine (DFO), di‐2‐pyridylketone 4,4‐dimethyl‐3‐thiosemicarbazone (Dp44mT), clioquinol (CQ), and the structurally related hydrazones, salicylaldehyde benzoyl hydrazone (SBH), and salicylaldehyde isonicotinoyl hydrazone (SIH) [Colour figure can be viewed at http://wileyonlinelibrary.com]
These analogues effectively targeted a number of AD characteristics, including metal dyshomeostasis, oxidative stress, Aβ aggregation, and the decrease of the NAD+/NADH ratio. 6‐Methoxysalicylaldehyde nicotinoyl hydrazone (SNH6; Figure 1a) was identified as a promising agent, displaying multifunctional activity for targeting AD.
2. METHODS
2.1. General procedure for the preparation of the nicotinoyl hydrazones
The nicotinoyl hydrazones were synthesised via a standard Schiff‐base condensation reaction (Kalinowski, Sharpe, Bernhardt, & Richardson, 2008). To a refluxing solution of the desired aldehyde (4 mmol) in ethanol (15 ml), nicotinic hydrazide (0.55 g, 4 mmol) followed by glacial acetic acid (5 drops) were added and refluxed for 1 hr. After cooling to room temperature, the precipitate formed was collected by filtration and washed with ethanol and dried in vacuo.
The general synthetic procedure and characterisation of the Fe complexes of the nicotinoyl hydrazones is described in the Supporting Information.
2.1.1. 2‐Pyridinecarboxaldehyde nicotinoyl hydrazone (PCNH)
White crystals (0.80 g). Yield: 89%. 1H NMR: δ ppm (DMSO‐d 6) 7.44 (1H, m, CH), 7.59 (1H, dd, J = 7.8, 4.9 Hz, CH), 7.90 (1H, t, J = 7.4 Hz, CH), 8.01 (1H, d, J = 8.1 Hz, CH), 8.29 (1H, d, J = 7.8 Hz, CH), 8.48 (1H, s, CH═N), 8.63 (1H, d, J = 4.4 Hz, CH), 8.79 (1H, d, J = 3.7 Hz, CH), 9.10 (1H, s, CH), 12.21 (1H, s, NHCO). 13C NMR: δ ppm (DMSO‐d 6) 120.5, 124.1, 125.0, 129.4, 136.0, 137.4, 149.1, 149.2, 150.0, 152.9, 153.5, 162.5. ESI‐MS in CH3OH: found mass: 249.04 (100%), Calc. mass for C12H10N4ONa: 249.08 [M + Na+]+. Anal. Calc. for C12H10N4O·H2O (%): C 59.00, H 4.95, N 22.94. Found (%): C 59.05, H 4.91, N 23.21.
2.1.2. 2‐Quinolinecarboxaldehyde nicotinoyl hydrazone (QNH)
Pale yellow‐brown solid (1.00 g). Yield: 90%. 1H NMR: δ ppm (DMSO‐d 6) 7.63 (2H, m, 2 × CH), 7.81 (1H, t, J = 7.2 Hz, CH), 8.05 (2H, m, 2 × CH), 8.15 (1H, d, J = 8.5 Hz, CH), 8.31 (1H, d, J = 7.6 Hz, CH), 8.45 (1H, d, J = 8.8 Hz, CH), 8.61 (1H, s, CH═N), 8.81 (1H, d, J = 3.9 Hz, CH), 9.12 (1H, s, CH), 12.36 (1H, s, NHCO). 13C NMR: δ ppm (DMSO‐d 6) 118.0, 124.2, 127.9, 128.4, 128.5, 129.4, 129.5, 130.6, 136.1, 137.3, 147.8, 149.1, 149.2, 153.0, 154.1, 162.6. ESI‐MS in CH3OH: found mass: 299.08 (100%), Calc. mass for C16H12N4ONa: 299.09 [M + Na+]+. Anal. Calc. for C16H12N4O·1.5H2O (%): C 63.36, H 4.99, N 18.47. Found (%): C 63.64, H 4.89, N 18.49.
2.1.3. 8‐Hydroxy‐2‐quinolinecarboxaldehyde nicotinoyl hydrazone (8‐OH‐QNH)
Yellow solid (0.80 g). Yield: 69%. 1H NMR: δ ppm (DMSO‐d 6) 7.18 (1H, d, J = 7.1 Hz, CH), 7.47 (2H, m, 2 × CH), 7.62 (1H, m, CH), 8.16 (1H, d, J = 8.5 Hz, CH), 8.36 (2H, m, 2 × CH), 8.69 (1H, s, CH═N), 8.83 (1H, d, J = 4.2 Hz, CH), 9.16 (1H, s, CH), 9.88 (1H, s, OH), 12.41 (1H, s, NHCO). 13C NMR: δ ppm (DMSO‐d 6) 112.7, 118.2, 118.3, 124.1, 128.9, 129.4, 129.5, 136.1, 137.1, 138.6, 149.0, 149.2, 152.0, 153.0, 153.9, 162.6. ESI‐MS in CH3OH: found mass: 315.08 (100%), Calc. mass for C16H12N4O2Na: 315.09 [M + Na+]+. Anal. Calc. for C16H12N4O2 (%): C 65.75, H 4.14, N 19.17. Found (%): C 65.86, H 4.07, N 19.17.
2.1.4. Pyridoxal nicotinoyl hydrazone (PNH).HCl
Yellow solid (1.13 g). Yield: 88%. 1H NMR: δ ppm (DMSO‐d 6) 2.64 (3H, s, CH 3), 4.79 (2H, s, CH 2), 7.67 (1H, dd, J = 7.9, 4.8 Hz, CH), 8.23 (1H, s, CH), 8.46 (1H, d, J = 8.1 Hz, CH), 8.85 (1H, d, J = 4.2 Hz, CH), 9.10 (1H, s, CH), 9.22 (1H, s, CH═N), 13.04 (1H, bs, OH), 13.38 (1H, s, NHCO). 13C NMR: δ ppm (DMSO‐d 6) 15.5, 58.7, 124.5, 126.9, 128.1, 130.7, 136.8, 137.1, 144.3, 145.1, 149.0, 153.2, 153.3, 162.3. ESI‐MS in CH3CN: Found mass: 309.09 (90%), Calc. mass for C14H14N4O3Na: 309.10 [M − HCl + Na+]+. Anal. Calc. for C14H15N4O3·(HCl)(H2O) (%): C 49.35, H 5.03, N 16.44. Found (%): C 49.61, H 4.99, N 16.41.
2.1.5. 2‐Hydroxy‐1‐naphthaldehyde nicotinoyl hydrazone (NNH)
Yellow solid (1.05 g). Yield: 90%. 1H NMR: δ ppm (DMSO‐d 6) 7.26 (1H, d, J = 8.9 Hz, CH), 7.42 (1H, t, J = 7.5 Hz, CH), 7.63 (2H, m, 2 × CH), 7.91 (1H, d, J = 8.1 Hz, CH), 7.95 (1H, d, J = 9.0 Hz, CH), 8.30 (1H, d, J = 8.6 Hz, CH), 8.33 (1H, dt, J = 7.9, 2.0 Hz, CH), 8.82 (1H, dd, J = 4.8, 1.5 Hz, CH), 9.16 (1H, d, J = 1.6 Hz, CH), 9.47 (1H, s, CH═N), 12.36 (1H, s, OH), 12.61 (1H, s, NHCO). 13C NMR: δ ppm (DMSO‐d 6) 109.0, 119.3, 121.3, 124.1, 124.2, 128.3, 128.4, 129.0, 129.5, 132.1, 133.5, 135.9, 147.9, 149.1, 153.0, 158.6, 161.6. ESI‐MS in CH3OH: Found mass: 314.08 (100%), Calc. mass for C17H13N3O2Na: 314.09 [M + Na+]+. Anal. Calc. for C17H13N3O2 (%): C 70.09, H 4.50, N 14.42. Found (%): C 70.29, H 4.46, N 14.31.
2.1.6. Salicylaldehyde nicotinoyl hydrazone (SNH1)
White solid (0.72 g). Yield: 75%. 1H NMR: δ ppm (DMSO‐d 6) 6.94 (2H, m, 2 × CH), 7.32 (1H, m, CH), 7.58 (2H, m, 2 × CH), 8.29 (1H, dt, J = 7.9, 1.9 Hz, CH), 8.66 (1H, s, CH═N), 8.79 (1H, dd, J = 4.9, 1.5 Hz, CH), 9.10 (1H, d, J = 2.0 Hz, CH), 11.15 (1H, s, OH), 12.24 (1H, s, NHCO). 13C NMR: δ ppm (DMSO‐d 6) 116.9, 119.1, 119.9, 124.1, 129.2, 129.8, 132.1, 135.9, 149.0, 149.1, 152.9, 157.9, 161.9. ESI‐MS in CH3OH: found mass: 264.05 (100%), Calc. mass for C13H11N3O2Na: 264.08 [M + Na+]+. Anal. Calc. for C13H11N3O2 (%): C 64.72, H 4.60, N 17.42. Found (%): C 65.00, H 4.54, N 17.46.
2.1.7. 3‐Chlorosalicylaldehyde nicotinoyl hydrazone (SNH2)
White solid (0.85 g). Yield: 78%. 1H NMR: δ ppm (DMSO‐d 6) 6.97 (1H, m, CH), 7.51 (2H, m, 2 × CH), 7.60 (1H, m, CH), 8.30 (1H, d, J = 8.1 Hz, CH), 8.62 (1H, s, CH═N), 8.80 (1H, m, CH), 9.11 (1H, d, J = 1.7 Hz, CH), 12.28 (1H, s, OH), 12.51 (1H, s, NHCO). 13C NMR: δ ppm (DMSO‐d 6) 120.0, 120.5, 120.9, 124.2, 128.7, 130.0, 132.0, 136.0, 149.1, 149.6, 153.1, 153.7, 162.0. ESI‐MS in CH3CN: found mass: 298.04 (100%), Calc. mass for C13H10N3O2ClNa: 298.04 [M + Na+]+. Anal. Calc. for C13H10N3O2Cl·H2O (%): C 53.16, H 4.12, N 14.31. Found (%): C 53.34, H 4.06, N 14.31.
2.1.8. 3‐Bromosalicylaldehyde nicotinoyl hydrazone (SNH3)
White solid (0.95 g). Yield: 75%. 1H NMR: δ ppm (DMSO‐d 6) 6.91 (1H, t, J = 7.8 Hz, CH), 7.53 (1H, dd, J = 7.7, 1.3 Hz, CH), 7.61 (2H, m, 2 × CH), 8.29 (1H, d, J = 7.8 Hz, CH), 8.58 (1H, s, CH═N), 8.80 (1H, bs, CH), 9.12 (1H, s, CH), 12.46 (1H, s, OH), 12.53 (1H, s, NHCO). 13C NMR: δ ppm (DMSO‐d 6) 110.5, 119.8, 121.1, 124.2, 128.7, 130.9, 135.0, 136.0, 149.1, 149.7, 153.1, 154.7, 162.0. ESI‐MS in CH3CN: found mass: 341.97 (100%), Calc. mass for C13H10N3O2BrNa: 341.99 [M + Na+]+. Anal. Calc. for C13H10N3O2Br (%): C 46.17, H 3.58, N 12.43. Found (%): C 46.41, H 3.62, N 12.33.
2.1.9. 3‐Hydroxysalicylaldehyde nicotinoyl hydrazone (SNH4)
Pale yellow‐brown solid (0.86 g). Yield: 84%. 1H NMR: δ ppm (DMSO‐d 6) 6.76 (1H, m, CH), 6.89 (1H, dd, J = 7.8, 1.5 Hz, CH), 7.01 (1H, dd, J = 7.8, 1.5 Hz, CH), 7.59 (1H, dd, J = 7.8, 4.9 Hz, CH), 8.29 (1H, dt, J = 8.0, 1.9 Hz, CH), 8.62 (1H, s, CH═N), 8.78 (1H, dd, J = 4.9, 1.5 Hz, CH), 9.11 (1H, s, CH), 9.27 (1H, s, OH), 10.98 (1H, s, NHCO), 12.26 (1H, s, OH). 13C NMR: δ ppm (DMSO‐d 6) 118.0, 119.2, 119.7, 120.4, 124.1, 129.1, 135.9, 146.1, 146.6, 149.1, 149.9, 152.9, 161.9. ESI‐MS in CH3OH: found mass: 280.06 (100%), Calc. mass for C13H11N3O3Na: 280.07 [M + Na+]+. Anal. Calc. for C13H11N3O3 (%): C 60.70, H 4.31, N 16.31. Found (%): C 61.04, H 4.20, N 16.23.
2.1.10. 5‐Trifluoromethoxysalicylaldehyde nicotinoyl hydrazone (SNH5)
White crystals (0.78 g). Yield: 60%. 1H NMR: δ ppm (DMSO‐d 6) 7.03 (1H, d, J = 9.0 Hz, CH), 7.31 (1H, dd, J = 8.9, 2.6 Hz, CH), 7.59 (1H, dd, J = 7.9, 4.8 Hz, CH), 7.66 (1H, d, J = 2.4 Hz, CH), 8.29 (1H, dt, J = 8.0, 1.7 Hz, CH), 8.69 (1H, s, CH═N), 8.79 (1H, d, J = 3.9 Hz, CH), 9.10 (1H, s, CH), 11.21 (1H, bs, OH), 12.31 (1H, bs, NHCO). 13C NMR: δ ppm (DMSO‐d 6) 118.2, 119.4, 120.7 (J C‐F = 10.0 Hz), 122.0, 124.1, 124.9, 129.1, 136.0, 141.2, 146.3, 149.1, 153.0, 156.6, 162.1. ESI‐MS in CH3CN: found mass: 348.05 (100%), Calc. mass for C14H10N3O3F3Na: 348.06 [M + Na+]+. Anal. Calc. for C14H10N3O3F3 (%): C 51.70, H 3.10, N 12.92. Found (%): C 51.92, H 3.24, N 12.85.
2.1.11. 6‐Methoxysalicylaldehyde nicotinoyl hydrazone (SNH6)
White crystals (0.83 g). Yield: 77%. 1H NMR: δ ppm (DMSO‐d 6) 3.87 (3H, s, OCH 3), 6.57 (2H, t, J = 7.4 Hz, 2 × CH), 7.29 (1H, t, J = 8.3 Hz, CH), 7.59 (1H, dd, J = 7.8, 4.8 Hz, CH), 8.30 (1H, dt, J = 7.9, 1.9 Hz, CH), 8.79 (1H, d, J = 4.2 Hz, CH), 8.96 (1H, s, CH═N), 9.11 (1H, s, CH), 12.12 (1H, s, OH), 12.33 (1H, bs, NHCO). 13C NMR: δ ppm (DMSO‐d 6) 56.4, 102.2, 107.2, 109.9, 124.2, 128.8, 133.1, 135.9, 146.8, 149.1, 153.0, 159.1, 159.8, 161.6. ESI‐MS in CH3CN: found mass: 294.08 (100%), Calc. mass for C14H13N3O3Na: 294.09 [M + Na+]+. Anal. Calc. for C14H13N3O3·H2O (%): C 58.13, H 5.23, N 14.53. Found (%): C 58.39, H 5.18, N 14.37.
2.1.12. 5‐Fluoro‐3‐methylsalicylaldehyde nicotinoyl hydrazone (SNH7)
Yellow crystals (0.70 g). Yield: 64%. 1H NMR: δ ppm (DMSO‐d 6) 2.23 (3H, s, CH 3), 7.13 (1H, dd, J = 9.0, 2.9 Hz, CH), 7.25 (1H, dd, J = 9.0, 2.9 Hz, CH), 7.60 (1H, dd, J = 7.9, 4.8 Hz, CH), 8.29 (1H, d, J = 8.1 Hz, CH), 8.55 (1H, s, CH═N), 8.80 (1H, d, J = 3.7, CH), 9.11 (1H, s, CH), 11.61 (1H, s, OH), 12.47 (1H, s, NHCO). 13C NMR: δ ppm (DMSO‐d 6) 16.0, 113.8 (J C‐F = 118.0 Hz), 118.0 (J C‐F = 8.5 Hz), 119.6 (J C‐F = 119.6 Hz), 124.1, 127.7 (J C‐F = 7.7 Hz), 128.8, 136.0, 149.1, 149.6 (J C‐F = 2.7 Hz), 152.7 (J C‐F = 1.5 Hz), 153.1, 155.2 (J C‐F = 233.0 Hz), 162.0. ESI‐MS in CH3CN: found mass: 296.06 (100%), Calc. mass for C14H12N3O2FNa: 296.08 [M + Na+]+. Anal. Calc. for C14H12N3O2F·H2O (%): C 57.73, H 4.85, N 14.43. Found (%): C 57.96, H 4.91, N 14.48.
2.1.13. 5‐Bromo‐3‐fluorosalicylaldehyde nicotinoyl hydrazone (SNH8)
Pale yellow‐brown solid (1.20 g). Yield: 89%. 1H NMR: δ ppm (DMSO‐d 6) 7.60 (2H, m, 2 × CH), 7.69 (1H, s, CH), 8.29 (1H, dt, J = 8.0, 1.7 Hz, CH), 8.64 (1H, s, CH═N), 8.79 (1H, dd, J = 8.0, 1.3 Hz, CH), 9.10 (1H, d, J = 1.7 Hz, CH), 11.58 (1H, bs, OH), 12.44 (1H, s, NHCO). 13C NMR: δ ppm (DMSO‐d 6) 109.8 (J C‐F = 9.0 Hz), 120.9 (J C‐F = 21.0 Hz), 123.6 (J C‐F = 4.0 Hz), 124.1, 126.8 (J C‐F = 3.0 Hz), 128.9, 136.0, 145.1 (J C‐F = 14.0 Hz), 146.1 (J C‐F = 3.0 Hz), 149.2, 151.7 (J C‐F = 240.0 Hz), 153.1, 162.2. ESI‐MS in CH3CN: found mass: 359.98 (100%), Calc. mass for C13H9N3O2BrFNa: 359.98 [M + Na+]+. Anal. Calc. for C13H9N3O2BrF·H2O (%): C 43.84, H 3.11, N 11.80. Found (%): C 44.01, H 3.10, N 11.69.
2.1.14. 3,4‐Dihydroxysalicylaldehyde nicotinoyl hydrazone (SNH9)
Pale yellow‐brown solid (0.65 g). Yield: 60%. 1H NMR: δ ppm (DMSO‐d 6) 6.41 (1H, d, J = 7.8 Hz, CH), 6.82 (1H, d, J = 8.5 Hz, CH), 7.58 (1H, m, CH), 8.26 (1H, dt, J = 8.2, 1.9 Hz, CH), 8.47 (1H, s, OH), 8.50 (1H, s, CH═N), 8.77 (1H, dd, J = 4.9, 1.7 Hz, CH), 9.08 (1H, s, CH), 9.51 (1H, s, OH), 11.35 (1H, s, OH), 12.10 (1H, s, NHCO). 13C NMR: δ ppm (DMSO‐d 6) 108.2, 111.2, 121.7, 124.1, 129.2, 133.2, 135.8, 148.0, 149.0, 149.4, 151.0, 152.8, 161.5. ESI‐MS in CH3OH: found mass: 296.05 (100%), Calc. mass for C13H11N3O4Na: 296.07 [M + Na+]+. Anal. Calc. for C13H11N3O4 (%): C 57.14, H 4.06, N 15.38. Found (%): C 57.18, H 4.05, N 15.36.
2.1.15. 4′‐Fluoro‐2′‐hydroxyacetophenone nicotinoyl hydrazone (AcNH1)
White solid (0.83 g). Yield: 75%. 1H NMR: δ ppm (MeOH‐d 4) 2.52 (3H, s, CH 3), 6.90 (1H, d, J = 8.8 Hz, CH), 7.42 (1H, m, CH), 7.62 (1H, dd, J = 7.8, 4.9 Hz, CH), 7.76 (1H, d, J = 2.2 Hz, CH), 8.38 (1H, d, J = 7.6, CH), 8.76 (1H, dd, J = 4.9, 1.5 Hz, CH), 9.11 (1H, s, CH). 1H NMR: δ ppm (DMSO‐d 6) 6.75 (2H, m, 2 × CH), 7.59 (1H, ddd, J = 7.9, 4.8, 0.7 Hz, CH), 7.71 (1H, m, CH), 8.29 (1H, dt, J = 8.0, 1.9 Hz, CH), 8.79 (1H, dd, J = 4.8, 1.6, CH), 9.09 (1H, s, CH), 11.55 (1H, s, OH), 13.77 (1H, s, NHCO). 13C NMR: δ ppm (DMSO‐d 6) 14.8, 104.4 (J C‐F = 24.0 Hz), 106.3 (J C‐F = 22.0 Hz), 116.8 (J C‐F = 3.0 Hz), 124.0, 129.2, 131.1 (J C‐F = 10.0 Hz), 136.4, 149.4, 152.9, 158.5, 161.2 (J C‐F = 13.0 Hz), 163.2 (J C‐F = 247.0 Hz), 163.5. ESI‐MS in CH3CN: found mass: 296.08 (80%), Calc. mass for C14H12N3O2FNa: 296.08 [M + Na+]+, found mass: 569.10 (100%), Calc. mass for C28H24N6O4F2Na: 569.17 [2M + Na+]+. Anal. Calc. for C14H12N3O2F (%): C 61.53, H 4.43, N 15.38. Found (%): C 61.73, H 4.47, N 15.34.
2.1.16. 5′‐Bromo‐2′‐hydroxyacetophenone nicotinoyl hydrazone (AcNH2)
Pale yellow‐brown solid (0.90 g). Yield: 68%. 1H NMR: δ ppm (MeOH‐d 4) 2.52 (3H, s, CH 3), 6.66 (1H, s, CH), 6.69 (1H, m, CH), 7.62 (1H, dd, J = 7.3, 4.9 Hz, CH), 7.69 (1H, dd, J = 9.3, 6.6 Hz, CH), 8.37 (1H, d, J = 8.1, CH), 8.77 (1H, dd, J = 4.9, 1.5 Hz, CH), 9.09 (1H, s, CH). 1H NMR: δ ppm (DMSO‐d 6) 6.90 (1H, d, J = 9.0, 2.9 Hz, CH), 7.45 (1H, dd, J = 9.0, 2.9 Hz, CH), 7.58 (1H, dd, J = 7.9, 4.8 Hz, CH), 7.77 (1H, d, J = 8.1 Hz, CH), 8.28 (1H, s, CH), 8.80 (1H, d, J = 3.7 Hz, CH), 9.09 (1H, s, CH), 11.61 (1H, s, OH), 13.35 (1H, s, NHCO). 13C NMR: δ ppm (DMSO‐d 6) 14.8, 110.1, 120.1, 121.9, 124.0, 129.2, 131.1, 134.2, 136.5, 149.5, 153.0, 157.6, 158.3, 163.6. ESI‐MS in CH3CN: found mass: 356.01 (100%), Calc. mass for C14H12N3O2BrNa: 356.00 [M + Na+]+. Anal. Calc. for C14H12N3O2Br (%): C 50.32, H 3.62, N 12.57. Found (%): C 50.52, H 3.58, N 12.52.
2.1.17. 5′‐Bromo‐2′‐hydroxypropionylphenone nicotinoyl hydrazone (PrNH1)
White solid (0.90 g). Yield: 65%. 1H NMR: δ ppm (DMSO‐d 6) 1.15 (3H, t, J = 7.4 Hz, CH 3), 3.03 (2H, q, CH 2), 6.92 (1H, d, J = 8.8 Hz, CH), 7.46 (1H, dd, J = 8.8, 2.2 Hz, CH), 7.59 (1H, dd, J = 7.8, 5.0 Hz, CH), 7.75 (1H, d, J = 2.2 Hz, CH), 8.25 (1H, d, J = 8.1 Hz, CH), 8.80 (1H, d, J = 3.7 Hz, CH), 9.05 (1H, s, CH), 11.65 (1H, s, OH), 13.40 (1H, s, NHCO). 13C NMR: δ ppm (DMSO‐d 6) 11.7, 19.9, 110.2, 120.4, 123.9, 129.3, 130.7, 134.2, 136.6, 149.6, 152.9, 158.8, 160.7, 163.9. ESI‐MS in CH3CN: found mass: 370.01 (100%), Calc. mass for C15H14N3O2BrNa: 370.02 [M + Na+]+. Anal. Calc. for C15H14N3O2Br (%): C 51.74, H 4.05, N 12.07. Found (%): C 51.80, H 4.03, N 12.04.
2.1.18. 7‐Hydroxy‐1‐indanone nicotinoyl hydrazone (InNH1)
Pale yellow‐brown solid (0.66 g). Yield: 62%. 1H NMR: δ ppm (DMSO‐d 6) 3.09 (4H, m, 2 × CH 2), 6.77 (1H, d, J = 8.1 Hz, CH), 6.91 (1H, d, J = 7.3 Hz, CH), 7.31 (1H, t, J = 7.7 Hz, CH), 7.57 (1H, dd, J = 7.6, 4.9 Hz, CH), 8.24 (1H, d, J = 7.8 Hz, CH), 8.77 (1H, d, J = 3.7 Hz, CH), 9.05 (1H, s, CH), 10.19 (1H, s, OH), 11.26 (1H, s, NHCO). 13C NMR: δ ppm (DMSO‐d 6) 28.3, 29.0, 113.4, 116.9, 122.9, 124.0, 129.8, 133.2, 136.3, 149.3, 150.2, 152.6, 155.7, 162.8, 167.4. ESI‐MS in CH3CN: found mass: 290.08 (100%), Calc. mass for C15H13N3O2Na: 290.09 [M + Na+]+. Anal. Calc. for C15H13N3O2 (%): C 67.40, H 4.90, N 15.72. Found (%): C 67.63, H 4.82, N 15.60.
2.1.19. 7‐Hydroxy‐6‐methyl‐1‐indanone nicotinoyl hydrazone (InNH2)
Yellow solid (0.70 g). Yield: 63%. 1H NMR: δ ppm (DMSO‐d 6) 2.19 (3H, s, CH 3), 3.07 (4H, broad singlet, 2 × CH 2), 6.81 (1H, d, J = 7.6 Hz, CH), 7.19 (1H, d, J = 7.6 Hz, CH), 7.57 (1H, dd, J = 7.8, 4.8 Hz, CH), 8.24 (1H, d, J = 7.8 Hz, CH), 8.77 (1H, dd, J = 3.5, 1.5 Hz, CH), 9.05 (1H, s, CH), 10.34 (1H, s, OH), 11.24 (1H, s, NHCO). 13C NMR: δ ppm (DMSO‐d 6) 14.8, 28.5, 116.4, 121.8, 122.4, 124.0, 129.8, 134.5, 136.3, 147.5, 149.3, 152.6, 153.7, 162.8, 167.6. ESI‐MS in CH3CN: found mass: 304.10 (100%), Calc. mass for C16H15N3O2Na: 304.11 [M + Na+]+. Anal. Calc. for C16H15N3O2 (%): C 68.31, H 5.37, N 14.94. Found (%): C 68.24, H 5.42, N 14.90.
2.1.20. 4‐Bromo‐7‐hydroxy‐1‐indanone nicotinoyl hydrazone (InNH3)
Yellow solid (0.82 g). Yield: 60%. 1H NMR: δ ppm (DMSO‐d 6) 3.05 (4H, m, 2 × CH 2), 6.77 (1H, d, J = 8.8 Hz, CH), 7.46 (1H, d, J = 8.8 Hz, CH), 7.57 (1H, dd, J = 7.7, 5.0 Hz, CH), 8.23 (1H, d, J = 7.8 Hz, CH), 8.77 (1H, d, J = 3.7 Hz, CH), 9.04 (1H, s, CH), 10.31 (1H, s, OH), 11.36 (1H, s, NHCO). 13C NMR: δ ppm (DMSO‐d 6) 27.9, 30.6, 108.9, 116.2, 123.9, 124.7, 129.6, 135.1, 136.3, 149.2, 149.4, 152.7, 155.0, 163.0, 166.3. ESI‐MS in CH3CN: Found mass: 367.98 (100%), Calc. mass for C15H12N3O2BrNa: 368.00 [M + Na+]+. Anal. Calc. for C15H12N3O2Br·H2O (%): C 49.47, H 3.88, N 11.54. Found (%): C 49.56, H 3.87, N 11.46.
2.2. Cell culture
Human SK‐N‐MC neuroepithelioma cells (Cat # HTB‐10; RRID:CVCL_0530) were obtained from and authenticated by the American Type Culture Collection (Manassas, VA). The cells were cultured by standard procedures (Richardson, Tran, & Ponka, 1995; Yuan, Lovejoy, & Richardson, 2004) in MEM supplemented with 10% fetal calf serum (Sigma‐Aldrich), penicillin (100 U·ml−1), streptomycin (100 mg·ml−1), L‐glutamine (2 mM), non‐essential amino acids, sodium pyruvate (1 mM), and Fungizone® (0.25 μg·ml−1) and incubated at 37°C in a humidified atmosphere containing 5% CO2/95% air (Forma Scientific, Marietta, OH).
2.3. MTT assay
The cytotoxic potential of nicotinoyl hydrazones was determined by the 3‐(4,5‐dimethylthiazol‐2‐yl)‐2,5‐diphenyltetrazolium bromide (MTT) assay, using SK‐N‐MC cells and standard procedures (Richardson et al., 1995). The cytotoxicity of the nicotinoyl hydrazones was examined between 0.2 and 100 μM. Using the SK‐N‐MC cell type, we showed that MTT results were shown to be directly proportional to cell numbers derived from viable cell counts using Trypan blue (Richardson et al., 1995).
Based on data from a previous study assessing the effect of chelators on the proliferation of SK‐N‐MC cells (Richardson et al., 1995), a sample size of >4 biological replicates was determined using a priori power analysis (G*Power 3.1; RRID:SCR_013726). This resulted in >80% statistical power to detect at least 20% difference in mean with an effect size of 2.22 and SD of 0.09.
2.4. Alleviation of H2O2‐mediated cytotoxicity
A previously reported protocol using the MTT assay (Lim, Kalinowski, & Richardson, 2008) was used to assess the ability of the nicotinoyl hydrazones to protect SK‐N‐MC neuroepithelioma cells against H2O2‐mediated cytotoxicity. SK‐N‐MC cells were seeded at a density of 1.5 × 10⁴ cells per well in 96‐well microtiter plates and incubated at 37°C/24 hr. Following this incubation, cells were pre‐incubated with serum‐free medium alone or serum‐free medium containing the nicotinoyl hydrazones (10 μM) or the control agents, 2‐pyridinecarboxaldehyde 2‐thiophenecarboxyl hydrazone (PCTH), clioquinol, nicotinic hydrazide (NH), salicylaldehyde benzoyl hydrazone (SBH), or salicylaldehyde isonicotinoyl hydrazone (SIH), at 10 μM for 2 hr/37°C. After removing the medium, the cells were then treated with serum‐free medium alone or serum‐free medium containing H2O2 (150 μM) for 24 hr/37°C. Cell viability was measured using the MTT assay, as described above.
2.5. Labelling of transferrin with 59Fe
The Fe‐transport protein, transferrin (Tf), was labelled with 59Fe (PerkinElmer Life and Analytical Sciences, Boston, MA) to form 59Fe2‐Tf using standard methods (Richardson et al., 1995).
2.6. Cellular 59Fe mobilisation
The effect of chelators on 59Fe mobilisation from SK‐N‐MC cells was determined by 59Fe efflux experiments using a standard protocol (Richardson et al., 1995; Yuan et al., 2004). Cell viability examination using Trypan blue staining and phase contrast microscopy demonstrated that there was no decrease in viability over the short incubation (3 hr at 37°C) with the chelators.
Based on data from previous studies assessing the effect of chelators on cellular 59Fe mobilisation from SK‐N‐MC cells (Richardson et al., 1995; Yuan et al., 2004), a sample size of >7 biological replicates was determined using a priori power analysis (G*Power 3.1). This resulted in >80% statistical power to detect at least 20% difference in mean with an effect size of 1.67 and SD of 0.12.
2.7. Cellular 59Fe uptake
In order to estimate the ability of chelators to prevent the cellular uptake of 59Fe from the Fe‐transport protein, 59Fe2‐Tf, 59Fe uptake experiments were performed using standard procedures (Richardson et al., 1995; Yuan et al., 2004). As in Section 2.6, there was no decrease in cell viability during the short incubation with the chelators (i.e., 3 hr/37°C).
Based on data from previous studies assessing the effect of chelators on cellular 59Fe uptake by SK‐N‐MC cells (Richardson et al., 1995; Yuan et al., 2004), a sample size of >3 biological replicates was determined using a priori power analysis (G*Power 3.1). This resulted in >90% statistical power to detect at least 20% difference in mean with an effect size of 7.14 and SD of 0.03.
2.8. Ascorbate oxidation assay
The ability of chelator Fe complexes to catalyse ascorbate oxidation was examined as described previously (Richardson et al., 2006). These studies utilised an iron‐binding equivalent of 1 due to the different ligand denticity (i.e., hexadentate ligands, EDTA and desferrioxamine, form 1:1 ligand: Fe complexes, while the tridentate ligands, di‐2‐pyridylketone 4,4‐dimethyl‐3‐thiosemicarbazone [Dp44mT] and the hydrazones, form 2:1 ligand: Fe complexes; Kalinowski & Richardson, 2005; Richardson et al., 2006) and indicate complete filling of the Fe coordination shell.
Based on data from a previous study assessing the effect of Fe chelators on ascorbate oxidation (Richardson et al., 2006), a sample size of >3 biological replicates was determined using a priori power analysis (G*Power 3.1). This led to >90% statistical power to detect at least 20% difference in mean with an effect size of 6.89 and SD of 0.03.
2.9. Inhibition of Cu(II)‐mediated aggregation of Aβ
A well‐characterised turbidimetric assay was utilised to examine the ability of the nicotinoyl hydrazones to inhibit Cu(II)‐mediated aggregation of Aβ1–40 (Gomes et al., 2014; Jones et al., 2012). Based on data from previous studies assessing Cu(II)‐mediated Aβ aggregation (Gomes et al., 2014; Jones et al., 2012), a sample size of 12 biological replicates was determined using a priori power analysis (G*Power 3.1). This generated >80% statistical power to detect at least 20% difference in mean with an effect size of 1.25 and SD of 0.16.
2.10. Blood–brain barrier penetration
The ability of nicotinoyl hydrazones to permeate the blood–brain barrier (BBB) was examined using the parallel artificial membrane‐permeation assay (PAMPA), following a well‐established protocol (Di et al., 2003). Our studies demonstrated a linear correlation (R 2 = 0.9112) between experimental and reported permeability of 5 commercial drugs ‐ theophylline, verapamil, progesterone, chlorpromazine, and donepezil, obtained from the PAMPA‐BBB assay (Figure S2).
We show in Table S1 the predictions of CNS penetration based on ranges of permeability values from the PAMPA BBB assay determined in Figure S2 and as indicated by Di et al. (2003).
2.11. Human primary astrocyte cell culture
Human primary astrocytes were cultured from resected normal adult brain tissue with informed consent at the Minimally Invasive Cancer Centre, Prince of Wales Hospital, Sydney, Australia (Reference number X12‐0314 and HREC/12/RPAH/481). Astrocytes were prepared using a previously described protocol (Guillemin et al., 2001). The mixed brain cell cultures were shaken for 2 hr at 37°C at 220 rpm, and the floating cells were centrifuged and transferred to cell culture flasks at a density of 1 × 10⁵ cells·ml−1. Cells were grown in RPMI with the following supplements: 10% fetal calf serum, 1% L‐glutamax, and 1% antibiotic/antifungal. Approval was obtained from the Human Research Ethics Committee of the University of New South Wales (human brain tissue reference number: HC12563).
2.12. NAD+/NADH assay
Intracellular NAD+ and NADH were extracted from treated and non‐treated astrocyte cell homogenates, as previously described (Trammell & Brenner, 2013). Briefly, 100 μl of cell homogenate was added to 20 μl of [D4]‐NA in 5% formic acid (v/v). Samples were then mixed with 300 μl of acetonitrile, vortexed for 15 s, and then centrifuged, and dried via speed vacuum overnight at 37°C. Samples were then reconstituted in 100 μl of 10‐mM ammonium acetate with 0.1% formic acid. Standard curves were prepared in water, as described above.
Separation and quantitation of NAD+ and NADH were performed with a Sciex QTRAP 5500 mass spectrometer operated in positive ion multiple reaction monitoring mode, as described previously (Trammell & Brenner, 2013). NAD+ and NADH were separated on a Phenomenex NH₂ column (150 mm × 2 mm × 3 μm; Phenomenex, Torrance, CA) using the same gradient and mobile phase as described for the acid separation (Trammell & Brenner, 2013).
The analytes were separated using a binary solvent gradient consisting of 5‐mM NH4OAc (pH 9.5) adjusted with ammonia (mobile phase A) and acetonitrile (mobile phase B) with a flow rate of 250 μl min−1. The initial solvent composition at injection was 25% A, followed by a 2‐min gradient to 45% A, and a fast gradient ramp to 80% A (0.1 min), which was maintained for 5.9 min. Then, A was increased again to 95% (2 min), held for 13 min, and then reverted to initial conditions (0.1 min) for equilibration, with a total run time of 30 min. LC‐MS standard curves, representative chromatograms, and retention times for NAD+ and NADH are shown Figure S3 and Table S2.
Based on data from a previous study assessing NAD+/NADH levels of human primary astrocytes (Braidy, Guillemin, & Grant, 2011), a sample size of >4 biological replicates was determined using a priori power analysis (G*Power 3.1). This resulted in >80% statistical power to detect at least 20% difference in mean with an effect size of 2.50 and SD of 0.08.
2.13. NAD+‐consumption activity assay
NAD+‐consumption activity of nuclear extracts (Braidy et al., 2014) was measured as previously described (Putt, Beilman, & Hergenrother, 2005). The final buffer solution contained MgCl2 (10 mM), Triton X‐100 (1%), and NAD+ (20 μM) in Tris buffer (50 mM; pH 8.1). The plate was incubated for 1 hr/37°C, and the amount of NAD+ consumed was measured using the NAD assay, as described above.
Based on data from a previous study assessing NAD+ consumption (Putt et al., 2005), a sample size of five biological replicates was determined using a priori power analysis (G*Power 3.1). This generated >80% statistical power to detect at least 20% difference in mean with an effect size of 2.22 and SD of 0.09.
2.14. SIRT1 deacetylase assay
Sirtuin 1 (SIRT1) deacetylase activity was evaluated using the Cyclex SIRT1/Sir2 Deacetylase Flourometric Assay Kit (CycLex, Nagano, Japan), as previously described (Braidy, Guillemin, Mansour, et al., 2011). The final reaction mixture (100 μl) contained 50‐mM Tris–HCl (pH 8.8), 4‐mM MgCl2, 0.5‐mM DTT, 0.25 mA ml−1 of lysyl endopeptidase, 1‐μM trichostatin A, 200‐μM NAD+, and 5 μl of nuclear sample. The samples were mixed and incubated for 10 min at room temperature, and the fluorescence intensity (ex. 340 nm, em. 460 nm) measured every 30 s for a total of 60 min immediately after the addition of fluoro‐substrate peptide (20‐μM final concentration). These measurements implemented a Fluostar Optima Fluorometer (NY, USA) and were normalised by the protein content, with the results being reported as relative fluorescence per μg of protein (AU).
Based on data from a previous study assessing SIRT1 deacetylase activity in human primary astrocytes (Braidy, Guillemin, & Grant, 2011), a sample size of five biological replicates was determined using a priori power analysis (G*Power 3.1). This produced >80% statistical power to detect at least 20% difference in mean with an effect size of 2.32 and SD of 0.08.
2.15. Western blotting
Western blotting was conducted and described in accordance to Alexander et al. (2018). The following primary antibodies were used in this study: β‐site APP cleaving enzyme 1 (BACE1) rabbit mAb (catalogue #5606T; rabbit IgG; Epitope: residues surrounding H490 of human BACE1) and APP/Aβ (NAB228) mouse mAb (catalogue #2450; mouse IgG2A; Epitope: N‐terminus of Aβ) from Cell Signaling Technology; anti‐APP C‐terminal rabbit pAb (catalogue #A8717; rabbit IgG; Epitope: C‐terminal of human APP) and anti‐β‐actin mouse mAb (catalogue #A5316; mouse IgG2a; Epitope: N‐terminal of β‐actin; RRID:AB_476743) from Sigma‐Aldrich; purified anti‐sAPPβ rabbit pAb (catalogue #813401; rabbit IgG; Epitope: N‐terminus of sAPPβ) from Biolegend and transferrin receptor 1 (TfR1) mouse mAb (catalogue #13‐6890; mouse IgG1; Epitope: N‐terminal region of TfR1) from Thermo Fisher Scientific. All primary antibodies were used at a dilution of 1:1,000, except for the anti‐β‐actin antibody, which was used at a 1:10,000 dilution and were prepared in 5% w/v BSA (A7906; ≥98%; Sigma‐Aldrich) in 1× TBS with 0.1% Tween® 20 for single use. The secondary antibodies, goat anti‐rabbit IgG pAb (A0545; Epitope: rabbit IgG) and goat anti‐mouse pAb (A9917; Epitope: mouse IgG Fab fragment) conjugated with HRP, were used at a 1:5,000 dilution and were purchased from Sigma‐Aldrich. Proteins were electro‐blotted onto PVDF membranes (0.45‐μm pore size; GE Healthcare, WI, USA) at 30 V for 16 hr at 4°C, which were blocked using 5% w/v BSA (A7906; ≥98%; Sigma‐Aldrich) in 1× TBS with 0.1% Tween® 20. The ChemiDoc MP Imaging System (Bio‐Rad, CA, USA) was used for protein visualisation, and the analysis of blots was performed using Image Lab Software (Bio‐Rad). All densitometry was normalised to the relative β‐actin loading control.
Based on our previous western blotting analysis (Palanimuthu et al., 2017), a sample size of >3 biological replicates was determined using a priori power analysis (G*Power 3.1). This generated >90% statistical power to detect at least 20% difference in mean with an effect size of 20.00 and SD of 0.01.
2.16. Enzyme‐linked immunosorbent assay
The human Aβ1–40 ELISA kit (catalogue #: KHB3482) was purchased from Thermo Fisher Scientific. The cell culture medium was harvested in the presence of the protease inhibitor, AEBSF, after a 24 hr/37°C incubation of primary human cultures of astrocytes with 5‐μM batimastat, 5‐μM C3, 25‐μM SNH2, or 25‐μM SNH6. Cell debris was removed by centrifugation at 1,400 rpm/1 min/4°C. The secreted Aβ1–40 was detected using the ELISA kit, following the manufacturer's instructions.
Based on data provided by the manufacturer (ThermoFisher Scientific), a sample size of >3 biological replicates was determined using a priori power analysis (G*Power 3.1). This resulted in >90% statistical power to detect at least 20% difference in mean with an effect size of 4.88 and SD of 0.04. The immuno‐related procedures used comply with the recommendations made by the British Journal of Pharmacology.
2.17. Caenorhabditis elegans strain and culture conditions
The wild‐type Bristol N2 strain of C. elegans (RRID:SCR_007341) was obtained from the Caenorhabditis Genetics Center and were maintained on solid nematode growth medium (NGM) with a lawn of Escherichia coli OP50 that was incubated at 20°C (Brenner, 1974).
2.18. C. elegans lifespan assay
All test agents were dissolved in 800‐μl methanol and then added to liquid NGM to reach a final concentration of 100 μM; the exception was for FeCl3 and Fe(SNH6)2, which were maintained at 50 μM. Methanol alone was used for the control. Assays were performed in 35‐mm petri dishes with E. coli OP50 as the food source for C. elegans. The C. elegans were synchronised to obtain the L4 larval stage (Amrit, Ratnappan, Keith, & Ghazi, 2014). Thereafter, 25 healthy L4 worms were transferred onto fresh NGM plates containing the relevant test agent (Day 0) and shifted to 25°C for the subsequent longevity experiments (Amrit et al., 2014).
The parental nematodes were transferred to new NGM plates every day to avoid counting of the second‐generation individuals. The survival (measured as response to touch) of C. elegans was scored each day. At least 100 worms were used for each treatment per experiment, and experiments were repeated at least 5 times (N = 5). Kaplan–Meier survival curves were plotted using GraphPad Prism (GraphPad Software, San Diego, CA, USA; RRID:SCR_002798). Sex as a biological variable is not applicable as C. elegans are hermaphrodites.
Based on data from a previous study (Wood et al., 2004), a sample size of >197 nematodes was determined using a priori power analysis (G*Power 3.1). This produced >80% statistical power to detect a 10% increase in survival with an effect size of 0.2.
2.19. Data and statistical analysis
The Shapiro–Wilk test was utilised to assess data normality. Homogeneity of variation was assessed using the Breusch–Pagan test. With the exception of C. elegans lifespan studies, all datasets were found to be homoscedastic with a Gaussian distribution; thus, no data normalisation was necessary. Gaussian distributed data were subjected to the parametric Student's t test (two‐tailed, independent groups), or one‐way and two‐way ANOVA with Tukey's post hoc test. Student's t test was performed using Microsoft Excel (RRID:SCR_016137), while one‐way and two‐way ANOVAs were performed using GraphPad Prism 7. Significance between groups for lifespan studies was determined log‐rank (Mantel‐Cox) test using GraphPad Prism 7. The results were considered significant when P < .05. For data expressed as “fold mean of the controls,” the average Control group values were calculated from all biological replicates of the Control, and all data were then universally divided by this average Control group value. This transformation maintains the coefficient of variation of the data.
The table and figure legends state the number of independent biological replicates (N) utilised, and statistical analyses were conducted only using these independent biological replicates where each group was at least N = 5. The data and statistical analysis comply with the recommendations of the British Journal of Pharmacology on experimental design and analysis in pharmacology (Curtis et al., 2018). Studies were designed to generate groups of equal size using randomisation and blinded analysis during experimentation and data analysis. There was no outlier exclusion.
2.20. Materials
All solvents and reagents were procured from Sigma‐Aldrich (St. Louis, MO, USA). The β‐secretase inhibitor, C3, was purchased from Millipore (Burlington, MA, USA), while the α‐secretase inhibitor, https://www.guidetopharmacology.org/GRAC/LigandDisplayForward?ligandId=5145, was purchased from Tocris Bioscience (Bristol, UK). The 1H nuclear magnetic resonanceNMR (NMR; 400 MHz) and 13C NMR (100 MHz) spectra were obtained using a Bruker Advance 400 NMR spectrometer using DMSO‐d6 as a solvent (unless stated otherwise) and tetramethylsilane was used as an internal standard. 3‐(4,5‐Dimethylthiazol‐2‐yl)‐2,5‐diphenyltetrazolium bromide (MTT) and other biochemicals were purchased from Sigma‐Aldrich. Elemental analysis was performed on a Thermo Scientific Flash 2000 CHNS/O analyser. Electrospray ionisation mass spectra (ESI‐MS) were acquired using a Bruker amaZon SL mass spectrometer in enhanced resolution mode. Partition coefficients (Log Pcalc) and topological polar surface area (TPSA) for all ligands were estimated using ChemBioDraw v.14.0.1. (Perkin‐Elmer, Waltham, MA, USA). The purity of all hydrazones was determined to be ≥95% using elemental analysis (C, H, and N). X‐ray diffraction methods and ORTEP diagrams of the nicotinoyl hydrazones (Figure S1) are described in the Supporting Information.
2.21. Nomenclature of targets and ligands
Key protein targets and ligands in this article are hyperlinked to corresponding entries in http://www.guidetopharmacology.org, the common portal for data from the IUPHAR/BPS Guide to PHARMACOLOGY (Harding et al., 2018), and are permanently archived in the Concise Guide to Pharmacology 2019/20 (Alexander et al., 2019).
3. RESULTS
3.1. Synthesis
The nicotinoyl hydrazones (Figure 1a,b) were synthesised by Schiff‐base condensations (Kalinowski et al., 2008). Various aldehydes and ketones were chosen to form 20 tridentate ligands (NNO or ONO donors) upon reaction with NA hydrazide. The structures of SNH2 and SNH6 were determined by X‐ray crystallography (Figure S1). As aroylhydrazones effectively chelate Fe, the 1:2 Fe:ligand complexes of selected hydrazones (PCNH, SNH6, SNH8, and PrNH1) were synthesised and characterised (Supporting Information).
3.2. Cytotoxicity of the nicotinoyl hydrazones
The cytotoxicity of the hydrazones and their selected Fe complexes was examined using SK‐N‐MC neuroepithelioma cells (Table 1) that represent a neural model implemented to assess therapeutic agents for AD (Palanimuthu et al., 2017; Plaschke & Kopitz, 2015). The well‐characterised Fe chelators, desferrioxamine, (Figure 1c) and Dp44mT (Figure 1c), were used as controls because of their low and potent cytotoxicity, respectively, is well‐described in SK‐N‐MC cells (Richardson et al., 2006). As additional controls, we also assessed the cytotoxicity of clioquinol, a chelator previously investigated clinically for AD (Ritchie et al., 2003; Figure 1c), and the structurally related hydrazones, SBH (Figure 1c) and SIH (Figure 1c). In these studies, desferrioxamine and Dp44mT displayed IC50 values of 20.91 and 0.009 μM respectively (Table 1). clioquinol, SBH, and SIH had IC50 values of 14.11, 9.43, and 19.38 μM respectively.
Table 1.
Cytotoxicity of the novel hydrazones and selected Fe complexes compared to the reference chelators, desferrioxamine (DFO), Dp44mT, clioquinol (CQ), SBH, and SIH, in SK‐N‐MC neuroepithelioma cells after a 72 hr/37°C incubation, as determined by the MTT assay
| Compound | Ligand IC50 (μM) | Fe complex IC50 (μM) |
|---|---|---|
| NH | >100 | |
| DFO | 20.91 ± 1.17 | |
| Dp44mT | 0.009 ± 0.002 | |
| CQ | 14.11 ± 1.93 | |
| SBH | 9.43 ± 1.42 | |
| SIH | 19.38 ± 0.09 | |
| PCNH | 11.43 ± 1.74 | 5.80 ± 0.26 |
| QNH | 9.67 ± 0.77 | |
| 8‐OH‐QNH | 21.07 ± 3.00 | |
| PNH | 21.82 ± 0.50 | |
| NNH | 2.27 ± 0.06 | |
| SNH1 | 2.97 ± 0.86 | |
| SNH2 | 19.47 ± 1.72 | |
| SNH3 | 12.00 ± 1.07 | |
| SNH4 | 3.15 ± 0.66 | |
| SNH5 | 13.47 ± 1.10 | |
| SNH6 | 18.02 ± 0.48 | >100 |
| SNH7 | 1.81 ± 0.19 | |
| SNH8 | 11.06 ± 0.17 | 2.42 ± 0.44 |
| SNH9 | >100 | |
| AcNH1 | 4.50 ± 0.78 | |
| AcNH2 | 3.67 ± 1.12 | |
| PrNH1 | 5.23 ± 0.95 | 85.93 ± 0.82 |
| InNH1 | 0.56 ± 0.04 | |
| InNH2 | 0.61 ± 0.11 | |
| InNH3 | 1.36 ± 0.06 |
Note. IC50 values are presented as mean ± SD (N = 6 biological replicates). Grey: control compounds; green: aldehyde‐derived hydrazones utilising the NNO donor atom set; blue: aldehyde‐derived hydrazones utilising the ONO donor atom set; and red: ketone‐derived hydrazones utilising the ONO donor atom set. CQ, clioquinol; DFO, desferrioxamine.
The novel hydrazones demonstrated an IC50 between 0.56 and >100 μM. The ketone‐derived analogues generally showed greater cytotoxicity than aldehyde‐derived analogues (Figure 1a,b). Many aldehyde‐derived hydrazones, including PCNH, 8‐OH‐QNH, PNH, SNH2, SNH3, SNH5, SNH6, SNH8, and SNH9, displayed low cytotoxicity (i.e., IC50 > 10 μM; Table 1).
The four Fe complexes assessed were selected as representatives for each subset of hydrazones (i.e., ketone vs. aldehyde and ONO vs. NNO donor sets). The cytotoxicity of the PCNH‐ and SNH8‐Fe complexes was increased, relative to that of their free ligands (Table 1). In contrast, SNH6 and PrNH1 demonstrated low cytotoxicity as Fe complexes (Table 1). Hence, several hydrazones and their Fe complexes demonstrated low cytotoxicity, in particular SNH6, suggesting its suitability for long‐term treatment.
3.3. Effect of nicotinoyl hydrazones on cellular 59Fe release
Brain Fe dyshomeostasis and Fe loading is a characteristic of AD, leading to oxidative stress (Greenough et al., 2013). Therefore, we examined the efficacy of the nicotinoyl hydrazones to mobilise intracellular Fe versus the controls: (a) nicotinic acid hydrazide (NH), a precursor of all nicotinoyl hydrazones herein; (b) the Fe chelators, desferrioxamine and Dp44mT (Yuan et al., 2004); (c) clioquinol; and (d) the structurally related hydrazones, SBH and SIH, that show high Fe chelation efficacy (Richardson et al., 1995).
Control medium alone resulted in minimal 59Fe release from SK‐N‐MC cells (Figure 2a). NH did not induce significant 59Fe release. Desferrioxamine mobilised low amounts of intracellular 59Fe, whereas Dp44mT, clioquinol, SBH, and SIH markedly increased 59Fe release (Figure 2a). All analogues, except SNH9 and agents with NNO donor atoms (i.e., PCNH, QNH, and 8‐OH‐QNH), demonstrated high 59Fe chelation efficacy and were comparable to Dp44mT, clioquinol, SBH, and SIH (Figure 2a). PCNH and SNH9 displayed moderate 59Fe chelation efficacy, while the quinoline analogues, QNH and 8‐OH‐QNH, were comparable to desferrioxamine. The high activity of several agents, including SNH6, demonstrated their potential to target cellular Fe accumulation in AD.
Figure 2.
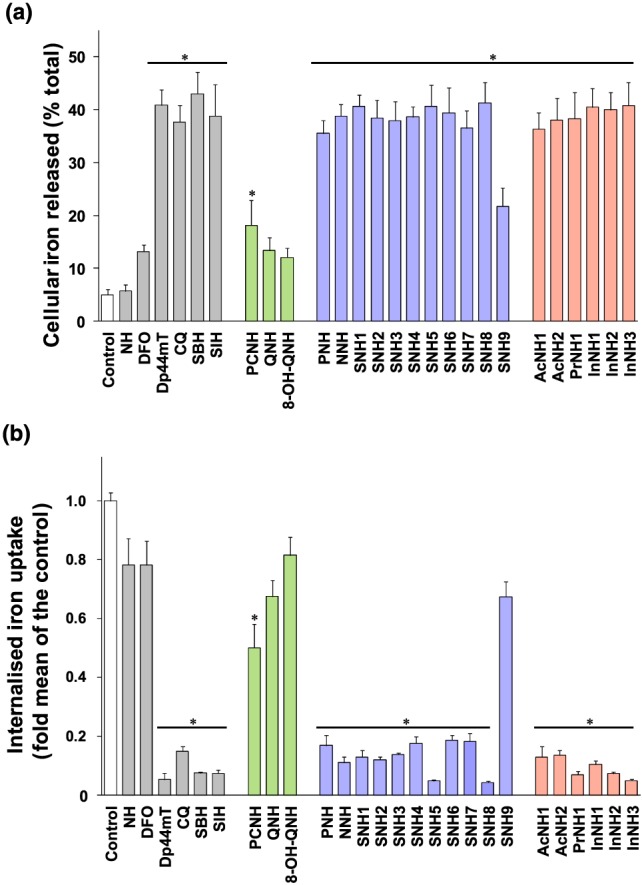
The effect of the chelators on (a) 59Fe mobilisation from pre‐labelled cells, or (b) inhibition of 59Fe uptake from 59Fe‐Tf by SK‐N‐MC neuroepithelioma cells. (a) Cells were preincubated with 59Fe‐Tf (0.75 μM) for 3 hr at 37°C, the media aspirated, and the cells then washed four times with ice‐cold PBS. The cells were then incubated with media alone (control) or media containing the compounds (25 μM) for another 3 hr at 37°C. (b) In 59Fe uptake studies, cells were incubated with 59Fe2‐Tf (0.75 μM) alone (control) or with 59Fe2‐Tf (0.75 μM) in the presence of the compounds (25 μM) for 3 hr at 37°C. The cells were then washed four times with ice‐cold PBS and subsequently incubated with the protease, Pronase (1 mg·ml−1), for 30 min at 4°C. Results are expressed as the mean ± SD (N = 9 biological replicates). *P < .05, significantly different from the control [Colour figure can be viewed at http://wileyonlinelibrary.com]
3.4. Effect of nicotinoyl hydrazones in inhibiting 59Fe uptake from 59Fe‐transferrin (Tf)
Considering the marked activity of the hydrazones on cellular 59Fe release, we examined their ability to inhibit 59Fe uptake by SK‐N‐MC cells from 59Fe2‐Tf (Figure 2b). As for the efflux studies, NH, desferrioxamine, Dp44mT, clioquinol, SBH, and SIH were utilised as controls. The precursor, NH, slightly reduced 59Fe uptake (Figure 2b). In contrast, Dp44mT markedly inhibited 59Fe uptake, while clioquinol was less effective (Figure 2b). SBH and SIH showed activity greater than desferrioxamine and clioquinol. Many novel analogues, including SNH6, showed potent activity at decreasing 59Fe uptake (Figure 2b), and thus, their potential for targeting cellular Fe loading in AD.
3.5. Effect of the Fe complexes of nicotinoyl hydrazones on ascorbate oxidation
Plaque Fe accumulation, Fe dyshomeostasis, and the resultant‐associated ROS generation are a feature of AD (Greenough et al., 2013). An important property of chelators for the treatment of Fe loading is that they should remove Fe without forming redox‐active complexes. Hence, the ability of the Fe‐nicotinoyl hydrazone complexes to catalyse ascorbate oxidation via Fe‐mediated Fenton chemistry was examined (Richardson et al., 2006). The well‐known, redox‐active Fe complexes of EDTA and Dp44mT were positive controls, while the redox‐inactive desferrioxamine‐Fe(III) complex was a negative control (Richardson et al., 2006).
Dp44mT‐Fe and EDTA‐Fe markedly accelerated ascorbate oxidation, while the redox‐inactive desferrioxamine‐Fe complex decreased ascorbate oxidation (Figure 3a). All hydrazone‐derived Fe complexes, except that of 8‐OH‐QNH, did not show pro‐oxidative activity (Figure 3a). Fe complexes of QNH, PNH, SNH1, SNH4, SNH7, SNH9, AcNH1, and InNH1 inhibited ascorbate oxidation, while the remaining Fe‐hydrazone complexes had no effect. Thus, the Fe‐hydrazone complexes do not induce ROS and have appropriate chelation properties for AD treatment.
Figure 3.
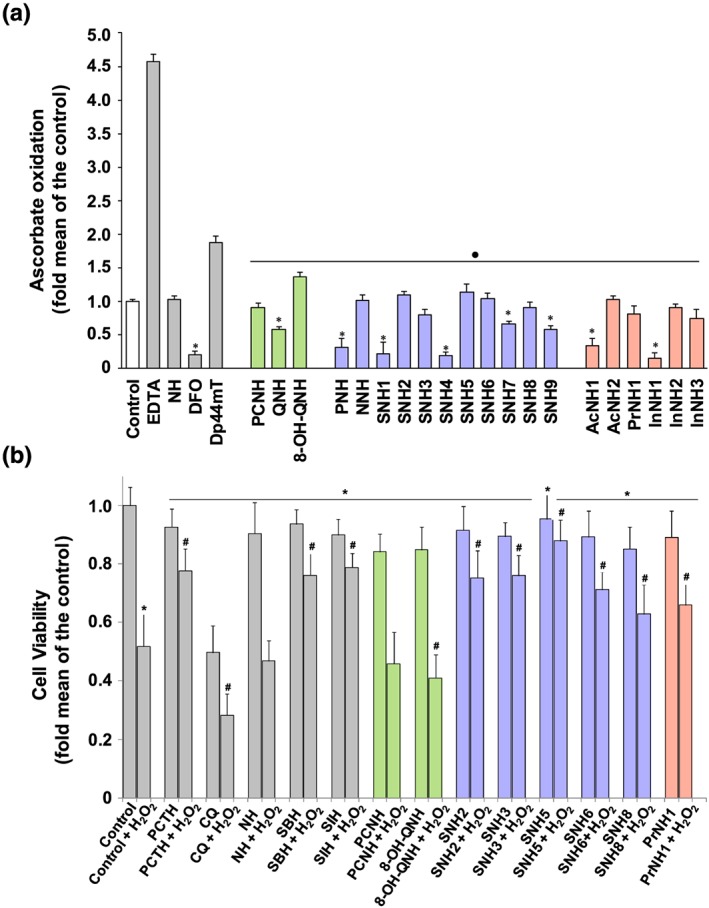
(a) The effect of the Fe complexes of nicotinoyl hydrazones on ascorbate oxidation. Chelators were incubated at room temperature with FeCl3 (10 μM) at an iron‐binding equivalent of 1 and sodium ascorbate (100 μM) in phosphate buffer (pH 7.4; 500‐μM sodium citrate). The oxidation of ascorbate by Fe in the presence and absence of the chelators was monitored by examining the absorbance at 265 nm, which was recorded at 10 and 40 min using a UV–Vis spectrophometer and the difference between the time points calculated. The well‐characterised ligands, desferrioxamine (DFO) , EDTA, and Dp44mT, were included as relevant controls for comparison. The results are presented as mean ± SD (N = 9 biological replicates). *P < .05, significantly different from the control. ● P < .05, significantly different from EDTA. (b) The selected nicotinoyl hydrazones protect SK‐N‐MC cells from hydrogen peroxide‐mediated cytotoxicity. Cells were pre‐incubated with the novel hydrazones or with the controls, PCTH, clioquinol (CQ), NH, SBH, or SIH, at a concentration of 10 μM in serum‐free medium for 2 hr/37°C. The medium was then removed and replenished with fresh, serum‐free medium alone, or with this medium containing H2O2 (150 μM) for 24 hr/37°C. Cell viability was measured using the MTT assay and the results are presented as mean ± SD (N = 12 biological replicates) as a percentage of the untreated control. *P < .05, significantly different from control. # P < .05, significantly different from control cells incubated with H2O2 [Colour figure can be viewed at http://wileyonlinelibrary.com]
3.6. Effect of nicotinoyl hydrazones on hydrogen peroxide‐induced cytotoxicity
As metal‐induced oxidative stress is a factor in AD (Greenough et al., 2013), the ability of the novel agents to protect SK‐N‐MC cells from H2O2‐mediated cytotoxicity was examined (Lim et al., 2008). Representative nicotinoyl hydrazones from each subset (i.e., ketone vs. aldehyde and ONO vs. NNO donor atom set) that showed low cytotoxicity (Table 1), namely, PCNH, 8‐OH‐QNH, SNH2, SNH3, SNH5, SNH6, SNH8, and PrNH1, were selectively investigated as promising agents to examine structure–activity relationships in all further studies.
Control cells incubated with H2O2 showed a distinct decrease in viability (Figure 3b). The control hydrazones, PCTH, SBH, and SIH, inhibited H2O2‐mediated cytotoxicity. clioquinol showed cytotoxic effects alone and increased H2O2‐mediated cytotoxicity, while NH could not rescue cells from H2O2‐mediated cytotoxicity (Figure 3b).
The nicotinoyl hydrazones alone showed minimal effects on viability (Figure 3b). However, in the presence of H2O2, agents utilising the NNO donor set, which showed poor iron release (Figure 2a), could not rescue cells from H2O2‐mediated cytotoxicity, while hydrazones utilising the ONO donor set (e.g., SNH6), which mediated high iron mobilisation (Figure 2a), protected cells from H2O2‐induced cytotoxicity, highlighting their potential for AD treatment.
3.7. Effect of nicotinoyl hydrazones on intracellular NAD+/NADH ratios
The NAD+/NADH ratio is an important measure of redox state, with higher ratios suggestive of improved metabolic function (Verdin, 2015). Primary human astrocytes were selected as an ideal brain cell model to investigate the potential of the nicotinoyl hydrazones to increase intracellular NAD+ (Bustamante et al., 2018). Astrocytes were utilised considering their important role in neuronal and synaptic support and evidence of their involvement in AD pathogenesis, suggesting their contribution to (a) plaque formation by secreting considerable levels of Aβ1–42; (b) oxidative stress via increased ROS production; and (c) mediating altered Ca2+ signalling in neurons (Oksanen et al., 2017; Oyabu et al., 2019). The de novo NAD+ synthesis pathway and the NAD+ salvage pathway, which resynthesises NAD+ from nicotinamide (NAM), are present in these cells (Harlan et al., 2016).
Astrocytes were incubated with the NAD+ precursors, nicotinic acid or nicotinamide as controls, desferrioxamine, or selected hydrazones, PCNH, 8‐OH‐QNH, SNH2, SNH6, and PrNH1 (0–10 μM) for 24 hr/37°C. Intracellular NAD+ (Figure 4a) and NADH (Figure 4b) were measured and the NAD+/NADH ratio calculated (Figure 4c). Nicotinamide increased intracellular NAD+ to a greater extent than nicotinic acid (Figure 4a). Desferrioxamine did not markedly alter NAD+, indicating that Fe chelation did not affect NAD+ (Figure 4a). PCNH and 8‐OH‐QNH slightly increased NAD+, while SNH2, SNH6, and PrNH1 mediated a marked, dose‐dependent increase in NAD+ (Figure 4a). SNH6 was the most effective at increasing NAD+, being more effective than nicotinic acid or nicotinamide at ≥500 nM (Figure 4a).
Figure 4.
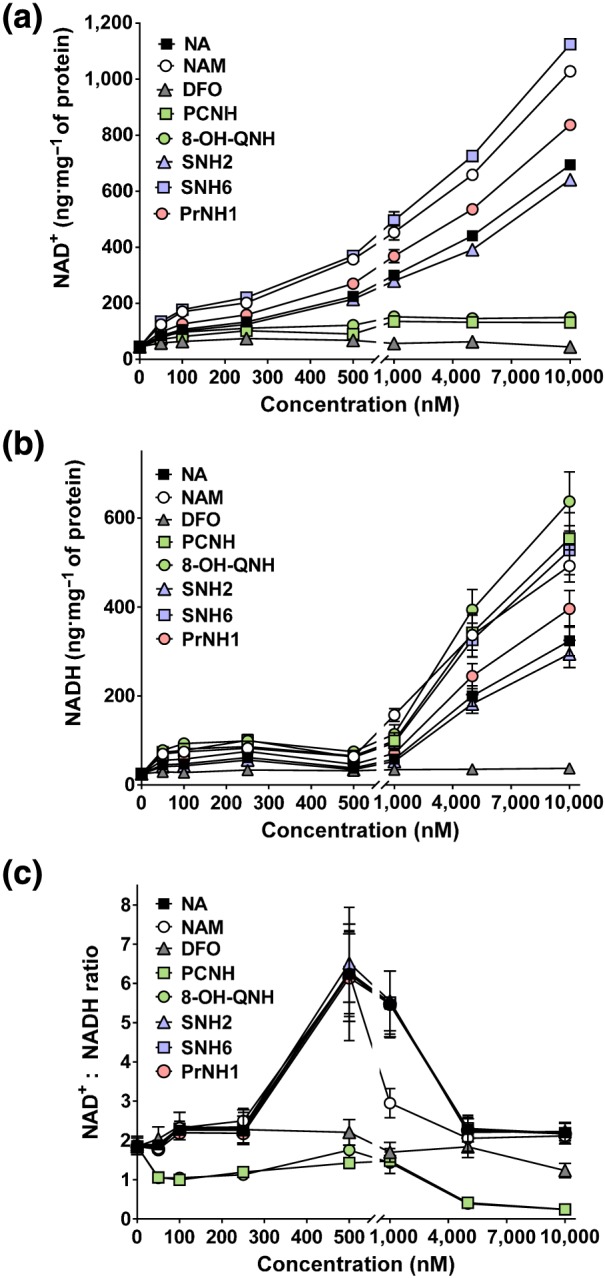
The effect of increasing concentrations of the multifunctional agents on intracellular: (a) NAD+ and (b) NADH levels and (c) the ratio between NAD+ to NADH in primary cultures of human astrocytes as determined by LC‐MS. Human astrocytes were incubated with the agents (0–10 μM) for 24 hr/37°C, and intracellular NAD+ and NADH concentrations were then measured. The results are presented as mean ± SEM (N = 5 biological replicates). DFO, desferrioxamine; NA, nicotinic acid; NAM, nicotinamide. [Colour figure can be viewed at http://wileyonlinelibrary.com]
Except for desferrioxamine, which did not alter NADH, all compounds increased NADH at >1 μM (Figure 4b). This suggested that, while these compounds enhance NAD+, more NAD+ is available than is required under physiological “stress‐free” conditions and is reduced to NADH.
Desferrioxamine, PCNH, and 8‐OH‐QNH decreased the NAD+/NADH ratio, whereas SNH2, SNH6, and PrNH1 increased the NAD+/NADH ratio and were comparable to nicotinic acid and nicotinamide (Figure 4c). The peak increase in the NAD+/NADH ratio occurred at 500 nM, after which the ratio declined. This response may be due to an imbalance in NADH, redirecting NAD+ towards NADH at concentrations >500 nM. Given the increase in NADH, these agents should be used at concentrations ≤500 nM.
3.8. Effect of nicotinoyl hydrazones on H2O2‐induced nuclear NAD+ consumption
The bioavailability of NAD+ is influenced by major NAD+‐consuming enzymes, such as PARPs, which become activated to repair oxidative stress‐mediated, single‐strand, DNA breaks (Schreiber et al., 2006). As the hydrazones increased the NAD+/NADH ratio maximally at 500 nM (Figure 4c), we examined their ability to modulate nuclear NAD+ consumption (Figure 5a). This was done as a measure of PARP activity in primary astrocytes exposed to H2O2, as PARPs are the predominant NAD+‐consuming enzymes upon DNA damage (Canto, Menzies, & Auwerx, 2015; Putt et al., 2005). These cells were incubated with (a) the NAD+ precursors, nicotinic acid or nicotinamide; (b) the control chelators, desferrioxamine, clioquinol, SBH, or SIH; or (c) selected hydrazones (PCNH, 8‐OH‐QNH, SNH2, SNH6, and PrNH1) at 500 nM for 2 hr/37°C. The medium was removed, and the cells incubated in the presence/absence of H2O2 (150 μM) for 24 hr/37°C before assessing nuclear NAD+ consumption.
Figure 5.
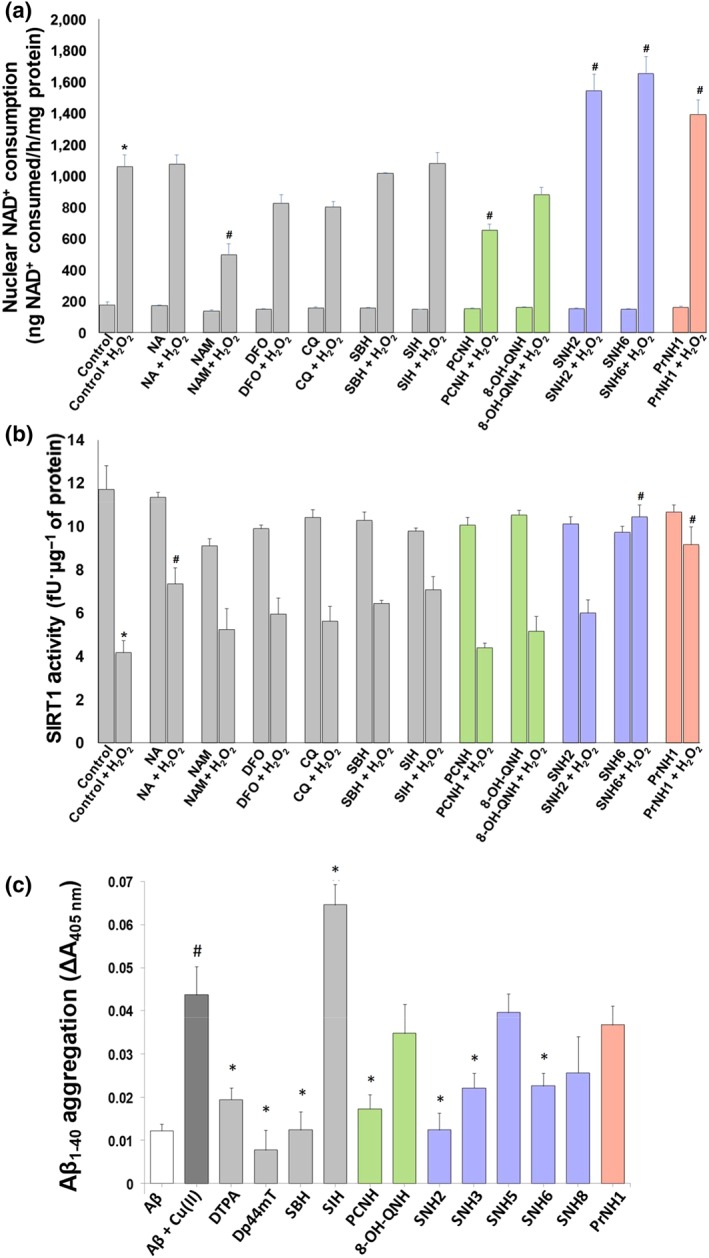
The effect of the novel nicotinoyl hydrazones on (a) NAD+‐consumption activity and (b) SIRT1 activity in the presence and absence of H2O2 in primary cultures of human astrocytes. The cells were incubated with the agents (500 nM) for 2 hr/37°C. The medium was then removed, and the cells incubated in the presence/absence of H2O2 (150 μM) for 24 hr/37°C before assessing: (a) NAD+ consumption, or (b) SIRT1 activity. The results are presented as mean ± SEM (N = 5 biological replicates). *P < .05, significantly different from control; # P < .05, significantly different from control + H2O2. (c) The effect of the selected hydrazones on inhibition of CuII‐mediated Aβ1–40 aggregation. The aggregation of Aβ1–40 was measured using a well‐characterised turbidity assay at 405 nm following a 2 hr/37°C incubation of Aβ1–40 (25 μM) with CuII (25 μM) in the presence/absence of the positive controls (DTPA or Dp44mT), or selected hydrazones (25 μM) in HEPES buffer (20 mM, 150‐mM NaCl, pH 6.6). Results are expressed as mean ± SEM (N = 12 biological replicates). *P < .05, significantly different from Aβ1–40 + CuII; # P < .05, significantly different from Aβ1–40. CQ, clioquinol; DFO, desferrioxamine; NA, nicotinic acid; NAM, nicotinamide. [Colour figure can be viewed at http://wileyonlinelibrary.com]
Control cells incubated with H2O2 showed a 6.0‐fold increase in nuclear NAD+‐consumption activity (Figure 5a). nicotinic acid did not affect nuclear NAD+ consumption in the presence/absence of H2O2, while nicotinamide lowered this after H2O2 treatment, as nicotinamide, an endogenous PARP inhibitor (Canto et al., 2015). desferrioxamine, clioquinol, SBH, and SIH did not alter nuclear NAD+ consumption in the presence/absence of H2O2. PCNH decreased nuclear NAD+ consumption in the presence of H2O2, while 8‐OH‐QNH did not alter activity in the presence/absence of H2O2 (Figure 5a). SNH2, SNH6, and PrNH1, which elevated cellular NAD+ (Figure 4a), markedly increased nuclear NAD+ consumption following H2O2 exposure (Figure 5a). This suggested NAD+ donation by these agents promote this metabolic process.
3.9. Effect of nicotinoyl hydrazones on sirtuin‐1 activity
NAD+ is an essential substrate for NAD‐dependent deacetylases, namely, sirtuins (Braidy, Guillemin, Mansour, et al., 2011). Gene silencing by these enzymes is proportional to longer lifespan (Yao, Yang, & Zhu, 2014). Considering that nicotinoyl hydrazones augment cellular NAD+, we examined their effects on SIRT1 activity in astrocytes exposed to H2O2 (Figure 5b). Astrocytes were pre‐incubated with nicotinic acid , nicotinamide, desferrioxamine, clioquinol, SBH, SIH, or the selected nicotinoyl hydrazones, PCNH, 8‐OH‐QNH, SNH2, SNH6, and PrNH1 (500 nM), for 2 hr/37°C. The medium was then removed, and the cells incubated in the presence/absence of H2O2 (150 μM) for 24 hr/37°C before assessing SIRT1 activity.
Exposure of astrocytes to H2O2 lowered SIRT1 activity (Figure 5b). Pre‐incubation with nicotinic acid increased SIRT1 activity in the presence of H2O2. Pretreatment with NAM in the presence/absence of H2O2 lowered SIRT1 activity (Figure 5b), as nicotinamide is an endogenous inhibitor of SIRT1. SIRT1 activity was not altered upon pre‐incubation with desferrioxamine, clioquinol, SBH, and SIH, and then exposure to H2O2. No benefits to SIRT1 activity were demonstrated with PCNH and 8‐OH‐QNH (Figure 5b), which may be due to their limited ability to increase NAD+ (Figure 4a).
Although SNH2 increased NAD+ (Figure 4a) and PARP activity (Figure 5a), it was not able to rescue SIRT1 activity in the presence of H2O2 (Figure 5b). However, SNH6 and PrNH1, which were the most effective hydrazones at increasing NAD+ (Figure 4a), also rescued SIRT1 + H2O2 versus the control + H2O2 (Figure 5b). Given that NAD+ is a substrate for SIRT1, increasing NAD+ availability by using SNH6 and PrNH1 could also rescue SIRT1 activity after H2O2 challenge. Such agents may prove beneficial for AD treatment, where there is decreased NAD+ and NAD‐dependent processes.
3.10. Effect of nicotinoyl hydrazones in inhibiting CuII‐mediated Aβ1–40 aggregation
Aβ aggregation is a major characteristic of AD. As CuII promotes Aβ aggregation, chelation therapy could be utilised to inhibit aggregation (Greenough et al., 2013). We examined the effect of the selected nicotinoyl hydrazones, PCNH, 8‐OH‐QNH, SNH2, SNH3, SNH5, SNH6, SNH8, and PrNH1, on the inhibition of CuII‐mediated Aβ1–40 aggregation (Gomes et al., 2014; Figure 5c). The well‐characterised chelators, DTPA, Dp44mT, SBH, and SIH, were controls. The addition of CuII to Aβ1–40 enhanced Aβ1–40 aggregation (Figure 5c). In contrast, DTPA or Dp44mT markedly inhibited CuII‐mediated Aβ1–40 aggregation, probably by trans‐chelation of CuII from Aβ1–40. PCNH, SNH2, SNH3, and SNH6 also inhibited CuII‐mediated Aβ1–40 aggregation (Figure 5c).
3.11. BBB permeation
To examine if the selected nicotinoyl hydrazones from the studies above cross the BBB, we used the revised Lipinski's rules for CNS penetration (Pajouhesh & Lenz, 2005), which takes into account: (a) MW; (b) log P; and (c) number of hydrogen bond donors and acceptors (Table 2). Examining these factors suggested that 8‐OH‐QNH, SNH2, SNH3, SNH6, SNH8, and PrNH1 can permeate the CNS. Further, the topological polar surface area and logBB of all of the selected compounds were within 90 Å2 and >−1, respectively (Clark, 1999), suggesting BBB permeability.
Table 2.
Physicochemical properties and effective permeability coefficients (P e, 10−6 cm·s−1) determined by PAMPA‐BBB for selected hydrazones (N = 12 biological replicates)
| Compound | LogP a | MWa | HBAb | HBDb | TPSAa | cLogPa | LogBBc | P e (10−6 cm·s−1) | CNS permeation |
|---|---|---|---|---|---|---|---|---|---|
| 8‐OH‐QNH | 2.14 | 292.3 | 6 | 2 | 86.41 | 1.79 | −0.87 | 2.03 ± 0.51 | CNS− |
|
SNH2 SNH3 SNH6 SNH8 |
2.20 2.47 1.51 2.62 |
275.7 320.2 271.3 338.1 |
5 5 6 5 |
2 2 2 2 |
74.05 74.05 83.28 74.05 |
2.56 2.76 1.67 3.02 |
−0.57 −0.54 −0.84 −0.50 |
3.83 ± 0.51 3.13 ± 0.57 3.34 ± 0.21 3.55 ± 0.54 |
CNS+/− CNS+/− CNS+/− CNS+/− |
| PrNH1 | 2.69 | 348.2 | 5 | 2 | 74.05 | 4.69 | −0.24 | 5.95 ± 0.87 | CNS+ |
| Requiredd | ≤5 | ≤400 | ≤7 | ≤3 | <90 | 2–5 | >−1 | >5.5 | CNS+ |
The color coding reflects the category of the compounds illustrated in Figure 1.
Calculated using ChemBioDraw Ultra14.0.
Calculated using Cheminformatics (http://www.molinspiration.com/).
LogBB = −0.0148 × TPSA +0.152 × cLogP +0.139 (Clark, 1999).
The ability of selected nicotinoyl hydrazones to cross the BBB was assessed by PAMPA‐BBB, and their effective permeability (P e) coefficients were determined (Table 2). The assay was validated using five well‐characterised drugs (Figure S2; Table S1). Using set thresholds (Di et al., 2003), 8‐OH‐QNH demonstrated low CNS permeability, whereas SNH2, SNH3, SNH6, SNH8, and PrNH1 have the potential to cross the BBB (Table 2).
3.12. SNH6 decreases amyloidogenic APP processing
Aβ generation involves cleavage of APP by the β‐site APP‐cleavage enzyme‐1 (https://www.guidetopharmacology.org/GRAC/ObjectDisplayForward?objectId=2330; Vassar et al., 1999), resulting in soluble APPβ (sAPPβ) and the C‐terminal fragment β (CTFβ; Figure 6a; Chow, Mattson, Wong, & Gleichmann, 2010). Subsequent cleavage of CTFβ by γ‐secretase results in Aβ release. Non‐amyloidogenic APP processing is mediated by α‐secretase, which cleaves APP within the Aβ domain, leading to soluble APPα (sAPPα) and C‐terminal fragment α (CTFα), preventing Aβ generation (Figure 6a; Chow et al., 2010).
Figure 6.
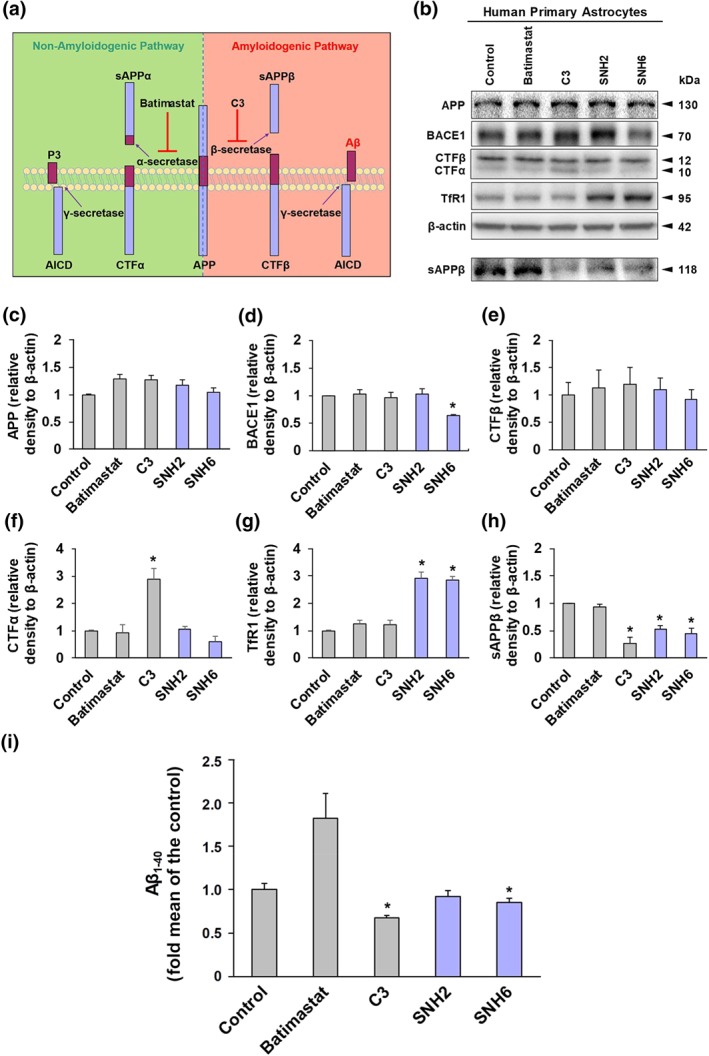
The effect of SNH2 and SNH6 on the protein levels of APP, BACE1, CTFα, CTFβ, TfR1, and sAPPβ in human primary astrocyte cultures, as determined by western blotting. (a) Diagram of the non‐amyloidogenic and amyloidogenic processing of APP. The non‐amyloidogenic processing of APP is mediated by α‐secretase, which cleaves APP within the Aβ domain and leads to soluble APPα (sAPPα) and the C‐terminal fragment α (CTFα). Subsequent cleavage of CTFα by γ‐secretase leads to the formation of the p3 peptide and the APP intracellular domain (AICD). The amyloidogenic processing of APP, mediated by β‐secretase, leads to the generation of soluble APPβ (sAPPβ) and the C‐terminal fragment β (CTFβ). Subsequent cleavage of CTFβ by γ‐secretase leads to the release of Aβ and AICD formation. (b) Human primary astrocyte cells were incubated with media containing batimastat (5 μM), C3 (5 μM), SNH2, or SNH6 (25 μM) for 24 hr at 37°C. Cell lysates and media were collected and used for western blot analysis. Densitometry of (c) APP; (d) BACE1; (e) CTFβ; (f) CTFα; (g) TfR1 (control for cellular Fe depletion); and (h) sAPPβ. Results shown are mean ± SD (N = 5 biological replicates). *P < .05, significantly different from control. (i) The effect of SNH2 and SNH6 on Aβ1–40 levels. Aβ1–40 release in the culture medium after a 24 hr/37°C incubation of human primary astrocytes with batimastat (5 μM), C3 (5 μM), SNH2 (25 μM), or SNH6 (25 μM) was quantified using an ELISA sandwich kit. Results shown are mean ± SD (N = 6 biological replicates). *P < .05, significantly different from control [Colour figure can be viewed at http://wileyonlinelibrary.com]
From the cumulative results above, SNH2, SNH6, and PrNH1 demonstrated the most broad, multifunctional activity. However, of these three, PrNH1 demonstrated threefold to fourfold greater cytotoxicity (Table 1) and was not further assessed. Considering this, we examined the effect of the promising agents, SNH2 and SNH6, on APP processing by western blotting to assess APP, BACE1, CTFα, CTFβ, and sAPPβ expression. Expression of the Fe‐regulated protein, transferrin receptor 1 (TfR1), was examined as a positive control to confirm Fe chelation by SNH2 and SNH6. Astrocytes were incubated with SNH2 or SNH6 (25 μM), for 24 hr/37°C and compared to the α‐secretase inhibitor, batimastat (5 μM; Parvathy, Hussain, Karran, Turner, & Hooper, 1998), or the β‐secretase inhibitor, C3 (5 μM; Ben Halima et al., 2016; Figure 6a).
No change in APP expression was observed with any agent (Figure 6b,c), despite the fact that its respective mRNA has an iron‐responsive element (IRE) in its 5′ untranslated region (Rogers et al., 2002). However, this IRE is an atypical type II IRE, that is different to the typical IREs found within the TfR1 mRNA, which did respond to chelation (Figure 6b,g). This suggests a differential response that could be related to the different IREs, which may be dependent on chelator dose or other factors.
Although batimastat, C3, and SHN2 did not significantly alter BACE1, SNH6 markedly decreased BACE1 expression (Figure 6b,d), suggesting that SNH6 may reduce Aβ levels as BACE1 is essential for Aβ formation (Figure 6a; Vassar et al., 1999). No change in CTFα and CTFβ was observed (Figure 6b,e,f), except for an increase in CTFα upon C3 incubation (Figure 6b,f), suggesting increased non‐amyloidogenic APP processing upon β‐secretase inhibition. A compensatory increase in TfR1 occurred upon incubation with SNH2 or SNH6 (Figure 6b,g), confirming their Fe chelation efficacy and effects on cellular Fe‐transport machinery (Richardson & Ponka, 1997). The α‐secretase inhibitor, batimastat, had no effect on sAPPβ, while the β‐secretase inhibitor, C3, decreased sAPPβ (Figure 6b,h). SNH2 and SNH6 markedly decreased sAPPβ (Figure 6b,h), suggesting reduced amyloidogenic APP processing.
3.13. Effect of SNH2 and SNH6 on Aβ1–40
Considering that SNH6 decreased sAPPβ (Figure 6b,h) and BACE1 (Figure 6b,d), we examined the ability of these agents to affect Aβ1–40. Astrocytes were incubated with batimastat (5 μM), C3 (5 μM), SNH2 (25 μM), or SNH6 (25 μM), for 24 hr/37°C and Aβ1–40 in the medium measured by ELISA (Yu et al., 2014).
Batimastat increased Aβ1–40 generation to 183% of the control (Figure 6i), suggesting that inhibition of non‐amyloidogenic APP processing led to alternative metabolism via the amyloidogenic pathway. In contrast, C3 and SNH6 decreased Aβ1–40 (Figure 6i), indicating their potential to target Aβ loading in AD.
3.14. Effect of SNH6 on C. elegans lifespan
C. elegans is a nematode model for examining ageing due to its high reproducibility and short life cycle (Amrit et al., 2014). Resveratrol, a well‐known sirtuin activator, extends C. elegans lifespan at 100 μM (Wood et al., 2004). Considering the low cytotoxicity of SNH6 and its ability to increase NAD+/NADH ratios and promote SIRT1 activity, we examined its ability to extend C. elegans lifespan. Resveratrol was used as a positive control (Wood et al., 2004). The use of this lifespan model was important, as key targets of SNH6, namely, ability to increase NAD+/NADH ratios and promote SIRT1 activity, constitute important factors that are decreased upon ageing.
SNH6 had the same effect as resveratrol, substantially extending C. elegans median lifespan to 1.43‐fold mean of the control (Figure 7; Table 3). In contrast, SNH2 did not significantly alter lifespan (Figure 7). Considering its similar Fe chelation efficacy as SNH6 (Figure 2a,b), the inability of SNH2 to extend lifespan may be related to its inability to rescue SIRT1 activity (Figure 5b). To determine whether the increase in lifespan mediated by SNH6 was due, in part, to Fe chelation, we examined the effect of FeCl3 and the Fe (SNH6)2 complex, and no significant impact on lifespan was observed with these treatments (Figure 7). This suggested that SNH6‐mediated Fe depletion and its ability to rescue SIRT1 activity by NAD+ supplementation (Figure 5b) are required to extend C. elegans lifespan.
Figure 7.
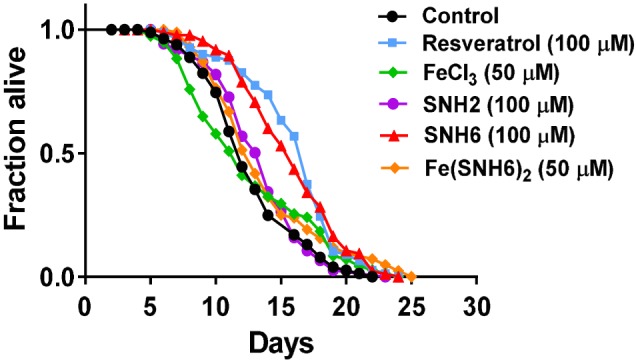
The effect of SNH6 on the extension of C. elegans lifespan. Kaplan–Meier survival curves of N2 C. elegans treated with resveratrol (100 μM), FeCl3 (50 μM), SNH2 (100 μM), SNH6 (100 μM), or Fe (SNH6)2 (50 μM). Results shown are from a typical experiment; see Table 3 for summary data. [Colour figure can be viewed at http://wileyonlinelibrary.com]
Table 3.
Representative C. elegans lifespan assay data upon treatment with resveratrol (100 μM), FeCl3 (50 μM), SNH6 (100 μM), or Fe (SNH6)2 (50 μM)
| Treatment | Experiment 1 | Experiment 2 | Experiment 3 | Total counted (dead/censored) | Mean (Day) | Fold mean of the control | |||
|---|---|---|---|---|---|---|---|---|---|
| Median (Day) | P valuea | Median (Day) | P valuea | Median (Day) | P valuea | ||||
| Control | 9.0 | — | 12.0 | — | 11.0 | — | 246/54 | 10.7 | 1.00 |
| Resveratrol | 15.0 | <0.05 | 17.0 | <0.05 | 14.0 | <0.05 | 251/49 | 15.3 | 1.43 |
| FeCl3 | 9.0 | >0.05 | 12.0 | >0.05 | 11.0 | >0.05 | 249/51 | 10.7 | 1.00 |
| SNH6 | 15.0 | <0.05 | 16.0 | <0.05 | 15.0 | <0.05 | 264/36 | 15.3 | 1.43 |
| Fe (SNH6)2 | 10.0 | >0.05 | 13.0 | >0.05 | 12.0 | >0.05 | 265/35 | 11.7 | 1.09 |
P<.05, significantly different from control; log‐rank (Mantel‐Cox) test.
4. DISCUSSION
We developed novel, multifunctional agents to target key neuropathological hallmarks of AD. For diseases with complex, multifaceted pathology, multifunctional agents demonstrate advantages relative to one‐target drugs (Kaur et al., 2019; Sang et al., 2019). One key aspect of the design of new drugs for AD is their bioavailability, including their cellular and BBB permeability. We have taken advantage of the relative lipophilicity of the nicotinoyl hydrazones and their known ability to effectively permeate biological membranes and act as lipophilic “Trojan Horse” delivery vehicles to gain cellular access, which upon hydrolysis in acidic lysosomes, liberate their active “cargo” (Ellis et al., 2014). It is well known that hydrazones and their structurally related derivatives remain stable at physiological pH (Richardson, Vitolo, Bakers, & Webb, 1989), demonstrate marked activity in vitro and in vivo (Kalinowski & Richardson, 2005), and show promising pharmacokinetic profiles (Bures et al., 2015; Sestak et al., 2015). Evidence for their effective bioavailability, cellular membrane permeability, and BBB permeation is provided by a combination of studies that include PAMPA‐BBB, 59Fe studies that demonstrate their ability to inhibit intracellular 59Fe uptake and mobilise intracellular 59Fe and their efficacy at increasing intracellular NAD+ levels.
The aldehyde‐derived hydrazone scaffold utilising the ONO donor set was a promising pharmacophore with low cytotoxicity to target oxidative stress and iron dyshomeostasis in AD. Our most promising agents do not induce oxidative stress as demonstrated by ascorbate oxidation studies and effectively rescued a H2O2 stress challenge. This is probably due to their pronounced activity at inhibiting iron uptake and mobilising cellular iron, which is a major inducer of oxidative stress and a pathogenic factor in AD (Greenough et al., 2013).
As copper can catalyse Aβ aggregation, it is notable that SNH2 and SNH6 inhibited CuII‐mediated Aβ aggregation (Figure 5c). SNH6 also decreased BACE1 expression (Figure 6b,d), the enzyme responsible for amyloidogenic APP processing that is over‐expressed in AD (Vassar et al., 1999), and resulted in decreased sAPPβ (Figure 6b,h) and Aβ1–40 (Figure 6i). These data highlight the potential of SNH6 to reduce Aβ generation in astrocytes. This is of clinical importance considering the emerging role of astrocytes in AD pathogenesis as recent evidence suggests that astrocytes secrete considerable Aβ (Oksanen et al., 2017). Thus, the ability of SNH6 to suppress Aβ production by astrocytes via decreasing BACE1 expression may reduce Aβ burden without complete ablation of BACE1 activity. This is important, when considering BACE1 as the target of a therapeutic strategy in AD, as the complete loss of BACE1 activity in BACE1‐deficient mice was associated with deleterious effects on synaptic plasticity at entorhinal‐dentate synapses (Vnencak et al., 2019) and on hippocampal neurogenesis (Carney, 2018). The authors of future preclinical trials with SNH6 will have to balance, while trying to determine the optimal therapeutic dose interval, the maximisation of the iron chelating, NAD+ donating, and other advantageous effects of this compound with the need to preserve its ability to decrease BACE1 expression, without attaining complete BACE1 ablation.
The ability of the hydrazones to promote SIRT1 activity (Figure 5b) under oxidative stress was associated with their efficacy at enhancing NAD+ (Figure 4a). Considering perturbations of astrocytic functions impact neuronal homeostasis and AD (Abeti, Abramov, & Duchen, 2011), the ability of SNH6 to promote NAD‐dependent processes, including SIRT1 activity, may contribute to astrocyte‐mediated, neuronal protection in AD. This is a significant clinical aspect as the interplay between astrocytes and neurons contributes to aberrant synaptic transmission and AD progression (Oyabu et al., 2019).
In view of the benefits of sirtuin activators during ageing (Bonkowski & Sinclair, 2016), we demonstrated that SNH6 was as effective as resveratrol in extending median C. elegans lifespan, although SNH2 did not (Figure 7; Table 3). Considering their structural similarity and comparable Fe chelation efficacy (Figure 2a,b), other factors may play roles in their differing effects on lifespan. Importantly, SNH6 was more effective than SNH2 at increasing NAD+ (Figure 4a) and SIRT1 activity (Figure 5b), suggesting enhanced NAD+ supplementation and SIRT1 activity prolonged C. elegans lifespan.
5. CONCLUSIONS
This investigation demonstrates the broad activity of nicotinoyl hydrazones, particularly SNH6, to act as multifunctional therapeutics for AD, which is highly complex. Our studies revealed that SNH6 displayed promising multi‐targeted activity, namely, (a) low cytotoxicity; (b) high iron‐chelation efficacy; (c) alleviation of oxidative stress; (d) inhibition of CuII‐mediated Aβ1–40 aggregation; (e) reduced BACE1, sAPPβ, and Aβ1–40 levels; (f) enhanced NAD+/NADH ratios and NAD‐dependent processes, promoting increased lifespan; and (g) suitable properties for BBB permeation. This highlights SNH6 as a potential therapeutic targeting multiple AD hallmarks. Future preclinical studies are required to elucidate their pharmacokinetic properties.
AUTHOR CONTRIBUTIONS
Z.W., D.P., N.B., N.H.S., S.E., and M.L.H.H. performed the experiments, analysed data, prepared figures, and/or contributed to writing the manuscript; D.R.R. conceived the study, designed experiments, obtained research funding, and wrote the manuscript.
CONFLICT OF INTEREST
D.P. and D.R.R. are co‐inventors of the following patent that include these agents, namely, PCT/AU2017/050634.
DECLARATION OF TRANSPARENCY AND SCIENTIFIC RIGOUR
This Declaration acknowledges that this paper adheres to the principles for transparent reporting and scientific rigour of preclinical research as stated in the BJP guidelines for https://bpspubs.onlinelibrary.wiley.com/doi/full/10.1111/bph.14207, and https://bpspubs.onlinelibrary.wiley.com/doi/full/10.1111/bph.14208, and as recommended by funding agencies, publishers and other organisations engaged with supporting research.
Supporting information
Figure S1. ORTEP diagrams of the single crystal X‐ray structures of (A) SNH2 and (B) SNH6 drawn at 50% probability level.
Figure S2. The linear correlation between experimental and reported permeability values of five commercial drugs, namely Theophylline, Verapamil, Progesterone, Chlorpromazine, and Donepezil, obtained by the PAMPA‐BBB assay.
Figure S3. Individual standard curves for (A) NAD+ and (B) NADH using LC–MS.
Table S1. Prediction of CNS penetration based on ranges of permeability values of PAMPA‐BBB assay determined in Figure S2 and as suggested by Di et al. (Pe, 10‐6 cm.s‐1; Di et al., 2003).
Table S2. Retention times and MS/MS transitions used for NAD+ and NADH.
ACKNOWLEDGEMENTS
This work was supported by a Project Grant from the National Health and Medical Research Council (NHMRC) Australia (1021607) and an NHMRC Senior Principal Research Fellowship to D.R.R. (1062607). D.P. thanks the Sydney Medical School for an Early Career Research Grant. N.B. is the recipient of the Australian Research Council Discovery Early Career Research Award at the University of New South Wales (DE170100628). D.R.R. appreciate the award of a Judith Jane Mason and Harold Stannett Williams Memorial Foundation National Medical Program Grant.
Wu Z, Palanimuthu D, Braidy N, et al. Novel multifunctional iron chelators of the aroyl nicotinoyl hydrazone class that markedly enhance cellular NAD+/NADH ratios. Br J Pharmacol. 2020;177:1967–1987. 10.1111/bph.14963
REFERENCES
- Abeti, R. , Abramov, A. Y. , & Duchen, M. R. (2011). β‐amyloid activates PARP causing astrocytic metabolic failure and neuronal death. Brain, 134(6), 1658–1672. [DOI] [PubMed] [Google Scholar]
- Adlard, P. A. , & Bush, A. I. (2018). Metals and Alzheimer's disease: How far have we come in the clinic? Journal of Alzheimer's Disease, 62(3), 1369–1379. 10.3233/JAD-170662 [DOI] [PMC free article] [PubMed] [Google Scholar]
- Alexander, S. P. H. , Fabbro, D. , Kelly, E. , Mathie, A. , Peters, J. A. , Veale, E. L. , … Collaborators, C. G. T. P. (2019). The Concise Guide to PHARMACOLOGY 2019/20: Enzymes. British Journal of Pharmacology, 176, S297–S396. [DOI] [PMC free article] [PubMed] [Google Scholar]
- Alexander, S. P. H. , Roberts, R. E. , Broughton, B. R. S. , Sobey, C. G. , George, C. H. , Stanford, S. C. , … Ahluwalia, A. (2018). Goals and practicalities of immunoblotting and immunohistochemistry: A guide for submission to the British Journal of Pharmacology. British Journal of Pharmacology, 175(3), 407–411. 10.1111/bph.14112 [DOI] [PMC free article] [PubMed] [Google Scholar]
- Amrit, F. R. G. , Ratnappan, R. , Keith, S. A. , & Ghazi, A. (2014). The C. elegans lifespan assay toolkit. Methods, 68(3), 465–475. 10.1016/j.ymeth.2014.04.002 [DOI] [PubMed] [Google Scholar]
- Ben Halima, S. , Mishra, S. , Raja, K. M. P. , Willem, M. , Baici, A. , Simons, K. , … Rajendran, L. (2016). Specific inhibition of β‐secretase processing of the Alzheimer disease amyloid precursor protein. Cell Reports, 14(9), 2127–2141. 10.1016/j.celrep.2016.01.076 [DOI] [PubMed] [Google Scholar]
- Bonkowski, M. S. , & Sinclair, D. A. (2016). Slowing ageing by design: the rise of NAD+ and sirtuin‐activating compounds. Nature Reviews Molecular Cell Biology, 17(11), 679–690. 10.1038/nrm.2016.93 [DOI] [PMC free article] [PubMed] [Google Scholar]
- Braidy, N. , Grant, R. , & Sachdev, P. S. (2018). Nicotinamide adenine dinucleotide and its related precursors for the treatment of Alzheimer's disease. Current Opinion in Psychiatry, 31(2), 160–166. 10.1097/YCO.0000000000000394 [DOI] [PubMed] [Google Scholar]
- Braidy, N. , Guillemin, G. J. , & Grant, R. (2011). Effects of kynurenine pathway inhibition on NAD+ metabolism and cell viability in human primary astrocytes and neurons. International Journal of Tryptophan Research, 4, 29–37. 10.4137/IJTR.S7052 [DOI] [PMC free article] [PubMed] [Google Scholar]
- Braidy, N. , Guillemin, G. J. , Mansour, H. , Chan‐Ling, T. , Poljak, A. , & Grant, R. (2011). Age related changes in NAD+ metabolism oxidative stress and Sirt1 activity in wistar rats. PLoS ONE, 6(4), e19194 10.1371/journal.pone.0019194 [DOI] [PMC free article] [PubMed] [Google Scholar] [Retracted]
- Braidy, N. , Poljak, A. , Grant, R. , Jayasena, T. , Mansour, H. , Chan‐Ling, T. , … Sachdev, P. (2014). Mapping NAD+ metabolism in the brain of ageing Wistar rats: Potential targets for influencing brain senescence. Biogerontology, 15(2), 177–198. 10.1007/s10522-013-9489-5 [DOI] [PubMed] [Google Scholar]
- Brenner, S. (1974). The genetics of Caenorhabditis elegans. Genetics, 77(1), 71–94. [DOI] [PMC free article] [PubMed] [Google Scholar]
- Bures, J. , Jansova, H. , Stariat, J. , Filipsky, T. , Mladenka, P. , Simunek, T. , … Kovarikova, P. (2015). LC‐UV/MS methods for the analysis of prochelator‐boronyl salicylaldehyde isonicotinoyl hydrazone (BSIH) and its active chelator salicylaldehyde isonicotinoyl hydrazone (SIH). Journal of Pharmaceutical and Biomedical Analysis, 105, 55–63. 10.1016/j.jpba.2014.11.044 [DOI] [PMC free article] [PubMed] [Google Scholar]
- Bustamante, S. , Jayasena, T. , Richani, A. , Gilchrist, R. B. , Wu, L. E. , Sinclair, D. A. , … Braidy, N. (2018). Quantifying the cellular NAD+ metabolome using a tandem liquid chromatography mass spectrometry approach. Metabolomics, 14(1), 15 10.1007/s11306-017-1310-z [DOI] [PMC free article] [PubMed] [Google Scholar]
- Canto, C. , Menzies, K. J. , & Auwerx, J. (2015). NAD+ metabolism and the control of energy homeostasis: A balancing act between mitochondria and the nucleus. Cell Metabolism, 22(1), 31–53. 10.1016/j.cmet.2015.05.023 [DOI] [PMC free article] [PubMed] [Google Scholar]
- Carney, R. S. E. (2018). Partial, rather than full, BACE1 inhibition may be a better therapeutic strategy for Alzheimer's disease due to effects of complete loss of BACE1 activity on adult hippocampal neurogenesis. eNeuro, 5(5), e0384. [DOI] [PMC free article] [PubMed] [Google Scholar]
- Chow, V. W. , Mattson, M. P. , Wong, P. C. , & Gleichmann, M. (2010). An overview of APP processing enzymes and products. Neuromolecular Medicine, 12(1), 1–12. 10.1007/s12017-009-8104-z [DOI] [PMC free article] [PubMed] [Google Scholar]
- Clark, D. E. (1999). Rapid calculation of polar molecular surface area and its application to the prediction of transport phenomena. 2. Prediction of blood‐brain barrier penetration. Journal of Pharmaceutical Sciences, 88(8), 815–821. 10.1021/js980402t [DOI] [PubMed] [Google Scholar]
- Clement, J. , Wong, M. , Poljak, A. , Sachdev, P. , & Braidy, N. (2018). The plasma NAD+ metabolome is dysregulated in “normal” aging. Rejuvenation Research, 22(2), 121–130. 10.1089/rej.2018.2077 [DOI] [PMC free article] [PubMed] [Google Scholar]
- Crapper McLachlan, D. R. , Dalton, A. J. , Kruck, T. P. , Bell, M. Y. , Smith, W. L. , Kalow, W. , & Andrews, D. F. (1991). Intramuscular desferrioxamine in patients with Alzheimer's disease. Lancet, 337(8753), 1304–1308. 10.1016/0140-6736(91)92978-b [DOI] [PubMed] [Google Scholar]
- Curtis, M. J. , Alexander, S. , Cirino, G. , Docherty, J. R. , George, C. H. , Giembycz, M. A. , … Ahluwalia, A. (2018). Experimental design and analysis and their reporting II: Updated and simplified guidance for authors and peer reviewers. British Journal of Pharmacology, 175(7), 987–993. 10.1111/bph.14153 [DOI] [PMC free article] [PubMed] [Google Scholar]
- Di, L. , Kerns, E. H. , Fan, K. , McConnell, O. J. , & Carter, G. T. (2003). High throughput artificial membrane permeability assay for blood‐brain barrier. European Journal of Medicinal Chemistry, 38(3), 223–232. 10.1016/s0223-5234(03)00012-6 [DOI] [PubMed] [Google Scholar]
- Ellis, S. , Kalinowski, D. S. , Leotta, L. , Huang, M. L. H. , Jelfs, P. , Sintchenko, V. , … Triccas, J. A. (2014). Potent antimycobacterial activity of the pyridoxal isonicotinoyl hydrazone analog 2‐pyridylcarboxaldehyde isonicotinoyl hydrazone: A lipophilic transport vehicle for isonicotinic acid hydrazide. Molecular Pharmacology, 85(2), 269–278. 10.1124/mol.113.090357 [DOI] [PMC free article] [PubMed] [Google Scholar]
- Eskici, G. , & Axelsen, P. H. (2012). Copper and oxidative stress in the pathogenesis of Alzheimer's disease. Biochemistry, 51(32), 6289–6311. [DOI] [PubMed] [Google Scholar]
- Gomes, L. M. F. , Vieira, R. P. , Jones, M. R. , Wang, M. C. P. , Dyrager, C. , Souza‐Fagundes, E. M. , … Beraldo, H. (2014). 8‐Hydroxyquinoline Schiff‐base compounds as antioxidants and modulators of copper‐mediated Aβ peptide aggregation. Journal of Inorganic Biochemistry, 139, 106–116. 10.1016/j.jinorgbio.2014.04.011 [DOI] [PubMed] [Google Scholar]
- Greenough, M. A. , Camakaris, J. , & Bush, A. I. (2013). Metal dyshomeostasis and oxidative stress in Alzheimer's disease. Neurochemistry International, 62(5), 540–555. 10.1016/j.neuint.2012.08.014 [DOI] [PubMed] [Google Scholar]
- Guillemin, G. J. , Kerr, S. J. , Smythe, G. A. , Smith, D. G. , Kapoor, V. , Armati, P. J. , … Brew, B. J. (2001). Kynurenine pathway metabolism in human astrocytes: A paradox for neuronal protection. Journal of Neurochemistry, 78(4), 842–853. 10.1046/j.1471-4159.2001.00498.x [DOI] [PubMed] [Google Scholar]
- Harding, S. D. , Sharman, J. L. , Faccenda, E. , Southan, C. , Pawson, A. J. , Ireland, S. , … NC‐IUPHAR (2018). The IUPHAR/BPS Guide to PHARMACOLOGY in 2018: Updates and expansion to encompass the new guide to IMMUNOPHARMACOLOGY. Nucleic Acids Research, 46, D1091–D1106. 10.1093/nar/gkx1121 [DOI] [PMC free article] [PubMed] [Google Scholar]
- Harlan, B. A. , Pehar, M. , Sharma, D. R. , Beeson, G. , Beeson, C. C. , & Vargas, M. R. (2016). Enhancing NAD+ salvage pathway reverts the toxicity of primary astrocytes expressing amyotrophic lateral sclerosis‐linked mutant superoxide dismutase 1 (SOD1). Journal of Biological Chemistry, 291(20), 10836–10846. 10.1074/jbc.M115.698779 [DOI] [PMC free article] [PubMed] [Google Scholar]
- Hitchcock, S. A. , & Pennington, L. D. (2006). Structure‐brain exposure relationships. Journal of Medicinal Chemistry, 49(26), 7559–7583. 10.1021/jm060642i [DOI] [PubMed] [Google Scholar]
- Jones, M. R. , Service, E. L. , Thompson, J. R. , Wang, M. C. , Kimsey, I. J. , DeToma, A. S. , … Storr, T. (2012). Dual‐function triazole‐pyridine derivatives as inhibitors of metal‐induced amyloid‐β aggregation. Metallomics, 4(9), 910–920. 10.1039/c2mt20113e [DOI] [PubMed] [Google Scholar]
- Kalinowski, D. S. , & Richardson, D. R. (2005). The evolution of iron chelators for the treatment of iron overload disease and cancer. Pharmacological Reviews, 57(4), 547–583. 10.1124/pr.57.4.2 [DOI] [PubMed] [Google Scholar]
- Kalinowski, D. S. , Sharpe, P. C. , Bernhardt, P. V. , & Richardson, D. R. (2008). Structure‐activity relationships of novel iron chelators for the treatment of iron overload disease: The methyl pyrazinylketone isonicotinoyl hydrazone series. Journal of Medicinal Chemistry, 51(2), 331–344. 10.1021/jm7012562 [DOI] [PubMed] [Google Scholar]
- Kaur, A. , Mann, S. , Kaur, A. , Priyadarshi, N. , Goyal, B. , Singhal, N. K. , & Goyal, D. (2019). Multi‐target‐directed triazole derivatives as promising agents for the treatment of Alzheimer's disease. Bioorganic Chemistry, 87, 572–584. 10.1016/j.bioorg.2019.03.058 [DOI] [PubMed] [Google Scholar]
- Khan, J. A. , Forouhar, F. , Tao, X. , & Tong, L. (2007). Nicotinamide adenine dinucleotide metabolism as an attractive target for drug discovery. Expert Opinion on Therapeutic Targets, 11(5), 695–705. 10.1517/14728222.11.5.695 [DOI] [PubMed] [Google Scholar]
- LaFerla, F. M. , & Oddo, S. (2005). Alzheimer's disease: Aβ, tau and synaptic dysfunction. Trends in Molecular Medicine, 11(4), 170–176. 10.1016/j.molmed.2005.02.009 [DOI] [PubMed] [Google Scholar]
- Lim, C. K. , Kalinowski, D. S. , & Richardson, D. R. (2008). Protection against hydrogen peroxide‐mediated cytotoxicity in Friedreich's ataxia fibroblasts using novel iron chelators of the 2‐pyridylcarboxaldehyde isonicotinoyl hydrazone class. Molecular Pharmacology, 74(1), 225–235. 10.1124/mol.108.046847 [DOI] [PubMed] [Google Scholar]
- Lipinski, C. A. (2004). Lead‐ and drug‐like compounds: The rule‐of‐five revolution. Drug Discovery Today Technology, 1(4), 337–341. 10.1016/j.ddtec.2004.11.007 [DOI] [PubMed] [Google Scholar]
- Love, S. , Barber, R. , & Wilcock, G. K. (1999). Increased poly (ADP‐ribosyl)ation of nuclear proteins in Azheimer's disease. Brain, 122(2), 247–253. 10.1093/brain/122.2.247 [DOI] [PubMed] [Google Scholar]
- Oksanen, M. , Petersen, A. J. , Naumenko, N. , Puttonen, K. , Lehtonen, S. , Gubert Olive, M. , … Koistinaho, J. (2017). PSEN1 mutant iPSC‐derived model reveals severe astrocyte pathology in Alzheimer's disease. Stem Cell Reports, 9(6), 1885–1897. 10.1016/j.stemcr.2017.10.016 [DOI] [PMC free article] [PubMed] [Google Scholar]
- Oyabu, K. , Kiyota, H. , Kubota, K. , Watanabe, T. , Katsurabayashi, S. , & Iwasaki, K. (2019). Hippocampal neurons in direct contact with astrocytes exposed to amyloid β25‐35 exhibit reduced excitatory synaptic transmission. IBRO Reports, 7, 34–41. 10.1016/j.ibror.2019.07.1719 [DOI] [PMC free article] [PubMed] [Google Scholar]
- Pajouhesh, H. , & Lenz, G. R. (2005). Medicinal chemical properties of successful central nervous system drugs. NeuroRx, 2(4), 541–553. 10.1602/neurorx.2.4.541 [DOI] [PMC free article] [PubMed] [Google Scholar]
- Palanimuthu, D. , Poon, R. , Sahni, S. , Anjum, R. , Hibbs, D. , Lin, H. Y. , … Richardson, D. R. (2017). Novel class of thiosemicarbazones show multi‐functional activity for the treatment of Alzheimer's disease. European Journal of Medicinal Chemistry, 139, 612–632. 10.1016/j.ejmech.2017.08.021 [DOI] [PubMed] [Google Scholar]
- Parvathy, S. , Hussain, I. , Karran, E. H. , Turner, A. J. , & Hooper, N. M. (1998). Alzheimer's amyloid precursor protein α‐secretase is inhibited by hydroxamic acid‐based zinc metalloprotease inhibitors: Similarities to the angiotensin converting enzyme secretase. Biochemistry, 37(6), 1680–1685. 10.1021/bi972034y [DOI] [PubMed] [Google Scholar]
- Plaschke, K. , & Kopitz, J. (2015). In vitro streptozotocin model for modeling Alzheimer‐like changes: Effect on amyloid precursor protein secretases and glycogen synthase kinase‐3. Journal of Neural Transmission, 122(4), 551–557. [DOI] [PubMed] [Google Scholar]
- Putt, K. S. , Beilman, G. J. , & Hergenrother, P. J. (2005). Direct quantification of Poly (ADP‐ribose) polymerase (PARP) activity as a means to distinguish necrotic and apoptotic death in cell and tissue samples. Chembiochem, 6(1), 53–55. [DOI] [PubMed] [Google Scholar]
- Richardson, D. , Vitolo, L. W. , Bakers, E. , & Webb, J. (1989). Pyridoxal isonicotinoyl hydrazone and analogues. Biology of Metals, 2(2), 69–76. [DOI] [PubMed] [Google Scholar]
- Richardson, D. R. , & Ponka, P. (1997). The molecular mechanisms of the metabolism and transport of iron in normal and neoplastic cells. Biochimica et Biophysica Acta, 1331(1), 1–40. 10.1016/s0304-4157(96)00014-7 [DOI] [PubMed] [Google Scholar]
- Richardson, D. R. , Sharpe, P. C. , Lovejoy, D. B. , Senaratne, D. , Kalinowski, D. S. , Islam, M. , & Bernhardt, P. V. (2006). Dipyridyl thiosemicarbazone chelators with potent and selective antitumor activity form iron complexes with redox activity. Journal of Medicinal Chemistry, 49(22), 6510–6521. 10.1021/jm0606342 [DOI] [PubMed] [Google Scholar]
- Richardson, D. R. , Tran, E. H. , & Ponka, P. (1995). The potential of iron chelators of the pyridoxal isonicotinoyl hydrazone class as effective antiproliferative agents. Blood, 86(11), 4295–4306. [PubMed] [Google Scholar]
- Ritchie, C. W. , Bush, A. I. , Mackinnon, A. , Macfarlane, S. , Mastwyk, M. , MacGregor, L. , … Masters, C. L. (2003). Metal‐protein attenuation with iodochlorhydroxyquin (clioquinol) targeting Aβ amyloid deposition and toxicity in Alzheimer disease: A pilot phase 2 clinical trial. Archives of Neurology, 60(12), 1685–1691. 10.1001/archneur.60.12.1685 [DOI] [PubMed] [Google Scholar]
- Rogers, J. T. , Randall, J. D. , Cahill, C. M. , Eder, P. S. , Huang, X. , Gunshin, H. , … Gullans, S. R. (2002). An iron‐responsive element type II in the 5′‐untranslated region of the Alzheimer's amyloid precursor protein transcript. Journal of Biological Chemistry, 277(47), 45518–45528. 10.1074/jbc.M207435200 [DOI] [PubMed] [Google Scholar]
- Sang, Z. , Wang, K. , Zhang, P. , Shi, J. , Liu, W. , & Tan, Z. (2019). Design, synthesis, in‐silico and biological evaluation of novel chalcone derivatives as multi‐function agents for the treatment of Alzheimer's disease. European Journal of Medicinal Chemistry, 180, 238–252. [DOI] [PubMed] [Google Scholar]
- Schreiber, V. , Dantzer, F. , Ame, J. C. , & de Murcia, G. (2006). Poly (ADP‐ribose): Novel functions for an old molecule. Nature Reviews Molecular Cell Biology, 7(7), 517–528. [DOI] [PubMed] [Google Scholar]
- Sestak, V. , Stariat, J. , Cermanova, J. , Potuckova, E. , Chladek, J. , Roh, J. , … Kovarikova, P. (2015). Novel and potent anti‐tumor and anti‐metastatic di‐2‐pyridylketone thiosemicarbazones demonstrate marked differences in pharmacology between the first and second generation lead agents. Oncotarget, 6(40), 42411–42428. 10.18632/oncotarget.6389 [DOI] [PMC free article] [PubMed] [Google Scholar]
- Trammell, S. A. , & Brenner, C. (2013). Targeted, LCMS‐based metabolomics for quantitative measurement of NAD+ metabolites. Computational and Structural Biotechnology Journal, 4, e201301012 10.5936/csbj.201301012 [DOI] [PMC free article] [PubMed] [Google Scholar]
- Vassar, R. , Bennett, B. D. , Babu‐Khan, S. , Kahn, S. , Mendiaz, E. A. , Denis, P. , … Citron, M. (1999). β‐Secretase cleavage of Alzheimer's amyloid precursor protein by the transmembrane aspartic protease BACE. Science, 286(5440), 735–741. 10.1126/science.286.5440.735 [DOI] [PubMed] [Google Scholar]
- Verdin, E. (2015). NAD+ in aging, metabolism, and neurodegeneration. Science, 350(6265), 1208–1213. 10.1126/science.aac4854 [DOI] [PubMed] [Google Scholar]
- Vnencak, M. , Scholvinck, M. L. , Schwarzacher, S. W. , Deller, T. , Willem, M. , & Jedlicka, P. (2019). Lack of β‐amyloid cleaving enzyme‐1 (BACE1) impairs long‐term synaptic plasticity but enhances granule cell excitability and oscillatory activity in the dentate gyrus in vivo. Brain Structure and Function, 225(3), 1279–1290. [DOI] [PubMed] [Google Scholar]
- Wood, J. G. , Rogina, B. , Lavu, S. , Howitz, K. , Helfand, S. L. , Ttar, M. , & Sinclair, D. (2004). Sirtuin activators mimic caroric restriction and delay ageing in metazoans. Nature, 430(7000), 686–689. 10.1038/nature02789 [DOI] [PubMed] [Google Scholar]
- Yao, Y. S. , Yang, Y. , & Zhu, W. G. (2014). Sirtuins: Nodes connecting aging, metabolism and tumorigenesis. Current Pharmaceutical Design, 20(11), 1614–1624. 10.2174/13816128113199990513 [DOI] [PubMed] [Google Scholar]
- Yu, Y. , Zhang, L. , Li, C. , Sun, X. , Tang, D. , & Shi, G. (2014). A method for evaluating the level of soluble β‐amyloid(1‐40/1‐42) in Alzheimer's disease based on the binding of gelsolin to β‐amyloid peptides. Angewandte Chemie International Edition, 53(47), 12832–12835. [DOI] [PubMed] [Google Scholar]
- Yuan, J. , Lovejoy, D. B. , & Richardson, D. R. (2004). Novel di‐2‐pyridyl‐derived iron chelators with marked and selective antitumor activity: in vitro and in vivo assessment. Blood, 104(5), 1450–1458. 10.1182/blood-2004-03-0868 [DOI] [PubMed] [Google Scholar]
Associated Data
This section collects any data citations, data availability statements, or supplementary materials included in this article.
Supplementary Materials
Figure S1. ORTEP diagrams of the single crystal X‐ray structures of (A) SNH2 and (B) SNH6 drawn at 50% probability level.
Figure S2. The linear correlation between experimental and reported permeability values of five commercial drugs, namely Theophylline, Verapamil, Progesterone, Chlorpromazine, and Donepezil, obtained by the PAMPA‐BBB assay.
Figure S3. Individual standard curves for (A) NAD+ and (B) NADH using LC–MS.
Table S1. Prediction of CNS penetration based on ranges of permeability values of PAMPA‐BBB assay determined in Figure S2 and as suggested by Di et al. (Pe, 10‐6 cm.s‐1; Di et al., 2003).
Table S2. Retention times and MS/MS transitions used for NAD+ and NADH.