

Abstract
Background and Purpose
Hypertension is associated with gut dysbiosis. Here we have evaluated the effects of the angiotensin receptor antagonist losartan on gut microbiota in spontaneously hypertensive rats (SHR) to assess their contribution to its antihypertensive effects.
Experimental Approach
Twenty‐week‐old Wistar Kyoto rats (WKY) and SHR were treated with losartan for 5 weeks (SHR‐losartan). Faecal microbiota transplantation (FMT) was performed from donor SHR‐losartan group to recipient untreated‐SHR. Blood pressure (BP) was measured using tail‐cuff plethysmography. Composition of the gut microbiota was assessed by amplification of the V3‐V4 region of 16S rRNA gene. T cells were analysed in gut/aorta by flow cytometry.
Key Results
Faeces from SHR showed gut dysbiosis, characterised by higher Firmicutes/Bacteroidetes ratios, lower acetate‐ and higher lactate‐producing bacteria, and lower levels of strict anaerobic bacteria, effects which were restored to normal by losartan. Improvement of gut dysbiosis was linked to higher colonic integrity and lower sympathetic drive in the gut. In contrast, hydralazine reduced BP, but it neither restored gut dysbiosis nor colonic integrity. FMT from SHR‐losartan to SHR reduced BP, improved the aortic endothelium‐dependent relaxation to ACh, and reduced NADPH oxidase activity. These vascular changes were accompanied by both increased Treg and decreased Th17 cell populations in the vascular wall.
Conclusion and Implications
In SHR, losartan treatment reduced gut dysbiosis and sympathetic drive in the gut, thus improving gut integrity. The changes induced by losartan in gut microbiota contributed, in part, to protecting the vasculature and reducing BP, possibly by modulating the immune system in the gut.
Abbreviations
- AGT
angiotensinogen
- DHE
dihydroethidium
- F/B
Firmicutes/Bacteroidetes
- FMT
faecal microbiota transplantation
- FoxP3
forkhead box P3
- GOLD
Genomes OnLine Database
- HR
heart rate
- IBD
inflammatory bowel diseases
- KMO
Kaiser–Meyer–Olkin
- L‐NAME
NG‐nitro‐l‐arginine methyl ester
- LDA
linear discriminant analysis
- MLNs
mesenteric lymph nodes
- MUC
mucin
- NA
noradrenaline
- OTU
operational taxonomic unit
- PCA
principal component analysis
- RAS
renin‐angiotensin system
- RORγ
retinoid‐related orphan receptor‐γ
- SBP
systolic BP
- SCFAs
short chain fatty acids
- SHR
spontaneously hypertensive rats
- Th
T helper
- Treg
regulatory T cells
- WKY
Wistar Kyoto rats
- ZO‐1
zonula occludens‐1
What is already known
Gut microbiota is involved in the control of BP.
RAS inhibition reduces BP, reverses gut pathology, and shifts the gut microbiota composition in SHR.
What this study adds
RAS inhibition corrects gut dysbiosis due to its capacity to inhibit sympathetic drive.
Changes in gut microbiota induced by RAS inhibition contributed to the reduction of BP.
What is the clinical significance
Gut microbiota represent a new target for losartan in the BP control.
Gut dysbiosis inhibition by antihypertensive drugs might be involved in lowering BP in genetic hypertension.
1. INTRODUCTION
The gut harbours trillions of bacteria that modulate the host homeostasis within and outside the intestinal tract. The gut microbiota is commonly referred to as an essential acquired organ because its composition and richness are constantly adapting to the challenges occurring in the environment or in the host, such as age, diet, and lifestyle modifications. In addition, it has been commonly observed that a change in the host health status has been accompanied by a shift in the gut microbiota (Marques et al., 2017).
In the periphery, the gut microbiota plays an important role in shaping a robust systemic and intestinal immune system (Chow, Lee, Shen, Khosravi, & Mazmanian, 2010; McDermott & Huffnagle, 2014). Recent data suggest that gut microbiota may also play a role in the development and maintenance of cardiovascular disease and metabolic disorders, such as obesity, diabetes mellitus, and metabolic syndrome (Everard & Cani, 2013; Howitt & Garrett, 2012; Tang et al., 2013; Tilg & Kaser, 2011). Recently, it has been demonstrated that the normal gut microbiota may influence BP. A direct association between gut microbiota and hypertension in both animal models and humans has been described (Yang et al., 2015; Kim et al., 2018, Toral et al., 2019b, 2019a, Sun et al., 2019). In contrast, Karbach et al. (2016) showed that BP was not different between germ‐free and conventionally raised mice, which is consistent with previous observations describing no effect on BP after dramatic reduction in faecal microbial biomass induced by antibiotic treatment (Pluznick et al., 2013). Similarly, both the Firmicutes/Bacteroidetes (F/B) ratio and the abundance levels of selected genera in pre‐hypertensive spontaneously hypertensive rats (SHR) were not significantly different from the age matched Wistar Kyoto rats (WKY) (Santisteban et al., 2017). Interestingly, transplantation of microbiota from SHR to WKY (Adnan et al., 2017; Toral et al., 2019a) or from hypertensive humans to germ‐free mice (Li et al., 2017) increased BP, showing the role of dysbiotic microbiota in the development of hypertension. In humans, overgrowth of bacteria such as Prevotella and Klebsiella has been described in both pre‐hypertensive and hypertensive populations, compared with levels in healthy subjects (Li et al., 2017). Moreover, systolic BP (SBP) positively correlated with six bacterial species (Parabacteroides johnsonii, Klebsiella unclassified, Anaerotruncus unclassified, Eubacterium siraeum, Prevotella bivia, and Rumminococcus torques) and negatively correlated with three (Bacteroides thetaiotaomicron, Paraprevotella clara, and Paraprevotella unclassified) species (Kim et al., 2018). In SHR, a strong positive correlation between SBP and the lactate‐producing genus Lactobacillus (Adnan et al., 2017), or Streptococcus and Turicibacter (Toral et al., 2019b; Yang et al., 2015), and a negative correlation between https://www.guidetopharmacology.org/GRAC/LigandDisplayForward?ligandId=1059‐producing bacteria genus Odoribacter and acetate‐producing bacteria genus Bautia with SBP (Toral et al., 2019a) have been described. However, the absence of gut microbiota protects mice from https://www.guidetopharmacology.org/GRAC/LigandDisplayForward?ligandId=2504‐induced hypertension, vascular dysfunction, and hypertension‐induced end‐organ damage, showing for the first time that commensal microbiota, an ecosystem acquired after birth, could represent an environmental factor promoting angiotensin II‐induced high BP (Karbach et al., 2016). Similarly, oral administration of antibiotics improved BP in angiotensin II‐induced hypertension and in SHR (Yang et al., 2015). The BP reduction by minocycline was able to rebalance the hypertension‐related dysbiotic gut microbiota by reducing the F/B ratio in angiotensin II‐induced hypertension (Yang et al., 2015). Similarly, the consumption of probiotic Lactobacillus strains reduced BP in SHR (Gomez‐Guzman et al., 2015), in https://www.guidetopharmacology.org/GRAC/LigandDisplayForward?ligandId=6784‐induced hypertension in mice (Toral et al., 2018) and in high salt diet‐induced hypertension in mice (Wilck et al., 2017), showing that restoring the microbiota composition to a composition, similar to that found in normotensive animals led to the improvement of BP. In addition, increased permeability of gut epithelial barrier, intestinal inflammatory status, and dysbiosis were associated with BP elevation in angiotensin II‐infused mice (Kim et al., 2018). In fact, the inhibition of the renin‐angiotensin system (RAS) by the ACE inhibitor https://www.guidetopharmacology.org/GRAC/LigandDisplayForward?ligandId=5158 reduces BP, reverses gut pathology (Santisteban et al., 2017), and shifts the gut microbiota composition in SHR (Yang et al., 2019). However, whether BP reduction by other inhibitors of the RAS, such as the angiotensin receptor antagonist https://www.guidetopharmacology.org/GRAC/LigandDisplayForward?ligandId=590, shifts the gut microbiota composition is unclear. Whether changes in microbiota induced by these drugs are involved in their antihypertensive effects is also unknown.
Normal microbiota regulates immune homeostasis, such as the balance between T helper 17 (Th17) and regulatory T cells (Treg) in gut lymph organs and in the vascular wall, which is involved in BP regulation (Karbach et al., 2016; Toral et al., 2018). Furthermore, a critical role of the interaction between the gut microbiota and the sympathetic nervous system in the regulation of BP has been recently described (Toral et al., 2019b, 2019a). We hypothesised that BP reduction in established hypertension might contribute to correct gut dysbiosis in SHR, and might also contribute to maintain low BP through changed T cell populations in the vascular wall. Therefore, the aim of this study was to evaluate the effects of losartan on gut microbiota in SHR and the role of gut microbiota in the antihypertensive effect of losartan.
2. METHODS
2.1. Animals and experimental groups
This study was conducted in accordance with the regulations and requirements of the European Union concerning the protection of animals used for scientific purposes. The experimental protocol was approved by the Ethics Committee of Laboratory Animals of the University of Granada (Spain; permit number 03‐CEEA‐OH‐2013). Animal studies are reported in compliance with the ARRIVE guidelines (Kilkenny et al., 2010; McGrath & Lilley, 2015) and with the recommendations made by the British Journal of Pharmacology.
Twenty weeks old male SHR/Kyo@Rj and WKY/Kyo@Rj from Envigo (RRID:RGD_5508396, Barcelona, Spain) were used in the present study. We selected SHR as an animal model of genetic hypertension. The SHR is a model with characteristics similar to essential hypertension in non‐obese humans and one in which males have higher BP than females as young adults, but both sexes are hypertensive compared with normotensive Sprague–Dawley or WKY rats. Rats were kept in specific pathogen‐free facilities at University of Granada Biological Services Unit. All animals were housed under standard laboratory conditions (12 hr light/dark cycle, temperature 21–22°C, 50–70% humidity). Rats were housed in Makrolom cages (Ehret, Emmerdingen, Germany), with dust‐free laboratory bedding and enrichment. In order to avoid horizontal transmission of the microbiota among animals, each rat was housed in a separate cage. Rats were provided with water and standard laboratory diet (SAFE A04, Augy, France) ad libitum. Water was changed every day, and both water and food intake was recorded daily for all groups. Studies were designed to generate groups of equal size. Animals were randomly assigned to treatment groups, and the experimenter was blinded to drug treatment until data analysis has been performed.
-
Experiment 1:
Rats were randomly assigned to three different experimental groups (n = 8): (a) untreated WKY (WKY, 1 ml of tap water once daily), (b) untreated SHR (SHR), and (c) SHR treated with losartan (SHR‐losartan, 20 mg·kg−1·day−1 by oral gavage).
-
Experiment 2:
SHR were randomly assigned to two groups (n = 8): (a) SHR and (b) SHR treated with https://www.guidetopharmacology.org/GRAC/LigandDisplayForward?ligandId=7326 (SHR‐hydralazine, 25 mg·kg−1·day−1 by oral gavage).
In both experiments, rats were treated for 5 weeks. Body weight was measured every week.
-
Experiment 3:
To explore the role of microbiota from the SHR‐losartan group in the antihypertensive effects of losartan, a faecal microbiota transplantation (FMT) experiment was performed. For this purpose, faecal contents were collected fresh and pooled from individual rats from SHR and SHR‐losartan groups at the end of the Experiment 1, 24 hr after the last dose of losartan. Twenty‐week‐old recipient SHR were orally gavaged with donor faecal contents for three consecutive days and once every 3 days for a total period of 2 weeks. Animals were randomly assigned to two different groups of eight animals each: SHR with SHR microbiota (S‐S) and SHR with SHR‐losartan microbiota (S‐SLOS).
2.2. Faecal microbiota transplantation
The FMT to recipient rats was performed as previously reported (Toral et al., 2019b, 2019a). Faecal contents were diluted 1:20 in sterile PBS and centrifuged at 60 g for 5 min. The supernatant was aliquoted and stored at −80°C. One week prior to transplantation, 1‐ml https://www.guidetopharmacology.org/GRAC/LigandDisplayForward?ligandId=5326 sodium (400 mg·kg−1·day−1) was administered daily to recipient rats for five consecutive days by oral gavage. Forty‐eight hours after the last antibiotic treatment, recipient rats were orally gavaged with donor faecal contents (1 ml), as described above. Losartan concentration in the supernatant used for FMT was measured by mass spectroscopy using previously published techniques (Okawada et al., 2011).
2.3. BP measurements
SBP and heart rate (HR) were measured weekly at room temperature using tail‐cuff plethysmography as described previously (Vera et al., 2007). All measurements were performed in a quiet room by the same, blinded, experimenter.
2.4. Cardiac and renal weight indices
When the experimental period was completed, 18‐hr fasting animals were anaesthetised with 2.5 ml·kg−1 equitensin (i.p.), and blood was collected from the abdominal aorta. Finally, the rats were killed by exsanguination. The kidneys and the heart were then removed and weighed. The heart was divided into right ventricle and left ventricle plus septum. All tissue samples were frozen in liquid nitrogen and then stored at −80°C.
2.5. Plasma and colonic parameters
Blood samples were cooled on ice and centrifuged for 10 min at 1200 g at 4°C, and plasma was frozen at −80°C. Plasma LPS concentration was measured using the Limulus Amebocyte Lysate Chromogenic Endotoxin Quantitation Kit (Lonza, Valais, Switzerland), according to the manufacturer's instructions.
We used elisa kits (IBL International, Hamburg, Germany) to measure colonic https://www.guidetopharmacology.org/GRAC/LigandDisplayForward?ligandId=484 concentrations following the manufacturer's protocol. Colon samples were collected and placed in the appropriate conservation solution. EDTA (1 mM) and sodium metabisulfite (4 mM) were added to prevent degradation of catecholamines. Then tissue samples were stored at −80°C for later use.
2.6. Vascular reactivity studies
Segments of thoracic aortic rings (3 mm) were dissected from animals and were mounted in organ chambers filled with Krebs solution (composition in mM: NaCl 118, KCl 4.75, NaHCO3 25, MgSO4 1.2, CaCl2 2, KH2PO4 1.2, and glucose 11) as previously described (Gomez‐Guzman et al., 2011).
The concentration–relaxation response curves to https://www.guidetopharmacology.org/GRAC/LigandDisplayForward?ligandId=294 (10−9–10−5 M) were studied in aorta pre‐contracted with https://www.guidetopharmacology.org/GRAC/LigandDisplayForward?ligandId=485 (1 μM) in the absence or the presence of NG‐nitro‐l‐arginine methyl ester (https://www.guidetopharmacology.org/GRAC/LigandDisplayForward?ligandId=5213, 100 μM) or apocynin (10 μM). The concentration–relaxation response curves to https://www.guidetopharmacology.org/GRAC/LigandDisplayForward?ligandId=9533 (10−9–10−6 M) were performed in the dark in aortic rings, without endothelium, pre‐contracted with 1‐μM phenylephrine. Relaxation responses were expressed as a percentage of pre‐contraction.
2.7. Measurement of vascular ROS levels ex vivo
We used dihydroethidium (DHE), an oxidative fluorescent dye, to localise ROS in aortic segments in situ, as previously described (Zarzuelo et al., 2011). Briefly, the aorta segments were placed in optimum cutting temperature compound medium (Tissue‐Tek; Sakura Finetechnical, Tokyo, Japan), quickly frozen, and cut into 10‐μm‐thick sections in a cryostat (Microm International Model HM500 OM). Sections were incubated at room temperature for 30 min with 10‐μM DHE in the dark, counterstained with the nuclear stain DAPI (300 nM), and in the following 24 hr examined with a fluorescence microscope (Leica DM IRB, Wetzlar, Germany). Sections were photographed, and ethidium and DAPI fluorescence were quantified using ImageJ (version 1.32j, NIH, http://rsb.info.nih/ij/). ROS production was estimated from the ratio of ethidium/DAPI fluorescence.
2.8. Immunofluorescent detection of macrophages and lymphocytes
The antibody‐based procedures used in this study comply with the recommendations made by the British Journal of Pharmacology. Immunofluorescence microscopy was performed on 10‐μm‐thick cryostat aortic sections. Aortic sections were air‐dried for 30 min, fixed for 5 min in methanol at −20°C, and washed with PBS for 15 min. Sections were blocked with PBS containing 5% non‐fat dry milk for 2 hr at room temperature and then incubated with a mouse anti‐macrophage‐specific antigen CD11b polyclonal antibody (1:200, Santa Cruz Biotechnology, Santa Cruz, USA), and a rabbit anti‐CD3 polyclonal antibody (1:200, Abcam, Cambridge, UK) in a blocking solution overnight at 4°C. The sections were washed three times with PBS and incubated with Alexa Fluor® 594 goat anti‐rabbit, Alexa Fluor™ 488 goat anti‐mouse (1:200, Molecular Probes, Oregon, USA) in the blocking solution for 1 hr at room temperature and then washed three times with PBS. Images were captured using a fluorescence microscope (Leica DM IRB, Wetzlar, Germany). The percentage of CD11 and CD3 staining/total surface area was quantified with Image J software (version 1.32j, NIH, http://rsb.info.nih/ij/; Barhoumi et al., 2011).
2.9. NADPH oxidase activity
The lucigenin‐enhanced chemiluminescence assay was used to determine https://www.guidetopharmacology.org/GRAC/FamilyDisplayForward?familyId=993 activity in intact aortic rings as previously described (Zarzuelo et al., 2011). Aortic rings from all experimental groups were incubated for 30 min at 37°C in HEPES‐containing physiological salt solution (pH 7.4) of the following composition (in mM): NaCl 119, HEPES 20, KCl 4.6, MgSO4 1, Na2HPO4 0.15, KH2PO4 0.4, NaHCO3 1, CaCl2 1.2, and glucose 5.5. Then https://www.guidetopharmacology.org/GRAC/LigandDisplayForward?ligandId=3041 (100 μM) was added to the buffer containing the aortic rings, and lucigenin (5 μM) was injected automatically. NADPH oxidase activity was determined by measuring luminescence over 200 s in a scintillation counter (Lumat LB 9507, Berthold, Germany) in 5‐s intervals and was calculated by subtracting the basal values from those found in the presence of NADPH and expressed as RLU (relative light units)·min−1·mg−1 of tissue for aortic rings.
2.10. Flow cytometry
Mesenteric lymph nodes (MLNs) were collected from all groups. The tissues were mashed with wet slides to decrease friction, and then the solutions were filtered through a 70‐μM cell strainer. Samples of cells (1 × 10⁶) were incubated with a protein transport inhibitor (BD GolgiPlugTM) for an optimum detection of intracellular cytokines by flow cytometry. For intracellular staining, cells were stimulated with 50 ng·ml−1 https://www.guidetopharmacology.org/GRAC/LigandDisplayForward?ligandId=2341 plus 1 μg·ml−1 ionomycin. After 4.5 hr, aliquot cells, of each sample, were blocked with anti‐CD32 (clone D34‐485) for 30 min at 4°C to avoid non‐specific binding to Fc‐γ receptors. After that, the cells were transferred to polystyrene tubes for the surface staining with mAbs anti‐https://www.guidetopharmacology.org/GRAC/ObjectDisplayForward?objectId=2995 (PerCP‐Vio700, clone REA482, Miltenyi Biotec, Bergisch Gladbach, Germany), anti‐https://www.guidetopharmacology.org/GRAC/ObjectDisplayForward?objectId=1852 (APC, clone RA3‐6B2 BD PharmigenTM, New Jersey, USA), and viability dye (LIVE/DEAD® Fixable Aqua Dead cell Sain Kit, Molecular Probes, Oregon, USA) for 20 min at 4°C in the dark. The lymphocytes were then fixed, permeabilised with the Fix/Perm Fixation/Permeabilisation Kit (eBioscience, San Diego, USA), and intracellular staining was achieved with mAbs anti‐forkhead box P3 (FoxP3; PE,clone FJK‐16s, eBioscience, San Diego, USA), anti‐IL (IL‐17A; PE‐Cy7, clone eBio17B7, eBioscience, San Diego, USA), and anti‐IFN‐γ (Alexa Fluor 647, DB‐1, 6B2 BD Pharmigen™, New Jersey, USA) for 30 min at 4°C in the dark. All samples were analysed using a flow cytometer CANTO II (BD Biosciences), and data were analysed with FlowJo software (Tree Star, Ashland, OR, USA; Romero et al., 2017).
2.11. Gene expression analysis
The analysis of gene expression was performed by reverse transcription PCR (RT‐PCR), as previously described (Zarzuelo et al., 2011). For this purpose, total RNA was extracted by homogenisation using TRI Reagent® following the manufacturer's protocol. All RNA samples were quantified with the Thermo Scientific NanoDrop™ 2000 Spectrophotometer (Thermo Fisher Scientific, Inc., Waltham, MA, USA), and 2 μg of RNA was reverse transcribed using oligo (dT) primers (Promega, Southampton, UK). PCR was performed with a Techne Techgene thermocycler (Techne, Cambridge, UK). The sequences of the forward and reverse primers used for amplification are described in Table S1. The efficiency of the PCR reaction was determined using a dilution series of standard vascular samples. To normalise mRNA expression, the expression of the housekeeping gene β‐actin was used. The mRNA relative quantification was calculated using the ΔΔCt method.
2.12. DNA extraction, 16S rRNA gene amplification, bioinformatics
For analysis of the bacterial population present in the gut, faecal samples were collected from six individual animals at the end of the experimental period. DNA was extracted from faecal samples using G‐spin columns (INTRON Biotechnology) and starting from 30 mg of samples resuspended in PBS and treated with proteinase K and RNAses. DNA concentration was determined in the samples using Quant‐IT PicoGreen reagent (Thermo Fischer), and DNA samples (about 3 ng) were used to amplify the V3‐V4 region of 16S rRNA gene (Caporaso et al., 2011). PCR products (approximately 450 bp) included extension tails, which allowed sample barcoding and the addition of specific Illumina sequences in a second low‐cycle number PCR. Individual amplicon libraries were analysed using a Bioanalyzer 2100 (Agilent), and samples were pooled in equimolar amounts. The pool was further cleaned and quantified, and the exact concentration was estimated by real time PCR (Kapa Biosystems). Finally, DNA samples were sequenced on an Illumina MiSeq instrument with 2 × 300 bp paired‐end sequencing reads at the Genomics Unit (Madrid Science Park, Spain).
We used the BIPES pipeline to process the raw sequences (Zhou et al., 2011). First, the barcode primers were trimmed and filtered if they contained ambiguous bases or mismatches in the primer regions according to the BIPES protocol. Second, we removed any sequences with more than one mismatch within the 40–70 bp region at each end. Third, we used 30 Ns to concentrate the two single‐ended sequences for the downstream sequence analyses. A detailed description of these methods was previously reported (Liu et al., 2017). Third, we performed UCHIME (implemented in USEARCH, version 6.1) to screen out and remove chimeras in the de novo mode (using‐minchunk 20‐xn 7‐noskipgaps 2; Edgar & Flyvbjerg, 2015).
Between 90,000 and 220,000 sequences were identified in each sample. All subsequent analyses were performed using 16S Metagenomics (Version: 1.0.1.0) from Illumina. The sequences were then clustered to an operational taxonomic unit (OTU) using USEARCH with default parameters (USERACH61). The threshold distance was set to 0.03. Hence, when the similarity between two 16S rRNA sequences was 97%, the sequences were classified as the same OTU. QIIME‐based alignments of representative sequences were performed using PyNAST, and the Greengenes 13_8 database was used as the template file. The Ribosome Database Project algorithm was applied to classify the representative sequences into specific taxa using the default database (Edgar & Flyvbjerg, 2015). The Taxonomy Database (National Center for Biotechnology Information) was used for classification and nomenclature. Bacteria were classified based on the short chain fatty acids (SCFAs) end‐product as previously described (Wang, Garrity, Tiedje, & Cole, 2007). Bacteria were classified based on the oxygen requirement using Genomes OnLine Database (GOLD) (Mukherjee et al., 2019).
2.13. Data and statistical analysis
The data and statistical analysis comply with the recommendations of the British Journal of Pharmacology on experimental design and analysis in pharmacology (Curtis et al., 2018). Statistical analysis was undertaken only for studies where each group size was at least n = 5. Group size is the number of independent values, and statistical analysis was done using these independent values. The Shannon, Chao, Pielou, and observed species indexes were calculated using QIIME (PAST 3×). Reads in each OTU were normalised to total reads in each sample. Only taxa with a percentage of reads >0.001% were used for the analysis. Principal component analysis (PCA) was also applied to these data to identify significant differences between groups, using PAST 3× and SSPS. Linear discriminant analysis (LDA) scores greater than 2 were displayed. Taxonomy was summarised at the genus level within QIIME‐1.9.0 and uploaded to the Galaxy platform (Segata et al., 2011) to generate the LDA effect size (LEfSe)/cladogram enrichment plots considering significant enrichment at a P < .05, LDA score > 2. All data were analysed using GraphPad Prism 7 (RRID:SCR_000306). Results are expressed as means ± SEM of measurements. The evolution of tail SBP and the concentration–response curves to ACh were analysed by two‐way repeated‐measures ANOVA with the Bonferroni post hoc test. The remaining variables were tested for normal distribution using Shapiro–Wilk normality test and compared using an unpaired t test or one‐way ANOVA and Tukey post hoc test in case of normal distribution or Mann–Whitney U test or Kruskal–Wallis with Dunn's multiple comparison test in case of abnormal distribution. P < .05 was considered statistically significant.
2.14. Materials
All chemicals were obtained from Sigma‐Aldrich (Barcelona, Spain), unless otherwise stated.
2.15. Nomenclature of targets and ligands
Key protein targets and ligands in this article are hyperlinked to corresponding entries in http://www.guidetopharmacology.org, the common portal for data from the IUPHAR/BPS Guide to PHARMACOLOGY (Harding et al., 2018), and are permanently archived in the Concise Guide to PHARMACOLOGY 2019/20 (Alexander, Christopoulos et al., 2019; Alexander, Fabbro, Kelly, Mathie, Peters, Veale, et al., 2019a, b).
3. RESULTS
3.1. Losartan treatment reduces gut dysbiosis in SHR
The compositions of bacterial communities were evaluated by calculating three major ecological parameters, including Chao richness, Pielou evenness, and Shannon diversity and the number of observed species. Reduced richness and diversity without changes in evenness and observed species were found in gut microbiota from SHR compared to those found in WKY. Losartan did not restore these changes despite its antihypertensive effect (Figure S1A).
We performed a three‐dimensional PCA of the bacterial community, which measures microorganism diversity between samples, that is, β‐diversity, at the level of the different taxa (phylum, class, order, family, genus, and species), in an unsupervised manner. This analysis at the phylum level showed a perfect clustering of the animals into the SHR and WKY groups, with no perfect clustering of the animals into SHR‐losartan group (Figure S1B). The composition of the faecal microbial communities of the WKY and SHRs was found to be distinct from the previously reported composition (Yang et al., 2015). A clear separation was observed in the PCA between the two clusters representing the microbial compositions of WKY and SHR, indicating two extremely different gut environments. However, the cluster SHR‐losartan was closer to WKY than to SHR and the key bacterial populations that were responsible for discriminating among groups were in the phylum Firmicutes (loading 0.84). The Kaiser–Meyer–Olkin (KMO) test, that measures sampling adequacy, was 0.777, indicating a middling sampling. The Barlett's test of sphericity was <0.05. The analysis of the phyla composition showed that Firmicutes was the most abundant phylum in the rat faeces, followed by Proteobacteria, Actinobacteria, Bacteroidetes, and Verrucomicrobia (Figure 1a). The proportion of bacteria from the Firmicutes phylum was significantly higher in SHR than in WKY and SHR‐losartan, whereas the proportions of Actinobacteria and Bacteroidetes were lower in SHR than in the other groups. Losartan treatment restored bacteria from the Firmicutes and Bacteroidetes phyla to levels similar to those found in WKY. The F/B ratio, a signature of gut dysbiosis in hypertension (Yang et al., 2015), was ≈3‐fold higher in SHR than in WKY, and this ratio was restored to normal values after treatment with losartan (Figure 1b). In addition, significantly lower percentages of acetate‐ and propionate‐producing bacteria, and a higher percentage of lactate‐producing bacteria, without significant differences in the percentage of butyrate‐producing bacteria, were found in SHR compared to WKY. These differences also were abolished by losartan treatment (Figure 1c). Moreover, the percentage of strict anaerobic bacteria was significantly lower in SHR compared to WKY, and no significant differences in strict aerobic bacteria were found between SHR and WKY. Losartan restored this change in the percentage of anaerobic bacteria (Figure 1d).
Figure 1.
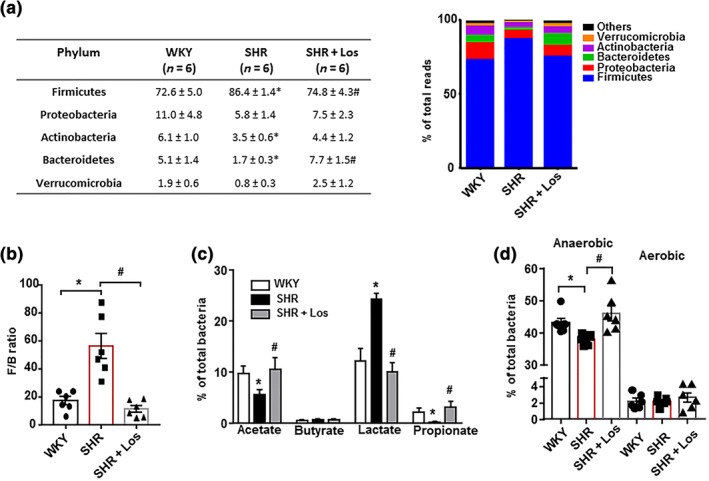
Losartan (Los) induces different behaviours of the gut microbiota of spontaneously hypertensive rats (SHR). Faecal samples were collected, and bacterial 16S ribosomal DNA was amplified and sequenced to analyse the composition of microbial communities. Phylum breakdown of the five most abundant bacterial communities in the faecal samples obtained from all experimental groups (a). The Firmicutes/Bacteroidetes ratio (F/B ratio) was calculated as a biomarker of gut dysbiosis (b). Relative proportions of acetate‐, butyrate‐, lactate‐, and propionate‐producing bacteria (c). Anaerobic and aerobic bacteria expressed as relative proportions (d) in the gut microbiota in Wistar Kyoto rats (WKY), untreated SHR (SHR) and SHR treated with losartan (SHR‐Los). Values are expressed as mean ± SEM (n = 6). * P < .05, significantly different from WKY rats. # P < .05 significantly different from untreated SHR
Figure S2 shows the bacterial taxa (class, order, family, and genus) that were altered in SHR according to LEfSe. Prominent changes in bacterial taxa occurred, where the relative abundance of 51 taxa was increased (green) and 19 taxa were decreased (red) in WKY compared to SHR. Losartan treatment of SHR also induced several changes in the microbiota taxa compared to SHR, where the relative abundance of 41 taxa was increased (green) and 16 taxa was decreased (red; Figure S3).
We also identified the bacterial families (Figure S4) and genera (Figure S5) that were associated with changes in the composition of microbiota. The key bacterial populations that are responsible for discriminating among groups was the family Clostridiaceae (loading 0.38) and the genus Oscillospira (loading 0.78). The KMO test was 0.84 and 0.82, indicating in both cases a meritorious sampling for PCA at the family and genus levels, respectively. The Barlett's test of sphericity was <0.05 in both cases. A significant depletion of Verrucomicrobiaceae, Pedobacter, and Akkermansia, with a higher abundance of Lactobacillaceae, and Lactobacillus was found in the microbiota of SHR group compared to WKY. Losartan treatment tended to restore changes in Verrucomicrobiaceae, Pedobacter, and Akkermansia and significantly restored changes in Lactobacillaceae and Lactobacillus.
3.2. Losartan improved intestinal integrity, α‐defensins production, gut sympathetic tone, and changed MLNs T cell population in SHR
Hypertension is associated with the altered expression of gut tight junction proteins, increased permeability and gut pathology. The ACE inhibitor captopril, which lowers BP in SHR, reverses gut pathology (Santisteban et al., 2017). We also found reduced mRNA levels of barrier‐forming junction proteins (occludin and zonula occludens‐1 (ZO‐1)) in the colon of SHR compared to WKY (Figure 2a). Losartan treatment restored occludin and ZO‐1 mRNA levels in the colon, suggesting an enhanced barrier function. In addition, increased gut permeability in adult hypertensive SHR correlates with reduced goblet cells (Santisteban et al., 2017). Goblet cells produce mucins, which protect the gut from pathogen invasion, thereby regulating gut immune responses (Mowat & Agace, 2014). We also found down‐regulation of mucin (MUC)‐2 transcripts, but not of MUC‐3, in SHR compared with WKY, which was restored by losartan (Figure 2a), suggesting reduced gut permeability. We measured endotoxin levels in plasma and found them to be significantly higher in SHR compared with the WKY group (Figure 2b). Interestingly, long‐term treatment with losartan significantly decreased endotoxaemia in SHR. These results suggest that intestinal permeability is increased in SHR and allowing bacterial components (e.g., LPS) to enter the blood stream. Furthermore, the increased mRNA levels of the colonic pro‐inflammatory cytokines https://www.guidetopharmacology.org/GRAC/LigandDisplayForward?ligandId=5074 and https://www.guidetopharmacology.org/GRAC/LigandDisplayForward?ligandId=4998 (Figure 2c) in SHR were significantly reduced by losartan.
Figure 2.
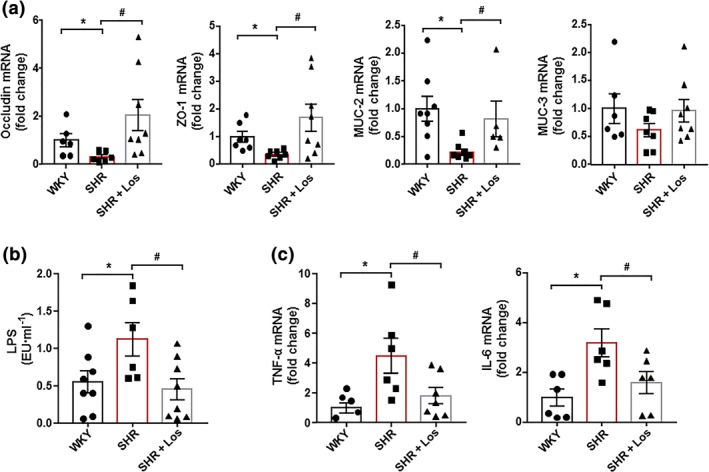
Losartan (Los) induces improvement of gut inflammation and permeability in spontaneously hypertensive rats (SHR). Colonic mRNA levels of occludin, zonula occludens‐1 (ZO‐1), mucin (MUC)‐2, and MUC‐3 (a). Plasma endotoxin concentrations (endotoxin units·ml−1 [EU·ml−1]) (b). Pro‐inflammatory cytokines, TNF‐α, and IL‐6 (c) in Wistar Kyoto rats (WKY), untreated SHR (SHR), and SHR treated with losartan (SHR‐Los). Values are expressed as mean ± SEM (n = 8). * P < .05, significantly different from WKY rats. # P < .05, significantly different from untreated SHR rats
The RAS participates in the regulation of gastrointestinal inflammation (Brzozowski, 2014; Garg et al., 2012) and has been linked to human inflammatory bowel diseases (IBD; Hume et al., 2016). Pharmacological inhibition of the classical RAS with losartan alleviated murine models of IBD, independently of their antihypertensive effects (Liu, Shi, Wang, Zhu, & Zhao, 2016; Wengrower et al., 2012). However, we did not find any changes in the mRNA levels of several RAS components, such as angiotensinogen (AGT), https://www.guidetopharmacology.org/GRAC/ObjectDisplayForward?objectId=1613, and https://www.guidetopharmacology.org/GRAC/ObjectDisplayForward?objectId=1614 (Figure 3a), in colonic samples from all experimental groups, suggesting that the protective effects of losartan in both colonic integrity and inflammation was independent of local RAS inhibition. In the SHR, increased sympathetic nerve activity to the gut altered gut junction proteins Santisteban et al. (2017). We found increased expression of TH, a key enzyme involved in https://www.guidetopharmacology.org/GRAC/LigandDisplayForward?ligandId=484 generation and https://www.guidetopharmacology.org/GRAC/LigandDisplayForward?ligandId=484 content in the gut from SHR, compared to that in the WKY, which was abolished by chronic losartan treatment (Figure 3b). These results suggest that reduced sympathetic tone in the gut could be involved in the protective effects of losartan in the gut.
Figure 3.
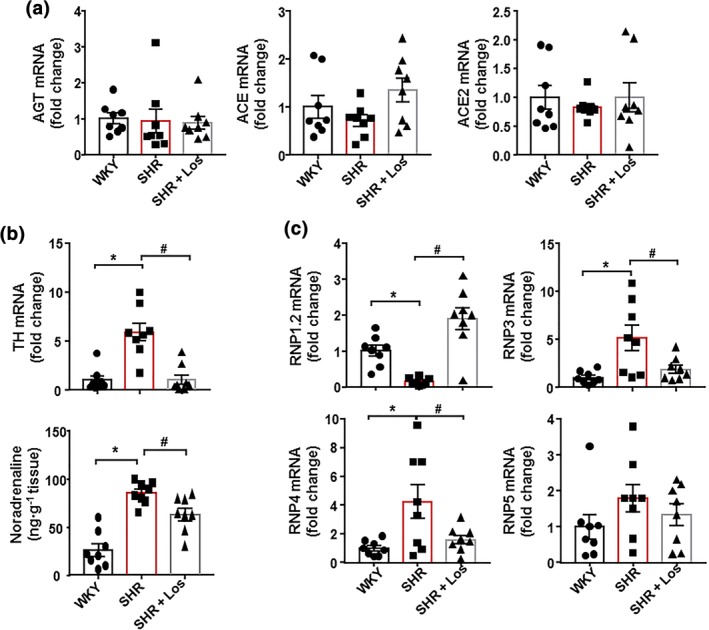
Losartan (Los) induces improvement of α‐defensins production and gut sympathetic tone in spontaneously hypertensive rat (SHR). mRNA levels of several components of the renin‐angiotensin system ‐ angiotensinogen (AGT), ACE, and ACE2. (a). mRNA levels of TH expression and noradrenaline content (b). mRNA levels of α‐defensins (RNP1.2, RNP3, RNP4, and RNP5) in colon from Wistar Kyoto rats (WKY), untreated SHR (SHR), and SHR treated with losartan (SHR‐Los). Values are expressed as mean ± SEM. * P < .05, significantly different from WKY. # P < .05, significantly different from untreated SHR
Epithelial intestinal cells secrete antimicrobial peptides, the α‐defensins, which are cysteine‐rich cationic peptides with antibiotic activity against a wide range of bacteria and other microbes (Bevins, 2005), to maintain the intestinal microbiota composition (Hashimoto et al., 2012). We found reduced mRNA levels of the α‐defensin RNP1‐2 and increased mRNA levels of RNP3 and RNP4, but not that of RNP5, in colon from SHR, compared with the WKY group. Again, losartan treatment restored the mRNA levels of defensins to levels similar to those found in WKY (Figure 3c).
When gut mucosal integrity is decreased, bacteria are able to translocate across the intestinal epithelium leading to activation and migration of https://www.guidetopharmacology.org/GRAC/LigandDisplayForward?ligandId=4469 + cells, such as macrophages and dendritic cells, to draining lymph nodes of the lower intestinal tract (Niess et al., 2005). They also present soluble antigen to naïve CD4+ T cells, leading to T cell activation. We found that the number of total lymphocytes in MLNs was higher in SHR than in WKY (Figure 4), but losartan treatment did not change the lymphocyte content in MLNs. The percentage of Treg (CD4+/FoxP3+) was reduced, whereas the percentage of Th17 (CD4+/IL‐17+) lymphocytes was significantly increased in MLNs in SHR, compared with WKY (Figure 4). Losartan increased only the Treg population in MLNs, without affecting the Th17 cell population.
Figure 4.
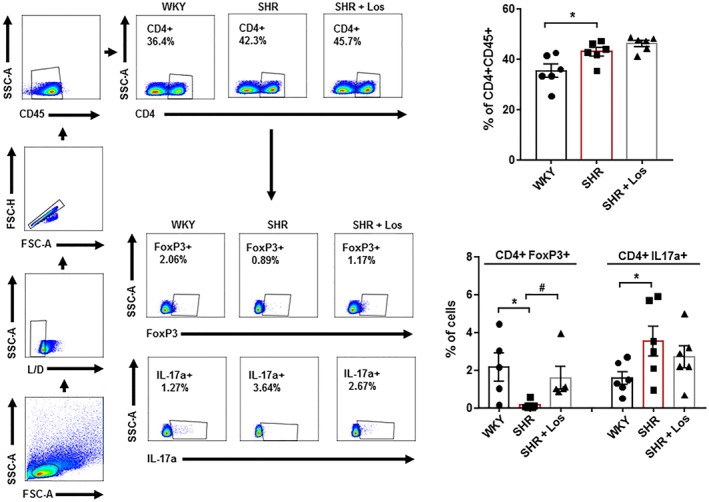
Losartan (Los) induces changes in T cell polarisation in mesenteric lymph nodes in spontaneously hypertensive rats (SHR). Total T cells (CD4+ CD45+), regulatory T cells (Treg; CD4+ FoxP3+), and T helper (Th)‐17 (CD4+ IL‐17a+) cells measured in mesenteric lymph nodes in Wistar Kyoto rats (WKY), SHR, and SHR treated with losartan (SHR‐Los). Values are expressed as mean ± SEM. * P < .05, significantly different from WKY. # P < .05, significantly different from untreated SHR
3.3. Losartan reduces BP and organ target damage and improves vascular NO pathway, oxidative stress, and inflammation
As expected, SHR receiving chronic losartan treatment showed a progressive decrease in SBP (Figure S6A), which was already significant after the first week and was almost normalised after 5 weeks (a decrease of 54.7 ± 9.4 mmHg). No significant differences were found among groups in heart rate (not shown). At the end of the study period, losartan prevented the increase in the left ventricular weight index (≈12%) and in urine protein excretion (≈51%) found in SHR compared with the values in WKY (data not shown).
Aortas from the SHR control group showed strongly reduced endothelium‐dependent vasodilator responses to ACh compared to aortas from the WKY group, which was restored after losartan treatment (Figure S6B). Incubation with L‐NAME in the organ bath abolished the relaxation response to ACh in all experimental groups, involving https://www.guidetopharmacology.org/GRAC/LigandDisplayForward?ligandId=2509 in this relaxation (data not shown). The presence of the non‐selective NADPH oxidase inhibitor apocynin in the organ bath increased the relaxation response to ACh in untreated SHR, reaching similar relaxation percentages to those found in WKY (Figure S6B), suggesting that an increased NADPH oxidase activity is involved, at least in part, in the impaired relaxation to ACh in aorta from SHR. In addition, no differences were observed among groups in the endothelium‐independent vasodilator responses to the NO donor sodium nitroprusside in aortic rings, excluding changes in the NO pathway in smooth muscle (data not shown). Rings from SHR showed both marked increased ROS content (Figure S6C), measured by red staining to ethidium in vascular wall (≈27%), and NADPH oxidase activity (Figure S6D) compared to WKY, which were suppressed by losartan.
The infiltration of T cells and macrophages measured by immunofluorescence was higher in aorta from SHR than those from WKY and was decreased by losartan treatment (Figure 5a). We also analysed the transcript level of transcription factor FoxP3, retinoid‐related orphan receptor‐γ (RORγ), T‐bet, and GATA3, as markers of accumulation of Treg, Th17, Th1, and Th2, respectively, in aorta from all experimental groups (Figure 5b). Aortic Th17, Th1, and Th2 contents were increased in the SHR group, whereas Treg content was reduced. Aortas from the SHR‐losartan group showed levels of T cells similar to those found in WKY (Figure 5b). The mRNA expression of pro‐inflammatory cytokines https://www.guidetopharmacology.org/GRAC/LigandDisplayForward?ligandId=4982, https://www.guidetopharmacology.org/GRAC/LigandDisplayForward?ligandId=4968 and https://www.guidetopharmacology.org/GRAC/LigandDisplayForward?ligandId=5074 was higher, whereas the mRNA levels of anti‐inflammatory https://www.guidetopharmacology.org/GRAC/LigandDisplayForward?ligandId=4975 were lower in aortic homogenates from SHR than in WKY. Losartan treatment significantly suppressed these changes (Figure 5c).
Figure 5.
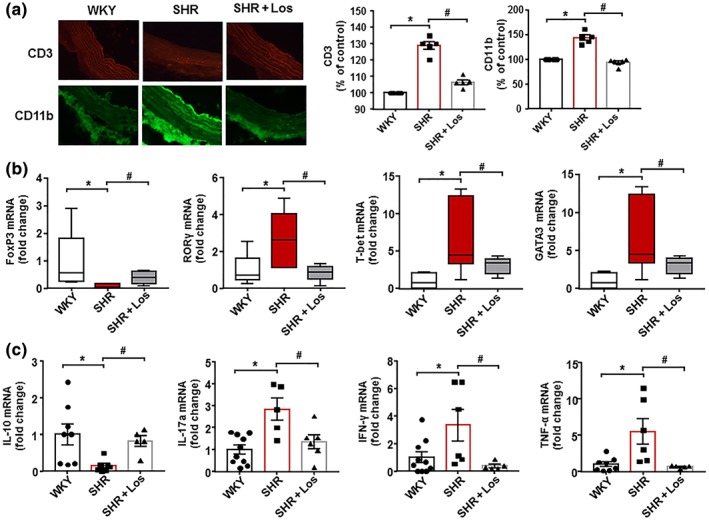
Losartan (Los) induces improvement of macrophage and T cell infiltration in vascular wall from spontaneously hypertensive rats (SHR). The upper pictures show aortic T cell infiltration measured by immunostaining of CD3 (red fluorescence). The lower pictures show aortic macrophage infiltration measured by immunostaining of CD11b (green fluorescence; 400× magnification). Data shown are individual values with means ± SEM of the red or green fluorescence (a). In (b),T cell infiltration in aortas from all experimental groups measured by mRNA levels of regulatory T cells (Treg; FoxP3), T helper (Th)17; RORγ), Th1 (T‐bet), and Th2 (GATA‐3) cells. Data are shown as box and whisker plots with medians, quartiles (box) and total range (whisker). In (c), mRNA levels of IL‐10, IL‐17a, IFN‐γ, and TNF‐α in aortas from Wistar Kyoto rats (WKY), SHR, and SHR treated with losartan (SHR‐Los). Values are expressed as mean ± SEM. * P < .05, significantly different from WKY. # P < .05, significantly different from untreated SHR
3.4. Hydralazine reduced BP and cardiac hypertrophy and improved endothelial function but did not restore gut microbiota and gut integrity
To differentiate between the effects of blocking AT1 receptors and of lowering arterial pressure, the effect of hydralazine, another vasodilator, antihypertensive drug, on gut microbiota was tested. This drug also reduced SBP, showing significant changes at the first week of treatment and reaching a decrease of 73.4 ± 7.6 mmHg after 5 weeks, similar to that induced by losartan (Figure 6a). In contrast, hydralazine significantly increased heart rate (Figure 6b), suggesting increased sympathetic activity. Hydralazine treatment also reduced left ventricular hypertrophy (Figure 6c), improved the endothelium‐dependent relaxation to ACh (Figure 6d), and reduced the vascular NADPH oxidase activity (Figure 6e).
Figure 6.
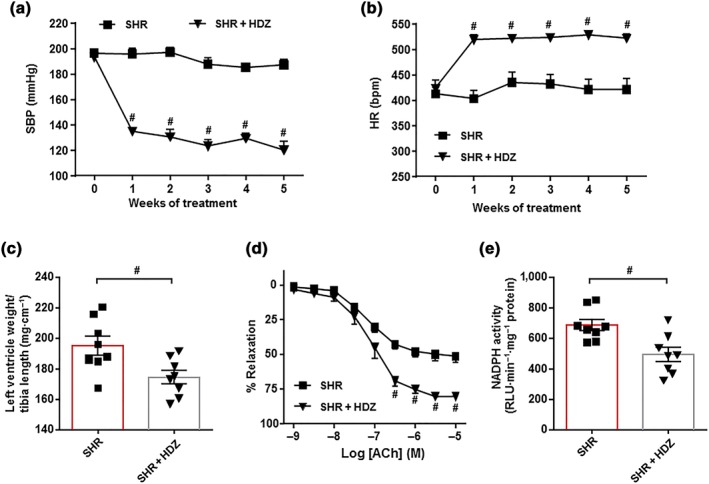
Protective effects of hydralazine (HDZ) in endothelial dysfunction and hypertension in spontaneously hypertensive rats (SHR). Time course of systolic BP (SBP, a) and heart rate (HR, b) measured by tail‐cuff plethysmography in SHR treated with the hydralazine or saline. Morphological data from the left ventricle (c). Endothelium‐dependent relaxation induced by ACh in aortas pre‐contracted by phenylephrine (d) and NADPH oxidase activity measured by lucigenin‐enhanced chemiluminescence (e) in aorta from SHR and SHR + HDZ groups. Values are represented as means ± SEM (n = 8). # P < .05, significantly different from untreated SHR
The composition of the bacterial community after hydralazine was evaluated. The major ecological parameters were not altered by hydralazine treatment. Only a reduced Shannon diversity was found in the SHR‐hydralazine group, compared to SHR (Figure 7a). An unclear separation was observed in the PCA between the two clusters representing the microbial compositions of SHR and SHR‐hydrazine groups, indicating two similar gut environments (Figure 7b). The key bacterial populations that are responsible for discriminating among groups were in the phylum Bacteroidetes (loading 0.74). The KMO test was 0.71, indicating a middling sampling. The Barlett's test of sphericity was <0.05. In addition, the proportion of bacteria among phyla (Figure 7c), the F/B ratio (Figure 7d), the proportion of SCFAs‐producing bacteria (Figure 7e), and the percentage of strict anaerobic bacteria (Figure 7f) were similar between both groups, showing that hydralazine did not alter gut dysbiosis, despite its antihypertensive effect.
Figure 7.
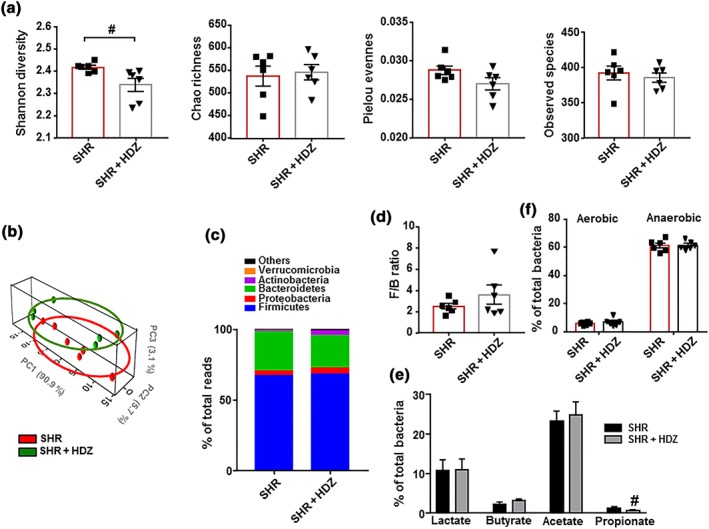
Hydralazine (HDZ) does not induce changes in the gut microbiota composition in spontaneously hypertensive rat (SHR). The microbial DNA from faecal samples was analysed by 16S rRNA gene sequencing. To evaluate general differences of microbial composition amongst all experimental groups, diversity, richness, evenness, and observed species (a) were examined. Principal coordinate analysis in the gut microbiota from all experimental groups (b). Phylum breakdown of the five most abundant bacterial communities in samples from all groups (c). The Firmicutes/Bacteroidetes ratio (F/B ratio) was calculated as a biomarker of gut dysbiosis (d). Relative proportions of anaerobic and aerobic bacteria (f), and lactate‐, butyrate‐, acetate‐, and propionate‐producing bacteria expressed as relative proportions (e) in the gut microbiota in all experimental groups are shown. Values are represented as mean ± SEM. # P < .05, significantly different from untreated SHR
In the gut, hydralazine treatment did not change the mRNA levels of the RAS components (data not shown), but it increased TH expression and the content of https://www.guidetopharmacology.org/GRAC/LigandDisplayForward?ligandId=484 (Figure 8a), suggesting higher colonic sympathetic drive. In addition, no significant modifications were induced by hydralazine in mRNA levels of barrier‐forming junction proteins and mucins (Figure 8b), showing that this drug did not improve gut integrity. Furthermore, expression of colonic α‐defensins was not restored by hydralazine (Figure 8c).
Figure 8.
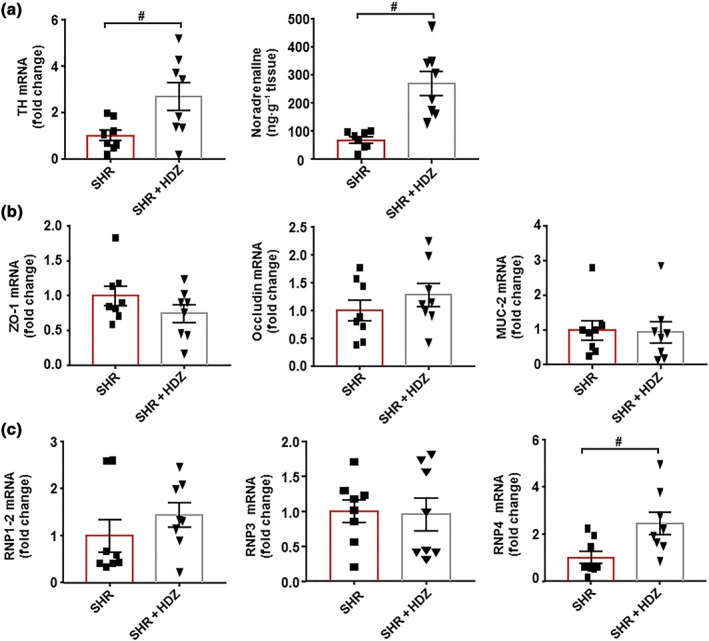
Effects of hydralazine (HDZ) on the sympathetic tone and gut integrity in spontaneously hypertensive rats (SHR). Colonic mRNA levels of TH and noradrenaline levels (a). Zonula occludens‐1 (ZO‐1), occluding, mucin (MUC)‐2 (b), and α‐defensins, RNP1.2, RNP3, and RNP4 (c) measured by RT‐PCR in the colon from all experimental groups. Values are represented as mean ± SEM. # P < .05, significantly different from untreated SHR
3.5. Faecal microbiota transplantation (FMT) from SHR‐losartan reduces BP and improves endothelial function in SHR
To test if changes in gut microbiota composition induced by a chronic treatment with losartan were involved in their antihypertensive effects, an FMT from SHR treated with losartan to untreated SHR was performed and compared to FMT from an untreated SHR to another untreated SHR. We found a significant decrease of 16.6 ± 7.0 mmHg in SBP after 2 weeks of FMT from SHR‐losartan to SHR, whereas no changes in SBP were found when FMT was performed from SHR to SHR (Figure 9a). In addition, an improvement of the endothelium‐dependent relaxation to ACh (Figure 9b) and a reduced NADPH oxidase activity (Figure 9c) were also induced by faecal transplantation from SHR treated with losartan. These vascular changes were linked to both increased Treg and decreased Th17 cells population in the vascular wall (Figure 9d). In addition, FMT from SHR‐losartan to SHR increased colonic ZO‐1 and MUC‐2 expression (Figure 10a) and reduced colonic TH mRNA level (Figure 10b), suggesting an improvement of gut integrity and gut sympathetic tone. In addition, increased Treg cells in MLNs were detected in S‐SLOS group compared to S‐S (Figure 10c), indicating that microbiota from SHR treated with losartan induced positive changes in this secondary lymph organ in the gut.
Figure 9.
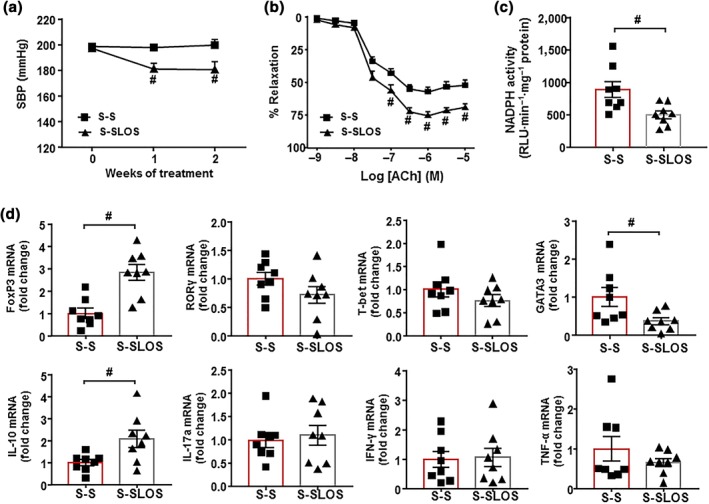
Effects of faecal microbiota transplantation from spontaneously hypertensive rat (SHR)‐losartan to SHR on vascular function in SHR. Time course of systolic BP (SBP), measured by tail‐cuff plethysmography, in SHR with stool transplant from SHR (S‐S) or from SHR treated with losartan (S‐SLOS, a). Endothelium‐dependent relaxation induced by ACh (ACh) in aortas pre‐contracted by phenylephrine (b) and NADPH oxidase activity measured by lucigenin‐enhanced chemiluminescence in aorta from S‐S, S‐SLOS (c). mRNA levels of regulatory T cells (Treg; FoxP3), T helper (Th‐17; RORγ), Th1 (T‐bet), and Th2 (GATA‐3) cells and mRNA levels of IL‐10, IL‐17a, IFN‐γ, and TNF‐α (d) in aortas from the S‐S and S‐SLOS groups. Values are represented as mean ± SEM. # P < .05, significantly different from the S‐S group
Figure 10.
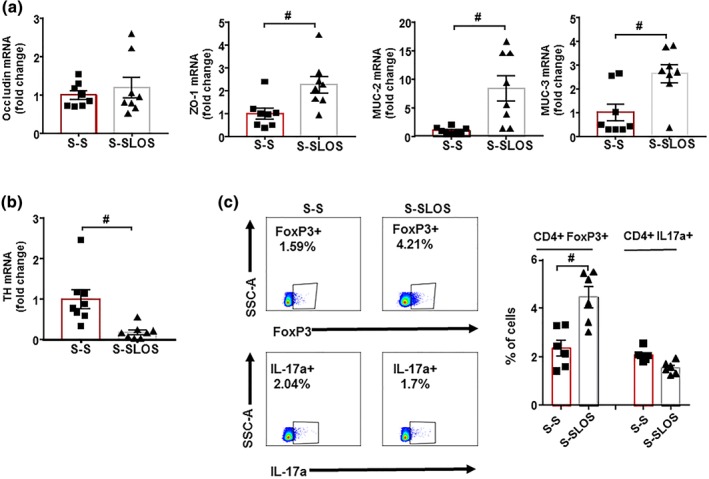
Effects induced by faecal microbiota transplantation from spontaneously hypertensive rats (SHR)‐losartan on gut integrity and gut sympathetic activity. mRNA levels of occludin, zonula occludens‐1 (ZO‐1), mucin (MUC)‐2, MUC‐3 (a), and TH (b) measured by RT‐PCR in colon from all experimental groups. Regulatory T cells (Treg) and T helper (Th)‐17 measured in mesenteric lymph nodes from all S‐S and S‐SLOS groups by flow cytometry. Values are represented as mean ± SEM. # P < .05, significantly different from the S‐S group
It has been reported that 60% losartan can be found in faeces, and the donor samples could contain the drug. However, a concentration of 0.60 μg·ml−1 of losartan was detected in faeces from the SHR‐losartan group, which was equivalent to a losartan dose of 0.15 μg kg−1. This finding excludes the possibility that the observed effects in S‐SLOS group were related to direct actions of the drug. As expected, losartan was not detected in faecal samples from untreated SHR.
At the end of the experiment, the composition of faecal microbiota was analysed. The bacterial communities evaluated by calculating major ecological parameters (Chao richness, Pielou evenness, Shannon diversity, and the number of observed species) were similar between both groups (data not shown). The proportion of bacteria from the Fimicutes and Verrucomicrobia phyla was significantly lower, whereas the proportions of Bacteroidetes were higher in S‐SLOS than in S‐S group (Figure S7A). The F/B ratio was also lower in S‐SLOS group (Figure S7B). In addition, significant lower percentages of lactate‐ and propionate‐producing bacteria, and a higher percentage of acetate‐producing bacteria, were found in S‐SLOS compared to S‐S (Figure S7C). Moreover, the percentage of strict anaerobic bacteria was significantly higher in S‐SLOS compared to S‐S (Figure S7D).
Figure S8 shows the bacterial taxa in which there were marked changes. The relative abundance of 30 taxa was increased (green) and 64 taxa were decreased (red) in the S‐SLOS group, compared to those in the S‐S group. A clear separation was observed in the PCA between the two clusters representing the microbial compositions of S‐S and S‐SLOS groups (Figure S9A). The key bacterial populations that are responsible for discriminating among groups are the genus Bacteroides (loading 0.56). The KMO test was 0.84, indicating a meritorious sampling. The Barlett's test of sphericity was <0.05. Bacterial genera were associated with changes in the composition of microbiota (Figure S9B). A significant reduction of Oscillospira, with a higher abundance of Bacteroides, Prevotella, and Clostridium was found in the microbiota of S‐SLOS group compared to S‐S (Figure S9C). Interestingly, increased proportion of Bacteroides acidifaciens was detected as main strain in the S‐SLOS group (Figure S9D).
4. DISCUSSION
The main new findings of this study are the following: (a) Chronic losartan treatment reduced gut dysbiosis in SHR; (b) changes in the composition of the gut microbiota, induced by losartan were independent of its BP reducing effects and seemed to be related to improvement of gut integrity and the normalisation of colonic α‐defensins production, as a result of reduced gut sympathetic drive; and (c) the microbiota in SHR‐losartan rats was able to improve gut integrity and aortic endothelial dysfunction and to reduce BP in rats with genetic hypertension.
Abundant evidence has demonstrated an association between gut dysbiosis and hypertension (Li et al., 2017; Mell et al., 2015; Sun et al., 2019; Toral et al., 2019b, 2019a; Yang et al., 2015). Our results are consistent with the main features of dysbiotic microbiota described in SHR (Toral et al., 2019b, 2019a; Yang et al., 2015; Yang et al., 2019): (a) a reduced richness and diversity, (b) an increased F/B ratio, and (c) a reduction in acetate‐ and propionate‐producing bacteria, with higher proportion of lactate‐producing bacteria. Losartan treatment tended to increase richness and diversity, whereas separated bacteria clusters from SHR towards WKY, normalised F/B ratio, and SCFAs‐producing bacteria. The increased abundance of Lactobacillus ssp. found in SHR samples was also normalised. All these changes induced by losartan in microbiota were linked to reduced BP, improvement of left ventricle hypertrophy, reduced vascular oxidative status and accumulation of pro‐inflammatory lymphocytes, and improvement of endothelial dysfunction.
Losartan may elicit changes in gut microbiota by several mechanisms. It has been commonly observed that a change in the host health status has been accompanied by a shift in the gut microbiota. Therefore, microbiota could be adapted to BP reduction, shifting to a microbiota composition similar to WKY. However, our results are contrary to this hypothesis because hydralazine, which reduced BP as much as losartan, did not alter dysbiosis in SHR. Changes in gut microbiota composition have been associated with gut integrity (Kim et al., 2018). The epithelial cells of the mammalian digestive tract create a tight barrier in the gut, contributing to the hypoxic environment of the lumen. Damage to this barrier makes the environment less hypoxic and thus, more conducive to aerobic bacterial growth (Earley et al., 2015; Konig et al., 2016). In fact, the intestines of angiotensin II‐hypertensive mice were significantly less hypoxic and with increased aerobic bacteria in faeces (Kim et al., 2018). We also found decreased abundance of anaerobic bacteria in faeces from SHR, which was associated with loss of gut integrity. SHR treated with losartan showed increase colonic integrity and a proportion of strict anaerobic bacteria similar to WKY, whereas hydralazine was unable to improve both gut integrity and the proportion of anaerobic bacteria. These data support the key role of gut integrity in the composition of intestinal microbiota. In addition, intestinal epithelial cells and Paneth cells secrete antimicrobial peptides, such as defensins, which selectively kill Gram‐positive bacteria (Ayabe et al., 2000; Pamer, 2007; Vaishnava, Behrendt, Ismail, Eckmann, & Hooper, 2008; Vora et al., 2004). Components of the microbiota, such as LPS, are recognised by https://www.guidetopharmacology.org/GRAC/FamilyDisplayForward?familyId=316 expressed by these intestinal cells and trigger production and secretion of these defensins. We found changes in mRNA levels of defensins in colonic samples from SHR compared to WKY, which might also be involved in changes in microbiota found in these hypertensive rats. Losartan restored defensins expression to levels similar to those found in WKY, whereas hydralazine did not alter the expression of RNP1‐2 and RPN3 and enhanced the increased expression of RNP4 found in SHR, suggesting a role of defensins in the different changes in gut microbiota induced by both drugs.
Angiotensin receptor antagonists have anti‐inflammatory properties in the gut by blocking the angiotensin https://www.guidetopharmacology.org/GRAC/ObjectDisplayForward?objectId=34 (Takeshita & Murohara, 2014). Inhibition of the classical RAS pathway is also involved in the up‐regulation of ACE2, which activates the https://www.guidetopharmacology.org/GRAC/LigandDisplayForward?ligandId=582/https://www.guidetopharmacology.org/GRAC/ObjectDisplayForward?objectId=150 pathway to counteract inflammatory signalling (Yisireyili et al., 2018). In our study, no significant changes in AGT, ACE, and ACE2 expression were found among colonic samples from WKY, SHR, and SHR‐losartan groups ruling out changes in this pathway as contributors to the protective effects of losartan in gut integrity. Our current study is consistent with that of Santisteban et al. (2017), demonstrating an increased gut sympathetic drive (increased TH expression and https://www.guidetopharmacology.org/GRAC/LigandDisplayForward?ligandId=484 accumulation) associated with loss of gut integrity and microbial dysbiosis in SHR. Recently, the hypothesis posing the presence of a brain–gut communication driven by a sympathetic system has been reinforced. Central administration of a modified tetracycline inhibited microglial activation, normalised sympathetic activity, attenuated pathological alterations in gut wall, restored certain gut microbial communities altered by angiotensin II, and reduced BP (Sharma et al., 2019). Our data also support the proposal that gut sympathetic drive is a key regulator of gut integrity and microbiota composition. It is pertinent to note that sympathetic tone in SHR is attenuated by RAS inhibition (Demirci, McKeown, & Bayraktutan, 2005; Santisteban et al., 2017; Tsuda et al., 1988) and increased by hydralazine (Tsoporis & Leenen, 1988). In fact, losartan treatment reduced sympathetic activity in the colon, improving gut integrity and reducing gut dysbiosis, whereas hydralazine (which increased gut sympathetic drive) was unable to restore gut integrity and microbiota composition.
Normal microbiota can regulate the immune system and/or gut–brain communication, thus reducing BP. Karbach et al. (2016) showed that angiotensin II infusion to germ‐free mice reduced ROS formation in the vasculature, attenuated vascular expression of NADPH oxidase subunit Nox2, and reduced up‐regulation of RORγ, the signature transcription factor for IL‐17 synthesis in the aortic vessel wall. These vascular changes provided protection from endothelial dysfunction and attenuation of BP increase in response to angiotensin II, involving the immune system in the effects of microbiota in vascular function and BP regulation. We have recently described that FMT from WKY to SHR reduced neuroinflammation, sympathetic nervous system activity, and BP (Toral et al., 2019a). In addition, the antihypertensive effect of the ACE inhibitor captopril has sustained influence on the brain–gut axis even after the withdrawal of captopril (Yang et al., 2019). When we explore the effects of FMT from donors SHR‐losartan to receptors SHR, we found decreased F/B ratio, thus improving gut dysbiosis, and increased the prevalence of acetate‐producing bacteria and those of the genus Bacteroides acidifaciens. This bacterium was recently associated with reduced SBP in DOCA‐salt hypertension (Marques et al., 2017). In addition, it prevented obesity and improved insulin sensitivity in mice (Yang et al., 2017), but whether it can prevent the development of high BP in mono‐colonised animal is yet to be determined. These changes in gut microbiota were accompanied by a reduced BP, an improvement of endothelial dysfunction, and a reduction of aortic NADPH oxidase activity linked to increased aortic Tregs infiltration without changes in Th17 cells. IL‐10, the main cytokine released by Tregs, attenuates NADPH oxidase activity, which is a critical process in the improvement of vascular endothelial function in hypertension (Kassan et al., 2011). The changes in T cell infiltration in the vascular wall were similar to that found in MLNs, suggesting that a regulation in T cell population in this secondary lymph organ of the gut, by microbiota is involved in the antihypertensive effects of losartan. In fact, microbial metabolites, such as acetate, derived from acetate‐producing bacteria in S‐SLOS, might promote T cell differentiation into Tregs cells (Park et al., 2015), leading to reduced BP.
In conclusion, we have found for the first time that losartan treatment reduced gut dysbiosis in SHR. This effect seems to be related to its capacity to reduce sympathetic drive in the gut, improving gut integrity and production of defensins. The changes induced by losartan in gut microbiota contributed, at least in part, to protecting the vasculature and reducing BP, possibly by modulating the gut immune system (Figure S10). No sex differences have been described in the antihypertensive effects of angiotensin receptor antagonists in humans. However, if the effects of losartan are sex‐independent deserves further investigation in female SHR.
AUTHOR CONTRIBUTIONS
J.D. conceived and designed the research. I.R.V., M.T., N.V.P., M.S., M.G.G., R.M., F.A., and M.R. performed the experiments and analysed the data. R.J., J.G., J.M.R., and J.D. interpreted the results. I.R.V., M.T., and R.J. prepared the figures. J.D. drafted this manuscript. I.R.V., M.T., R.J., J.G., J.M.R., and J.D. edited and revised the manuscript. All authors approved the final version of manuscript.
CONFLICT OF INTEREST
The authors declare no conflict of interest.
DECLARATION OF TRANSPARENCY AND SCIENTIFIC RIGOUR
This https://bpspubs.onlinelibrary.wiley.com/doi/full/10.1111/bph.13405 acknowledges that this paper adheres to the principles for transparent reporting and scientific rigour of preclinical research as stated in the BJP guidelines for https://bpspubs.onlinelibrary.wiley.com/doi/full/10.1111/bph.14207, https://doi.org/10.1111/bph.14208, and https://bpspubs.onlinelibrary.wiley.com/doi/full/10.1111/bph.14207, and as recommended by funding agencies, publishers and other organisations engaged with supporting research.
Supporting information
Table S1. Primers for real‐time RT‐PCR.
Figure S1. Losartan (Los) does not induce changes in the microecological parameters of gut microbiota of spontaneously hypertensive rats (SHR).
Figure S2. Distinct changes in the gut microbiota between Wistar Kyoto rats (WKY) and spontaneously hypertensive rats (SHR).
Figure S3. Losartan (Los) induced different behaviors of gut microbiota in spontaneously hypertensive rats (SHR).
Figure S4. Losartan (Los) induced changes at the family level in the gut microbiota of spontaneously hypertensive rats (SHR).
Figure S5. Losartan (Los) induced changes at the genus level in the gut microbiota of spontaneously hypertensive rats (SHR).
Figure S6. Protective effects of Losartan (Los) in vascular function and oxidative stress in spontaneously hypertensive rats (SHR).
Figure S7. Effects of faecal microbiota transplantation from spontaneously hypertensive rat (SHR)‐losartan to SHR on different behaviours of the gut microbiota of SHR.
Figure S8. Comparisons of gut microbiome changes in SHR with stool transplant from SHR (S‐S) versus from SHR treated with losartan (S‐SLOS).
Figure S9. Effects of faecal microbiota transplantation from spontaneously hypertensive rat (SHR)‐losartan at the genus level in the gut microbiota of SHR.
Figure S10. Summary of mechanistic changes involving gut microbiota in the antihypertensive effects of Losartan in spontaneously hypertensive rat.
ACKNOWLEDGEMENTS
This work was supported by grants from Comisión Interministerial de Ciencia y Tecnología, Ministerio de Economía y competitividad (SAF2017‐84894‐R, SAF2014‐55523‐R, and AGL2015‐67995‐C3‐3‐R), Junta de Andalucía (Proyecto de excelencia P12‐CTS‐2722, AGR‐6826, and CTS‐164) with funds from the European Union, and by the Ministerio de Economia y Competitividad, Instituto de Salud Carlos III (CIBER‐CV and CIBER‐EHD), Spain. M.T. is a postdoctoral fellow of Sara Borrell. R.M. is a postdoctoral fellow of CIBERCV. I.R.V. is a predoctoral fellow of MINECO. The cost of this publication was paid in part with funds from the European Union (Fondo Europeo de Desarrollo Regional FEDER). The authors acknowledge Nutraceutical Translations for English language editing of this manuscript.
Robles‐Vera I, Toral M, de la Visitación N, et al. Changes to the gut microbiota induced by losartan contributes to its antihypertensive effects. Br J Pharmacol. 2020;177:2006–2023. 10.1111/bph.14965
Iñaki Robles‐Vera and Marta Toral contributed equally as first authors.
REFERENCES
- Adnan, S. , Nelson, J. W. , Ajami, N. J. , Venna, V. R. , Petrosino, J. F. , Bryan, R. M. Jr. , & Durgan, D. J. (2017). Alterations in the gut microbiota can elicit hypertension in rats. Physiological Genomics, 49(2), 96–104. 10.1152/physiolgenomics.00081.2016 [DOI] [PMC free article] [PubMed] [Google Scholar]
- Alexander, S. P. H. , Christopoulos, A. , Davenport, A. P. , Kelly, E. , Mathie, A. , Peters, J. A. , … Collaborators, C. G. T. P. (2019). The Concise Guide to 2019/20: G protein‐coupled receptors. British Journal of Pharmacology, 176, S21–S141. 10.1111/bph.14748 [DOI] [PMC free article] [PubMed] [Google Scholar]
- Alexander, S. P. H. , Fabbro, D. , Kelly, E. , Mathie, A. , Peters, J. A. , Veale, E. L. , … Collaborators, C. G. T. P. (2019a). The Concise Guide to PHARMACOLOGY 2019/20: Catalytic receptors. British Journal of Pharmacology, 176, S247–S296. 10.1111/bph.14751 [DOI] [PMC free article] [PubMed] [Google Scholar]
- Alexander, S. P. H. , Fabbro, D. , Kelly, E. , Mathie, A. , Peters, J. A. , Veale, E. L. , … Collaborators, C. G. T. P. (2019b). The Concise Guide to PHARMACOLOGY 2019/20: Enzymes. British Journal of Pharmacology, 176, S297–S396. 10.1111/bph.14752 [DOI] [PMC free article] [PubMed] [Google Scholar]
- Ayabe, T. , Satchell, D. P. , Wilson, C. L. , Parks, W. C. , Selsted, M. E. , & Ouellette, A. J. (2000). Secretion of microbicidal α‐defensins by intestinal Paneth cells in response to bacteria. Nature Immunology, 1(2), 113–118. 10.1038/77783 [DOI] [PubMed] [Google Scholar]
- Barhoumi, T. , Kasal, D. A. , Li, M. W. , Shbat, L. , Laurant, P. , Neves, M. F. , … Schiffrin, E. L. (2011). T regulatory lymphocytes prevent angiotensin II‐induced hypertension and vascular injury. Hypertension, 57(3), 469–476. 10.1161/HYPERTENSIONAHA.110.162941 [DOI] [PubMed] [Google Scholar]
- Bevins, C. L. (2005). Events at the host‐microbial interface of the gastrointestinal tract. V. Paneth cell α‐defensins in intestinal host defense. American Journal of Physiology. Gastrointestinal and Liver Physiology, 289(2), G173–G176. [DOI] [PubMed] [Google Scholar]
- Brzozowski, T. (2014). Role of renin‐angiotensin system and metabolites of angiotensin in the mechanism of gastric mucosal protection. Current Opinion in Pharmacology, 19, 90–98. 10.1016/j.coph.2014.08.007 [DOI] [PubMed] [Google Scholar]
- Caporaso, J. G. , Lauber, C. L. , Walters, W. A. , Berg‐Lyons, D. , Lozupone, C. A. , Turnbaugh, P. J. , … Knight, R. (2011). Global patterns of 16S rRNA diversity at a depth of millions of sequences per sample. Proceedings of the National Academy of Sciences of the United States of America, 108(Suppl 1), 4516–4522. 10.1073/pnas.1000080107 [DOI] [PMC free article] [PubMed] [Google Scholar]
- Chow, J. , Lee, S. M. , Shen, Y. , Khosravi, A. , & Mazmanian, S. K. (2010). Host‐bacterial symbiosis in health and disease. Advances in Immunology, 107, 243–274. 10.1016/B978-0-12-381300-8.00008-3 [DOI] [PMC free article] [PubMed] [Google Scholar]
- Curtis, M. J. , Alexander, S. , Cirino, G. , Docherty, J. R. , George, C. H. , Giembycz, M. A. , … Ahluwalia, A. (2018). Experimental design and analysis and their reporting II: Updated and simplified guidance for authors and peer reviewers. British Journal of Pharmacology, 175, 987–993. 10.1111/bph.14153 [DOI] [PMC free article] [PubMed] [Google Scholar]
- Demirci, B. , McKeown, P. P. , & Bayraktutan, U. (2005). Blockade of angiotensin II provides additional benefits in hypertension‐ and ageing‐related cardiac and vascular dysfunctions beyond its blood pressure‐lowering effects. Journal of Hypertension, 23(12), 2219–2227. [DOI] [PubMed] [Google Scholar]
- Earley, Z. M. , Akhtar, S. , Green, S. J. , Naqib, A. , Khan, O. , Cannon, A. R. , … Choudhry, M. A. (2015). Burn injury alters the intestinal microbiome and increases gut permeability and bacterial translocation. PLoS ONE, 10(7), e0129996 10.1371/journal.pone.0129996 [DOI] [PMC free article] [PubMed] [Google Scholar]
- Edgar, R. C. , & Flyvbjerg, H. (2015). Error filtering, pair assembly and error correction for next‐generation sequencing reads. Bioinformatics, 31(21), 3476–3482. 10.1093/bioinformatics/btv401 [DOI] [PubMed] [Google Scholar]
- Everard, A. , & Cani, P. D. (2013). Diabetes, obesity and gut microbiota. Best Practice & Research. Clinical Gastroenterology, 27(1), 73–83. 10.1016/j.bpg.2013.03.007 [DOI] [PubMed] [Google Scholar]
- Garg, M. , Angus, P. W. , Burrell, L. M. , Herath, C. , Gibson, P. R. , & Lubel, J. S. (2012). Review article: The pathophysiological roles of the renin‐angiotensin system in the gastrointestinal tract. Alimentary Pharmacology & Therapeutics, 35(4), 414–428. 10.1111/j.1365-2036.2011.04971.x [DOI] [PMC free article] [PubMed] [Google Scholar]
- Gomez‐Guzman, M. , Jimenez, R. , Sanchez, M. , Romero, M. , O'Valle, F. , Lopez‐Sepulveda, R. , … Duarte, J. (2011). Chronic (−)‐epicatechin improves vascular oxidative and inflammatory status but not hypertension in chronic nitric oxide‐deficient rats. The British Journal of Nutrition, 106(9), 1337–1348. 10.1017/S0007114511004314 [DOI] [PubMed] [Google Scholar]
- Gomez‐Guzman, M. , Toral, M. , Romero, M. , Jimenez, R. , Galindo, P. , Sanchez, M. , … Duarte, J. (2015). Antihypertensive effects of probiotics Lactobacillus strains in spontaneously hypertensive rats. Molecular Nutrition & Food Research, 59(11), 2326–2336. 10.1002/mnfr.201500290 [DOI] [PubMed] [Google Scholar]
- Harding, S. D. , Sharman, J. L. , Faccenda, E. , Southan, C. , Pawson, A. J. , Ireland, S. , … NC‐IUPHAR. NC‐IUPHAR (2018). The IUPHAR/BPS Guide to pharmacology in 2018: Updates and expansion to encompass the new guide to immunopharmacology. Nucleic Acids Research, 46, D1091–D1106. 10.1093/nar/gkx1121 [DOI] [PMC free article] [PubMed] [Google Scholar]
- Hashimoto, T. , Perlot, T. , Rehman, A. , Trichereau, J. , Ishiguro, H. , Paolino, M. , … Penninger, J. M. (2012). ACE2 links amino acid malnutrition to microbial ecology and intestinal inflammation. Nature, 487(7408), 477–481. 10.1038/nature11228 [DOI] [PMC free article] [PubMed] [Google Scholar]
- Howitt, M. R. , & Garrett, W. S. (2012). A complex microworld in the gut: Gut microbiota and cardiovascular disease connectivity. Nature Medicine, 18(8), 1188–1189. 10.1038/nm.2895 [DOI] [PubMed] [Google Scholar]
- Hume, G. E. , Doecke, J. D. , Huang, N. , Fowler, E. V. , Brown, I. S. , Simms, L. A. , & Radford‐Smith, G. L. (2016). Altered expression of angiotensinogen and mediators of angiogenesis in ileal Crohn's disease. Journal of Gastrointestinal and Liver Diseases, 25(1), 39–48. 10.15403/jgld.2014.1121.251.chr [DOI] [PubMed] [Google Scholar]
- Karbach, S. H. , Schonfelder, T. , Brandao, I. , Wilms, E. , Hormann, N. , Jackel, S. , … Wenzel, P. (2016). Gut microbiota promote angiotensin II‐induced arterial hypertension and vascular dysfunction. Journal of the American Heart Association, 5(9), e003698 10.1161/JAHA.116.003698 [DOI] [PMC free article] [PubMed] [Google Scholar]
- Kassan, M. , Galan, M. , Partyka, M. , Trebak, M. , & Matrougui, K. (2011). Interleukin‐10 released by CD4+CD25+ natural regulatory T cells improves microvascular endothelial function through inhibition of NADPH oxidase activity in hypertensive mice. Arteriosclerosis Thrombosis and Vascular Biology, 31(11), 2534–2542. 10.1161/ATVBAHA.111.233262 [DOI] [PMC free article] [PubMed] [Google Scholar]
- Kim, S. , Goel, R. , Kumar, A. , Qi, Y. , Lobaton, G. , Hosaka, K. , … Raizada, M. K. (2018). Imbalance of gut microbiome and intestinal epithelial barrier dysfunction in patients with high blood pressure. Clinical Science (London, England), 132(6), 701–718. 10.1042/CS20180087 [DOI] [PMC free article] [PubMed] [Google Scholar]
- Kilkenny, C. , Browne, W. , Cuthill, I. C. , Emerson, M. , & Altman, D. G. (2010). Animal research: Reporting in vivo experiments: The ARRIVE guidelines. British Journal of Pharmacology, 160, 1577–1579. [DOI] [PMC free article] [PubMed] [Google Scholar]
- Konig, J. , Wells, J. , Cani, P. D. , Garcia‐Rodenas, C. L. , MacDonald, T. , Mercenier, A. , … Brummer, R. J. (2016). Human intestinal barrier function in health and disease. Clinical and Translational Gastroenterology, 7(10), e196 10.1038/ctg.2016.54 [DOI] [PMC free article] [PubMed] [Google Scholar]
- Li, J. , Zhao, F. , Wang, Y. , Chen, J. , Tao, J. , Tian, G. , … Cai, J. (2017). Gut microbiota dysbiosis contributes to the development of hypertension. Microbiome, 5(1), 14 10.1186/s40168-016-0222-x [DOI] [PMC free article] [PubMed] [Google Scholar]
- Liu, T. J. , Shi, Y. Y. , Wang, E. B. , Zhu, T. , & Zhao, Q. (2016). AT1R blocker losartan attenuates intestinal epithelial cell apoptosis in a mouse model of Crohn's disease. Molecular Medicine Reports, 13(2), 1156–1162. 10.3892/mmr.2015.4686 [DOI] [PMC free article] [PubMed] [Google Scholar]
- Liu, Z. , Liu, H. Y. , Zhou, H. , Zhan, Q. , Lai, W. , Zeng, Q. , … Xu, D. (2017). Moderate‐intensity exercise affects gut microbiome composition and influences cardiac function in myocardial infarction mice. Frontiers in Microbiology, 8, 1687 10.3389/fmicb.2017.01687 [DOI] [PMC free article] [PubMed] [Google Scholar]
- Marques, F. Z. , Nelson, E. , Chu, P. Y. , Horlock, D. , Fiedler, A. , Ziemann, M. , … Kaye, D. M. (2017). High‐fiber diet and acetate supplementation change the gut microbiota and prevent the development of hypertension and heart failure in hypertensive mice. Circulation, 135(10), 964–977. 10.1161/CIRCULATIONAHA.116.024545 [DOI] [PubMed] [Google Scholar]
- McDermott, A. J. , & Huffnagle, G. B. (2014). The microbiome and regulation of mucosal immunity. Immunology, 142(1), 24–31. 10.1111/imm.12231 [DOI] [PMC free article] [PubMed] [Google Scholar]
- McGrath, J. C. , & Lilley, E. (2015). Implementing guidelines on reporting research using animals (ARRIVE etc.): New requirements for publication in BJP . British Journal of Pharmacology, 172(13), 3189–3193. 10.1111/bph.12955 [DOI] [PMC free article] [PubMed] [Google Scholar]
- Mell, B. , Jala, V. R. , Mathew, A. V. , Byun, J. , Waghulde, H. , Zhang, Y. , … Joe, B. (2015). Evidence for a link between gut microbiota and hypertension in the Dahl rat. Physiological Genomics, 47(6), 187–197. 10.1152/physiolgenomics.00136.2014 [DOI] [PMC free article] [PubMed] [Google Scholar]
- Mowat, A. M. , & Agace, W. W. (2014). Regional specialization within the intestinal immune system. Nature Reviews. Immunology, 14(10), 667–685. 10.1038/nri3738 [DOI] [PubMed] [Google Scholar]
- Mukherjee, S. , Stamatis, D. , Bertsch, J. , Ovchinnikova, G. , Katta, H. Y. , Mojica, A. , … Reddy, T. (2019). Genomes OnLine database (GOLD) v.7: Updates and new features. Nucleic Acids Research, 47(D1), D649–D659. 10.1093/nar/gky977 [DOI] [PMC free article] [PubMed] [Google Scholar]
- Niess, J. H. , Brand, S. , Gu, X. , Landsman, L. , Jung, S. , McCormick, B. A. , … Littman, D. R. (2005). CX3CR1‐mediated dendritic cell access to the intestinal lumen and bacterial clearance. Science, 307(5707), 254–258. 10.1126/science.1102901 [DOI] [PubMed] [Google Scholar]
- Okawada, M. , Koga, H. , Larsen, S. D. , Showalter, H. D. , Turbiak, A. J. , Jin, X. , … Teitelbaum, D. H. (2011). Use of enterally delivered angiotensin II type Ia receptor antagonists to reduce the severity of colitis. Digestive Diseases and Sciences, 56(9), 2553–2565. 10.1007/s10620-011-1651-9 [DOI] [PMC free article] [PubMed] [Google Scholar]
- Pamer, E. G. (2007). Immune responses to commensal and environmental microbes. Nature Immunology, 8(11), 1173–1178. 10.1038/ni1526 [DOI] [PubMed] [Google Scholar]
- Park, J. , Kim, M. , Kang, S. G. , Jannasch, A. H. , Cooper, B. , Patterson, J. , & Kim, C. H. (2015). Short‐chain fatty acids induce both effector and regulatory T cells by suppression of histone deacetylases and regulation of the mTOR‐S6K pathway. Mucosal Immunology, 8(1), 80–93. 10.1038/mi.2014.44 [DOI] [PMC free article] [PubMed] [Google Scholar]
- Pluznick, J. L. , Protzko, R. J. , Gevorgyan, H. , Peterlin, Z. , Sipos, A. , Han, J. , … Caplan, M. J. (2013). Olfactory receptor responding to gut microbiota‐derived signals plays a role in renin secretion and blood pressure regulation. Proceedings of the National Academy of Sciences of the United States of America, 110(11), 4410–4415. 10.1073/pnas.1215927110 [DOI] [PMC free article] [PubMed] [Google Scholar]
- Romero, M. , Toral, M. , Robles‐Vera, I. , Sanchez, M. , Jimenez, R. , O'Valle, F. , … Duarte, J. (2017). Activation of peroxisome proliferator activator receptor β/δ improves endothelial dysfunction and protects kidney in murine lupus. Hypertension, 69(4), 641–650. 10.1161/HYPERTENSIONAHA.116.08655 [DOI] [PubMed] [Google Scholar]
- Santisteban, M. M. , Qi, Y. , Zubcevic, J. , Kim, S. , Yang, T. , Shenoy, V. , … Raizada, M. K. (2017). Hypertension‐linked pathophysiological alterations in the gut. Circulation Research, 120(2), 312–323. 10.1161/CIRCRESAHA.116.309006 [DOI] [PMC free article] [PubMed] [Google Scholar]
- Segata, N. , Izard, J. , Waldron, L. , Gevers, D. , Miropolsky, L. , Garrett, W. S. , & Huttenhower, C. (2011). Metagenomic biomarker discovery and explanation. Genome Biology, 12(6), R60 10.1186/gb-2011-12-6-r60 [DOI] [PMC free article] [PubMed] [Google Scholar]
- Sharma, R. K. , Yang, T. , Oliveira, A. C. , Lobaton, G. O. , Aquino, V. , Kim, S. , … Raizada, M. K. (2019). Microglial cells impact gut microbiota and gut pathology in angiotensin II‐induced hypertension. Circulation Research, 124(5), 727–736. 10.1161/CIRCRESAHA.118.313882 [DOI] [PMC free article] [PubMed] [Google Scholar]
- Sun, S. , Lulla, A. , Sioda, M. , Winglee, K. , Wu, M. C. , Jacobs, D. R. Jr. , … Meyer, K. A. (2019). Gut microbiota composition and blood pressure. Hypertension, 73, 998–1006. 10.1161/HYPERTENSIONAHA.118.12109 [DOI] [PMC free article] [PubMed] [Google Scholar]
- Takeshita, K. , & Murohara, T. (2014). Does angiotensin receptor blockade ameliorate the prothrombotic tendency in hypertensive patients with atrial fibrillation? Breaking the vicious cycle. Hypertension Research, 37(6), 490–491. 10.1038/hr.2014.48 [DOI] [PubMed] [Google Scholar]
- Tang, W. H. , Wang, Z. , Levison, B. S. , Koeth, R. A. , Britt, E. B. , Fu, X. , … Hazen, S. L. (2013). Intestinal microbial metabolism of phosphatidylcholine and cardiovascular risk. The New England Journal of Medicine, 368(17), 1575–1584. 10.1056/NEJMoa1109400 [DOI] [PMC free article] [PubMed] [Google Scholar]
- Tilg, H. , & Kaser, A. (2011). Gut microbiome, obesity, and metabolic dysfunction. The Journal of Clinical Investigation, 121(6), 2126–2132. 10.1172/JCI58109 [DOI] [PMC free article] [PubMed] [Google Scholar]
- Toral, M. , Robles‐Vera, I. , de la Visitación, N. , Romero, M. , Sánchez, M. , … Duarte, J. (2019b). Role of the immune system in vascular function and blood pressure control induced by faecal microbiota transplantation in rats. Acta Physiologica (Oxford, England), 227(1), e13285 10.1111/apha.13285 [DOI] [PubMed] [Google Scholar]
- Toral, M. , Robles‐Vera, I. , De la Visitación, N. , Romero, M. , Yang, T. , Sánchez, M. , … Duarte, J. (2019a). Critical role of the interaction gut microbiota‐sympathetic nervous system in the regulation of blood pressure. Frontiers in Physiology, 10, 231 10.3389/fphys.2019.00231 [DOI] [PMC free article] [PubMed] [Google Scholar]
- Toral, M. , Romero, M. , Rodriguez‐Nogales, A. , Jimenez, R. , Robles‐Vera, I. , Algieri, F. , … Duarte, J. (2018). Lactobacillus fermentum improves tacrolimus‐induced hypertension by restoring vascular redox state and improving eNOS coupling. Molecular Nutrition & Food Research, 62, e1800033 10.1002/mnfr.201800033 [DOI] [PubMed] [Google Scholar]
- Tsoporis, J. , & Leenen, F. H. (1988). Effects of arterial vasodilators on cardiac hypertrophy and sympathetic activity in rats. Hypertension, 11(4), 376–386. [DOI] [PubMed] [Google Scholar]
- Tsuda, K. , Shima, H. , Ura, M. , Takeda, J. , Kimura, K. , Nishio, I. , & Masuyama, Y. (1988). Protein kinase C‐dependent and calmodulin‐dependent regulation of neurotransmitter release and vascular responsiveness in spontaneously hypertensive rats. Journal of Hypertension. Supplement, 6(4), S565–S567. [DOI] [PubMed] [Google Scholar]
- Vaishnava, S. , Behrendt, C. L. , Ismail, A. S. , Eckmann, L. , & Hooper, L. V. (2008). Paneth cells directly sense gut commensals and maintain homeostasis at the intestinal host‐microbial interface. Proceedings of the National Academy of Sciences of the United States of America, 105(52), 20858–20863. 10.1073/pnas.0808723105 [DOI] [PMC free article] [PubMed] [Google Scholar]
- Vera, R. , Jimenez, R. , Lodi, F. , Sanchez, M. , Galisteo, M. , Zarzuelo, A. , … Duarte, J. (2007). Genistein restores caveolin‐1 and AT‐1 receptor expression and vascular function in large vessels of ovariectomized hypertensive rats. Menopause, 14(5), 933–940. 10.1097/GME.0b013e31802d9785 [DOI] [PubMed] [Google Scholar]
- Vora, P. , Youdim, A. , Thomas, L. S. , Fukata, M. , Tesfay, S. Y. , Lukasek, K. , … Abreu, M. T. (2004). β‐Defensin‐2 expression is regulated by TLR signaling in intestinal epithelial cells. Journal of Immunology, 173(9), 5398–5405. [DOI] [PubMed] [Google Scholar]
- Wang, Q. , Garrity, G. M. , Tiedje, J. M. , & Cole, J. R. (2007). Naive Bayesian classifier for rapid assignment of rRNA sequences into the new bacterial taxonomy. Applied and Environmental Microbiology, 73(16), 5261–5267. 10.1128/AEM.00062-07 [DOI] [PMC free article] [PubMed] [Google Scholar]
- Wengrower, D. , Zanninelli, G. , Latella, G. , Necozione, S. , Metanes, I. , Israeli, E. , … Goldin, E. (2012). Losartan reduces trinitrobenzene sulphonic acid‐induced colorectal fibrosis in rats. Canadian Journal of Gastroenterology, 26(1), 33–39. 10.1155/2012/628268 [DOI] [PMC free article] [PubMed] [Google Scholar]
- Wilck, N. , Matus, M. G. , Kearney, S. M. , Olesen, S. W. , Forslund, K. , Bartolomaeus, H. , … Muller, D. N. (2017). Salt‐responsive gut commensal modulates TH17 axis and disease. Nature, 551(7682), 585–589. 10.1038/nature24628 [DOI] [PMC free article] [PubMed] [Google Scholar]
- Yang, J. Y. , Lee, Y. S. , Kim, Y. , Lee, S. H. , Ryu, S. , Fukuda, S. , … Kweon, M. N. (2017). Gut commensal Bacteroides acidifaciens prevents obesity and improves insulin sensitivity in mice. Mucosal Immunology, 10(1), 104–116. 10.1038/mi.2016.42 [DOI] [PubMed] [Google Scholar]
- Yang, T. , Aquino, V. , Lobaton, G. O. , Li, H. , Colon‐Perez, L. , Goel, R. , … Pepine, C. J. (2019). Sustained captopril‐induced reduction in blood pressure is associated with alterations in gut‐brain axis in the spontaneously hypertensive rat. Journal of the American Heart Association, 8(4), e010721 10.1161/JAHA.118.010721 [DOI] [PMC free article] [PubMed] [Google Scholar]
- Yang, T. , Santisteban, M. M. , Rodriguez, V. , Li, E. , Ahmari, N. , Carvajal, J. M. , … Mohamadzadeh, M. (2015). Gut dysbiosis is linked to hypertension. Hypertension, 65(6), 1331–1340. 10.1161/HYPERTENSIONAHA.115.0531 [DOI] [PMC free article] [PubMed] [Google Scholar]
- Yisireyili, M. , Uchida, Y. , Yamamoto, K. , Nakayama, T. , Cheng, X. W. , Matsushita, T. , … Takeshita, K. (2018). Angiotensin receptor blocker irbesartan reduces stress‐induced intestinal inflammation via AT1a signaling and ACE2‐dependent mechanism in mice. Brain Behavior & Immunity, 69, 167–179. 10.1016/j.bbi.2017.11.010 [DOI] [PubMed] [Google Scholar]
- Zarzuelo, M. J. , Jimenez, R. , Galindo, P. , Sanchez, M. , Nieto, A. , Romero, M. , … Duarte, J. (2011). Antihypertensive effects of peroxisome proliferator‐activated receptor‐β activation in spontaneously hypertensive rats. Hypertension, 58(4), 733–743. 10.1161/HYPERTENSIONAHA.111.174490 [DOI] [PubMed] [Google Scholar]
- Zhou, H. W. , Li, D. F. , Tam, N. F. , Jiang, X. T. , Zhang, H. , Sheng, H. F. , … Zou, F. (2011). BIPES, a cost‐effective high‐throughput method for assessing microbial diversity. The ISME Journal, 5(4), 741–749. 10.1038/ismej.2010.160 [DOI] [PMC free article] [PubMed] [Google Scholar]
Associated Data
This section collects any data citations, data availability statements, or supplementary materials included in this article.
Supplementary Materials
Table S1. Primers for real‐time RT‐PCR.
Figure S1. Losartan (Los) does not induce changes in the microecological parameters of gut microbiota of spontaneously hypertensive rats (SHR).
Figure S2. Distinct changes in the gut microbiota between Wistar Kyoto rats (WKY) and spontaneously hypertensive rats (SHR).
Figure S3. Losartan (Los) induced different behaviors of gut microbiota in spontaneously hypertensive rats (SHR).
Figure S4. Losartan (Los) induced changes at the family level in the gut microbiota of spontaneously hypertensive rats (SHR).
Figure S5. Losartan (Los) induced changes at the genus level in the gut microbiota of spontaneously hypertensive rats (SHR).
Figure S6. Protective effects of Losartan (Los) in vascular function and oxidative stress in spontaneously hypertensive rats (SHR).
Figure S7. Effects of faecal microbiota transplantation from spontaneously hypertensive rat (SHR)‐losartan to SHR on different behaviours of the gut microbiota of SHR.
Figure S8. Comparisons of gut microbiome changes in SHR with stool transplant from SHR (S‐S) versus from SHR treated with losartan (S‐SLOS).
Figure S9. Effects of faecal microbiota transplantation from spontaneously hypertensive rat (SHR)‐losartan at the genus level in the gut microbiota of SHR.
Figure S10. Summary of mechanistic changes involving gut microbiota in the antihypertensive effects of Losartan in spontaneously hypertensive rat.