

Abstract
Background and Purpose
More than 30% of currently marketed medications act via GPCRs. Thus, GPCRs represent one of the most important pharmacotherapeutic targets. In contrast to traditional agonists activating multiple signalling pathways, agonists activating a single signalling pathway represent a new generation of drugs with increased specificity and fewer adverse effects.
Experimental Approach
We have synthesized novel agonists of muscarinic ACh receptors and tested their binding and function (on levels of cAMP and inositol phosphates) in CHO cells expressing individual subtypes of muscarinic receptors, primary cultures of rat aortic smooth muscle cells and suspensions of digested native tissues from rats. Binding of the novel compounds to M2 receptors was modelled in silico.
Key Results
Two of the tested new compounds (1‐(thiophen‐2‐ylmethyl)‐3,6‐dihydro‐2H‐pyridinium and 1‐methyl‐1‐(thiophen‐2‐ylmethyl)‐3,6‐dihydro‐2H‐pyridinium) only inhibited cAMP synthesis in CHO cells, primary cultures, and native tissues, with selectivity for M2 muscarinic receptors and displaying bias towards the Gi signalling pathway at all subtypes of muscarinic receptors. Molecular modelling revealed interactions with the orthosteric binding site in a way specific for a given agonist followed by agonist‐specific changes in the conformation of the receptor.
Conclusions and Implications
The identified compounds may serve as lead structures in the search for novel non‐steroidal and non‐opioid analgesics acting via M2 and M4 muscarinic receptors with reduced side effects associated with activation of the phospholipase C signalling pathway.

Abbreviations
- IPX
inositol phosphates
- KHB
Krebs HEPES buffer
- NMS
N‐methylscopolamine
- VTA
ventral tegmental area
What is already known
Highly selective muscarinic receptor agonists are needed to avoid undesired side effects.
Only few functionally selective muscarinic agonists are known.
What this study adds
We have developed M2‐selective, Gi‐biased agonists.
What is the clinical significance
These compounds may provide lead structures in the search for novel non‐steroidal and non‐opioid analgesics.
1. INTRODUCTION
Although individual GPCRs preferentially couple to a particular class of G‐proteins, their specificity is not absolute. They usually activate multiple G‐proteins with a range of potency, efficacy, and kinetics (Hermans, 2003; Jakubík, El‐Fakahany, & Dolezal, 2006). Besides artificial systems with overexpressed GPCRs, this coupling promiscuity was also observed in native cells (Jakubík et al., 1996; Laugwitz et al., 1996). It is generally accepted that structurally diverse agonists induce different changes in conformation of GPCRs that can lead to non‐uniform modulation of signalling pathways. This preferential orientation of signalling of a given GPCR towards a subset of its signal transducers is termed signalling bias (Kenakin & Christopoulos, 2013). The property may be employed to develop drugs that selectively produce desired effects while avoiding side effects associated with activation of unwanted signalling pathways (Manglik et al., 2016). Much research has been carried out on agonists biased towards either G‐protein‐ or arrestin‐mediated pathway. Here, as a proof of concept, we demonstrate signalling bias among individual classes of G‐proteins.
Five subtypes of https://www.guidetopharmacology.org/GRAC/FamilyDisplayForward?familyId=2 are expressed in the CNS and peripheral nervous system, as well as innervated tissues. Muscarinic receptors mediate a wide variety of physiological functions via Gq/11 G‐protein‐mediated stimulation of PLC (https://www.guidetopharmacology.org/GRAC/ObjectDisplayForward?objectId=13, https://www.guidetopharmacology.org/GRAC/ObjectDisplayForward?objectId=15, and https://www.guidetopharmacology.org/GRAC/ObjectDisplayForward?objectId=17 receptors) or via Gi/o G‐protein‐mediated inhibition of AC (https://www.guidetopharmacology.org/GRAC/ObjectDisplayForward?objectId=14 and https://www.guidetopharmacology.org/GRAC/ObjectDisplayForward?objectId=16; Eglen, 2012). Disruption of muscarinic signalling contributes to many pathophysiological conditions, including a variety of neurological and psychiatric disorders, for example, Alzheimer's disease and schizophrenia, and also to some internal diseases, for example, asthma or overactive bladder (Eglen, 2012). To target these disease states, selective modulation of individual muscarinic subtypes is necessary to avoid undesired side effects. However, the high homology of the orthosteric binding site among all five muscarinic receptor subtypes (Haga et al., 2012; Kruse et al., 2012; Thal et al., 2016) makes it very difficult to find agonists that could bind and selectively activate individual subtypes. No affinity‐based selective agonists of muscarinic receptors have been discovered so far. The development of biased agonists can be the right approach to overcome the conserved nature of the orthosteric binding site and to achieve selective modulation of individual subtypes of muscarinic receptors. However, the possible signalling bias of muscarinic receptors particularly with respect to individual G‐proteins is still poorly explored.
Residues in the binding site that mediate activation of a specific signalling pathway are termed functional hot spots (Nivedha et al., 2018). Binding of an agonist to one or a subset of functional hot spots within the binding site results in activation of a subset of signalling pathways and thus in ligand‐mediated signalling bias. An agonist relatively small in size has a better chance to bind to a smaller number of functional hot spots than a larger agonist. It has been proposed that some muscarinic agonists (e.g., analogues of arecoline) exert bias towards Gi/o signalling pathway. These agonists do not interact with Asn6.52 (Ballesteros–Weinstein numbering, Ballesteros & Weinstein, 1995) in contrast to conventional agonists (Fish et al., 2017). The scaffold containing the NCCSC backbone where the nitrogen is the electron positive part and sulphur is the electron negative part of a ligand has been shown to exert some binding selectivity for M2 receptors (Boulos, Jakubík, Randáková, & Avila, 2013). Taking these considerations into account, we have designed and synthesized small muscarinic agonists (Figure 1). Two of these compounds exclusively inhibited synthesis of https://www.guidetopharmacology.org/GRAC/LigandDisplayForward?ligandId=2352 (through activation of the Gi/o signalling pathway) and did not stimulate accumulation of inositol phosphates (IPX; Gq pathway), either in a heterologous expression system or in digests of tissues and primary cultures. Although Gi versus β‐arrestin‐biased agonists have been reported (e.g., at https://www.guidetopharmacology.org/GRAC/FamilyDisplayForward?familyId=50, DeWire et al., 2013), Gi/o bias at the G‐protein level has not been reported so far (Bologna, Teoh, Bayoumi, Tang, & Kim, 2017). Molecular modelling confirmed the absence of hydrogen bonding of the novel agonists with Asn6.52 in the sixth transmembrane helix and the existence of agonist‐specific conformations induced by the novel agonists.
Figure 1.

Comparison of binding of novel agonists and agonist iperoxo to the orthosteric binding site of the M2 muscarinic receptor. Top, chemical structures of compound 7A (left) and iperoxo (right). Bottom, compound 7A (left) and iperoxo (right) in the orthosteric binding site of M2 receptor in an active conformation (PDB ID: 4MQS). View from extracellular side. Secondary structure of the receptor is coloured according to residue number in red–white–blue gradient TM1 being coloured red and TM7 blue. Key residues of the orthosteric binding site Asp103 (Asp3.32) in the TM3 and Asn404 (Asn6.52) in TM6 are displayed. Green dashed line is hydrogen bond of iperoxo to Asn404
Muscarinic receptor agonists have strong analgesic effects. Several lines of evidence indicate that the analgesic effects of muscarinic agonists are mediated by Gi/o G‐proteins activated by M2 and M4 receptors (Chen & Pan, 2004; De Angelis & Maria Tata, 2016; Duttaroy et al., 2002; Wess, Eglen, & Gautam, 2007). Currently, muscarinic agonists represent one of the most promising drug development targets to find novel agents to replace addictive opioid analgesics (Tata, 2008). Therefore, agonists, solely inhibiting cAMP synthesis, discovered in our laboratory, may serve as a novel pharmacophore for development of new analgesics with reduced side effects mediated by the PLC pathway. However, their potential analgesic effects will need to be verified in vivo.
2. METHODS
2.1. Cell culture and membrane preparation
CHO cells stably transfected with the genes of individual human variants of muscarinic receptors were purchased from Missouri S&T cDNA Resource Center (Rolla, MO, USA). Fresh primary cell cultures of smooth muscle cells from rat aorta, prepared as previously described (Bacáková et al., 1997) were kindly provided by Dr. Lucie Bačáková. Primary cultures of smooth muscle cells were grown to confluency in 75‐cm2 flasks in DMEM supplemented with 10% FBS and cells (2 x10⁶) were subcultured up to six times. Cell cultures and crude membranes from CHO cells were prepared as described previously (Boulos, Jakubik, Boulos, Randakova, & Momirov, 2017). Cells were grown to confluency in 75‐cm2 flasks in DMEM supplemented with 10% FBS, and cells (2 x10⁶) were subcultured in 100‐mm Petri dishes. Medium was supplemented with 5‐mM butyrate for the last 24 hr of culture to increase receptor expression. When needed, cells were cultured with Pertussis toxin (PTX) at a final concentration of 25 ng·ml−1 for the 24 hr. Cells were detached by mild trypsinization on Day 5 after subculture. Detached cells were washed twice in 50 ml of PBS and 3‐min centrifugation at 250× g. Washed cells were suspended in 20 ml of ice‐cold incubation medium (100 mM NaCl, 20 mM Na‐HEPES, 10 mM MgCl2, pH = 7.4) supplemented with 10 mM EDTA and homogenized on ice by two 30‐s strokes using a Polytron homogenizer (Ultra‐Turrax; Janke & Kunkel GmbH & Co. KG, IKA‐Labortechnik, Staufen, Germany) with a 30‐s pause between strokes. Cell homogenates were centrifuged for 30 min at 30,000× g. Supernatants were discarded, and pellets suspended in fresh incubation medium, incubated on ice for 30 min, and centrifuged again. The resulting membrane pellets were kept at −80°C until assayed within 10 weeks.
2.2. Preparation of rat tissue extracts
All animal care and experimental procedures complied with current legislative and guidelines and were approved by the Czech Ministry of Agriculture (permit 16OZ23113/2017‐17214). Animal studies are reported in compliance with the ARRIVE guidelines (Kilkenny, Browne, Cuthill, Emerson, & Altman, 2010) and with the recommendations made by the British Journal of Pharmacology.
Adult 8‐week‐old male Wistar rats (supplied by the Animal Facility of Institute of Physiology CAS, Prague) were killed by cervical dislocation and tissues were dissected immediately. Suspensions of digested tissue (tissue digests) from rat brain cortex, cerebellum, striatum, ventral tegmental area (VTA), and submaxillary glands were prepared as described previously by Randáková et al., (2018). Submaxillary glands were minced by scissors. Tissues were then digested by incubation for 15 min at 37°C in Krebs HEPES buffer (KHB) with trypsin (1 ml of concentrated trypsin‐EDTA solution (Sigma T4174) in 10 ml KHB), and trituration every 5 min. The resulting digest was filtered through a 40 μm cell strainer and the filtrate centrifuged for 3 min at 250× g, resuspended in KHB, and centrifuged again to remove trypsin. The tissue suspension was used immediately in experiments. Two submaxillary glands or about 400 mg of brain tissue were used in a 96‐sample assay.
2.3. Equilibrium radioligand binding experiments
All radioligand binding experiments were optimized and carried out as described by El‐Fakahany & Jakubik (2016). Briefly, cell membranes were incubated in 96‐well plates at 30°C in the incubation medium described above. Incubation volume was 400 or 800 μl for competition and saturation experiments with https://www.guidetopharmacology.org/GRAC/LigandDisplayForward?ligandId=317 (NMS) respectively. Approximately 30 μg of membrane protein per sample were used. Binding of [3H]NMS was measured directly in saturation experiments using six concentrations (30 to 1,000 pM) of [3H]NMS for 1 hr. For calculations of equilibrium dissociation constant (K D), concentrations of free [3H]NMS were calculated by subtraction of bound radioactivity from total radioactivity in the sample and fitting Equation (1) (Section 2.5). Binding of tested ligands was determined in competition experiments with 1 nM [3H]NMS. Membranes were incubated for 1 (M2), 3 (M1, M3, and M4), or 5 hr (M5) at 30°C. The inhibition constant K I was calculated according to Equation (3). Non‐specific binding was determined in the presence of 1 μM unlabelled https://www.guidetopharmacology.org/GRAC/LigandDisplayForward?ligandId=320. Incubations were terminated by filtration through Whatman GF/C glass fibre filters (Whatman) using a Brandel cell harvester (Brandel, Geithesburg, MD, USA). Filters were dried in a microwave oven, and then solid scintillator Meltilex A was melted on filters (105°C, 90 s) using a hot plate. The filters were cooled and counted in Wallac Microbeta scintillation counter.
2.4. Measurements of the production of cAMP and IPX
Levels of second messengers cAMP and IPX were determined in radiochemical chromatography assays as described previously (Jakubík et al., 1996). To determine levels of cAMP, cells in suspension were pre‐incubated for 1 hr with 0.4 μM [3H]https://www.guidetopharmacology.org/GRAC/LigandDisplayForward?ligandId=4788, washed, and incubated for 10 min in the presence of IBMX (1 mM) and 10‐μM forskolin. Then about 200,000 cells per 0.8 ml of sample were incubated for 1 hr with https://www.guidetopharmacology.org/GRAC/LigandDisplayForward?ligandId=298 or tested compounds. Incubation was ended by addition of 0.2 ml of 2.5 M HCl to the samples. Samples were applied to alumina columns (1.5 g of alumina per column), washed with 2 ml of ammonium acetate (1 M, pH = 7.0), and eluted from columns with 4 ml of ammonium acetate and measured by liquid scintillation spectrometry. M2 and M4 receptors that preferentially inhibit cAMP synthesis via Gi/o G‐proteins were coupled to the Gq–PLC pathway. For this purpose, new CHO cell lines stably expressing promiscuous G15 G‐protein (Offermanns & Simon, 1995) and M2 or M4 receptors were generated by transfection with pCMV/hygro vector and hygromycin selection.
To determine the rate of formation of IPX, suspended cells were pre‐incubated with 0.1 μM [3H]myo‐inositol for 60 min, washed, and incubated with 10 mM LiCl for 15 min. Then about 200,000 cells per 0.8 ml of sample were incubated for 1 hr with carbachol or tested compounds for 60 min. The incubation was stopped by addition of 0.5 ml of chloroform methanol HCl mixture (2:1:0.1). After separation of water and organic phases, 0.6 ml of water phase was applied to Dowex columns (1.5 g of Dowex per column), washed by 20 ml of 60‐mM ammonium formate/5 mM sodium borate buffer, and eluted from columns with 4 ml of 1 M ammonium formate/0.1 M formic acid buffer and measured by liquid scintillation spectrometry. All pre‐incubations and incubations were carried in KHB (final concentrations in mM: NaCl 138; KCl 4; CaCl2 1.3; MgCl2 1; NaH2PO4 1.2; HEPES 20; glucose 10; pH adjusted to 7.4) supplemented with 10 mM glucose at 37°C.
2.5. Data and statistical analysis
The data and statistical analysis comply with the recommendations of the British Journal of Pharmacology on experimental design and analysis in pharmacology (Curtis et al., 2018). Experiments were independent, using different seedings of CHO cells or explanted from different animals. Binding experiments were carried out in six experiments with samples in quadruplicate, and functional assays were carried out in five experiments with samples in triplicate. Experimenters were blind to the chemical structures of tested compounds. After subtraction of non‐specific binding (binding experiments) or background/blank values (functional experiments), data were normalized to control values determined in each experiment. IC50 and EC50 values and parameters derived from them (K I and K A) were analysed after conversion to their logarithms. All data were included in analysis, no outliers were excluded, and normality of distribution was checked. In statistical analysis, value of P < .01 was taken as significant for all data. In multiple comparison tests, ANOVA with P < .01 was followed by Tukey's post‐test (P < .01). Statistical analysis was carried out using R (http://www.r-project.org) and the equations shown below.
[3H]NMS saturation binding
| (1) |
where y is specific binding at free concentration x, BMAX is maximum binding capacity, and K D is equilibrium dissociation constant.
Competition binding
| (2) |
where y is specific radioligand biding at concentration x of competitor expressed as per cent of binding in the absence of competitor and IC50 is concentration causing 50% inhibition of radioligand binding.Inhibition constant K I was calculated as
| (3) |
where IC50 is concentration causing 50% inhibition of [3H]NMS binding calculated according to Equation (2) from competition binding data, [D] is concentration of [3H]NMS used, and K D is its equilibrium dissociation constant calculated according to Equation (1) from saturation binding data.
Functional response
| (4) |
where y is functional response at concentration of tested compound x, E′MAX is apparent maximal response to the tested compound, EC50 is concentration causing half‐efficient concentration, and nH is slope factor (Hill coefficient). For bi‐phasic response curves, inhibitory and stimulatory phase were fitted separately.
Operational model of functional agonism
Operational efficacy coefficient τ (Black & Leff, 1983) was determined by fitting Equation (5) to data from functional assay.
| (5) |
where y is functional response at concentration of tested compound x, EMAX is maximal response of the system, K A is equilibrium dissociation constant, and nH is slope factor. Equation (5) was fitted to data from functional experiments. Equation (5) was fitted to data by the two‐step procedure described earlier (Jakubík et al., 2019). In the first step, system EMAX was determined using https://www.guidetopharmacology.org/GRAC/LigandDisplayForward?ligandId=298, https://www.guidetopharmacology.org/GRAC/LigandDisplayForward?ligandId=302, and https://www.guidetopharmacology.org/GRAC/LigandDisplayForward?ligandId=305 as internal standards by global fit to all data for a given receptor subtype and signalling pathway. In the second step, Equation (5) with EMAX fixed to the value determined in the first step was fitted to individual experimental data sets.
Relative intrinsic activity
For comparison of effects of agonists at different receptors and signalling pathways, relative intrinsic activity (RAi) was calculated according to Griffin, Figueroa, Liller, and Ehlert (2007):
| (6) |
where τ a and K Aa are half‐effective concentration and apparent maximal response to the tested compound, respectively. As Hill coefficients were equal to one, RAi values were calculated according to Equation (7).
| (7) |
where EC50a and E′MAXa are half‐effective concentration and apparent maximal response to the tested compound, respectively.
Signalling bias
A putative signalling bias between pathways j1 and j2 was estimated by ΔΔlog(τ/K A) method according to Equation (8) (Kenakin & Christopoulos, 2013) based on Equation (6) (Griffin et al., 2007):
| (8) |
where
| (9) |
2.6. Molecular modelling
2.6.1. Preparation of receptor structure
Model of the M2 receptor in an active state was based on the crystal structure 4MQS (Kruse et al., 2013). Model of the M2 receptor in an inactive state was based on the crystal structure 3UON (Haga et al., 2012). Non‐receptor molecules except ligand were deleted, and the resulting receptor protein was processed in Maestro using Protein Preparation Wizard according to the Sastry, Adzhigirey, Day, Annabhimoju, and Sherman (2013) guidelines.
2.6.2. Ligand docking
Docking of carbachol and compounds 6A and 7A was done using Schrödinger Software Suite (Schrödinger LLC, New York, NY) with the procedure described earlier (Jakubík, El‐Fakahany, & Doležal, 2015). The ligands were constructed in ChemAxon MarvinSketch (RRID:SCR_004111) and prepared for docking in Maestro (RRID:SCR_016748) using LigPrep (RRID:SCR_016746). The ligands were docked to the receptor using the Induced Fit Docking procedure. The M2 receptor full agonist, https://www.guidetopharmacology.org/GRAC/LigandDisplayForward?ligandId=6937, was set to define the binding site. The Initial Glide docking step was set to “Standard Precision” without explicit constraints. In the Prime refinement step, amino acid residues within 5‐Å from the ligand were refined in a single pass. Glide re‐docking step was set to “Extra Precision.” Top 20 poses were then re‐evaluated using Prime MM‐GB/SA. The highest pose possessing hydrogen bond to Asp103 was selected for further work.
2.6.3. Simulation of molecular dynamics
To evaluate ligand binding to the receptor and to evaluate its interactions with the receptor, conventional molecular dynamics (MD) was simulated using Desmond/GPU ver. 5.3 (RRID:SCR_014575). The simulated system consisted of receptor–ligand complex in 1‐palmitoyl‐2‐oleoyl‐sn‐glycero‐3‐phosphocholine membrane set to receptor helices in water and 0.15 M NaCl. The system was first relaxed by the standard Desmond protocol for membrane proteins, and then 1.2‐ns NPT (Noose‐Hover chain thermostat at 300 K, Martyna‐Tobias‐Klein barostat at 1.01325 bar, isotropic coupling, Coulombic cut‐off at 0.9 nm) followed by 120‐ns NVE molecular dynamics without restrains was simulated. MD was run three times with various initial velocities. The quality of molecular dynamics simulation was assessed by Simulation Quality Analysis tools of Maestro and analysed by Simulation Event Analysis tool. Ligand–receptor interactions were identified using Simulation Interaction Diagram tool. Further MD trajectories were analysed in VMD (RRID:SCR_004905). Using tcl scripts (Supporting Information, Molecular Modelling section), distances and RMSDs of various parts of the receptor were measured. Namely, the distance between gravity centres of Cα of residues 94 to 124 (TM3), 385 to 411 (TM6), 204 to 212 (TM5), and 435 to 443 (TM7), all atoms of Arg121 at the edge of TM3 and Glu382 at the edge of TM6, all atoms of Tyr206 at the edge of TM5 and Tyr440 at the edge of TM7, and RMSD of Arg436, Pro437, and Tyr440 were measured. Using Dynamical Network Analysis tool box (Sethi, Eargle, Black, & Luthey‐Schulten, 2009), relay of conformational changes from the ligand to Arg121 and Glu382 via allosteric interaction networks was analysed. In this analysis, ligand and each amino acid were treated as separate nodes.
2.7. Materials
Reagents were purchased from Aldrich Chemical Company (St. Louis, MO) unless otherwise noted, and all starting liquid materials were distilled before use. NMR spectra were recorded on a Varian 300 MHz spectrometer housed at Barry University. Mass spectra were recorded on a Perkin Elmer Clarus 560 S GC/MS system. Elemental analyses were carried out by Galbraith Laboratories (Knoxville, TN), and biological assays were conducted at the Institute of Physiology of the Czech Academy of Sciences in Prague. Melting points were recorded on a MEL‐TEMP II purchased from Laboratory Devices and are uncorrected. All radiolabelled compounds ‐ (https://www.guidetopharmacology.org/GRAC/LigandDisplayForward?ligandId=317, https://www.guidetopharmacology.org/GRAC/LigandDisplayForward?ligandId=4495, and https://www.guidetopharmacology.org/GRAC/LigandDisplayForward?ligandId=4788) ‐ were purchased from American Radiolabelled Chemicals, Inc. (St. Louis, MO). Common chemicals were purchased from Sigma (Prague, CZ) in the highest available purity.
2.8. Nomenclature of targets and ligands
Key protein targets and ligands in this article are hyperlinked to corresponding entries in http://www.guidetopharmacology.org, the common portal for data from the IUPHAR/BPS Guide to PHARMACOLOGY (Harding et al., 2018), and are permanently archived in the Concise Guide to PHARMACOLOGY 2019/20 (Alexander, Christopoulos et al., 2019; Alexander, Fabbro et al., 2019; Alexander, Mathie et al., 2019).
3. RESULTS
New compounds were tested in CHO cell lines stably expressing the human variants of individual subtypes of muscarinic receptors. Expression level of individual subtypes of muscarinic receptors was determined in [3H]NMS) saturation binding studies and is listed alongside with [3H]NMS equilibrium dissociation constants in Table S1. Expression levels of individual classes of G‐proteins was determined by [35S]GTPγS scintillation proximity assay (Jakubík et al., 2006) and are summarized in Figure S1.
Affinity of new compounds (Figure S2) was assessed in competition with 1 nM [3H]NMS (Table S2). All compounds completely inhibited the binding of [3H]NMS, suggesting competitive mutually exclusive interaction. All compounds bound to all subtypes of muscarinic receptors with affinity in the micromolar range. Inhibition constants K I ranged from 0.7 μM for compound 7D at M2 receptors to 54 μM for compound 6A at M4 receptors. Compounds with methylated nitrogen (7A, 7B, and 7C) had higher affinity than non‐methylated counterparts (6A, 6B, and 6C) at all receptor subtypes. Affinities of compounds with halogenated thiophene at the 5‐position (7C and 7D) ring were higher than those of non‐halogenated congeners, especially at M2 receptors. About 20% binding to M2 and 10% binding to M4 of compounds 6B and 7B occurred with high affinity (about 30 nM). Reference agonists displayed high and low affinity binding (Table S3).
M1, M3, and M5 receptors preferentially activate PLC and increase the level of IPX via coupling with Gq/11 G‐proteins. M2 and M4 receptors preferentially inhibit production of cAMP via coupling with Gi/o G‐proteins. The ability of tested compounds to activate preferential signalling pathways of muscarinic receptors was determined in functional experiments by measuring accumulation of IPX at M1, M3, and M5 receptors or inhibition of forskolin‐stimulated production of cAMP at M2 and M4 receptors. These results were then compared to responses evoked by the classical non‐selective orthosteric agonists, carbachol, https://www.guidetopharmacology.org/GRAC/LigandDisplayForward?ligandId=302, and https://www.guidetopharmacology.org/GRAC/LigandDisplayForward?ligandId=305 (Table S4). Except for compound 6E (methyl group at the 4‐position of the thiophene ring), all compounds acted as partial to full agonists at all receptor subtypes, although in many cases, especially at M1, M3, and M5 receptors, their effects were negligible (Table S4 and Figure S3). In particular, compounds 6A and 7A displayed at M2 and M4 response (EMAX) comparable to that of carbachol. Their potency (pEC50) at M2 and M4 receptors was higher than at other subtypes (Figure 2). Overall, all compounds were more potent and more efficacious at M2 and M4 receptors than at other receptors.
Figure 2.
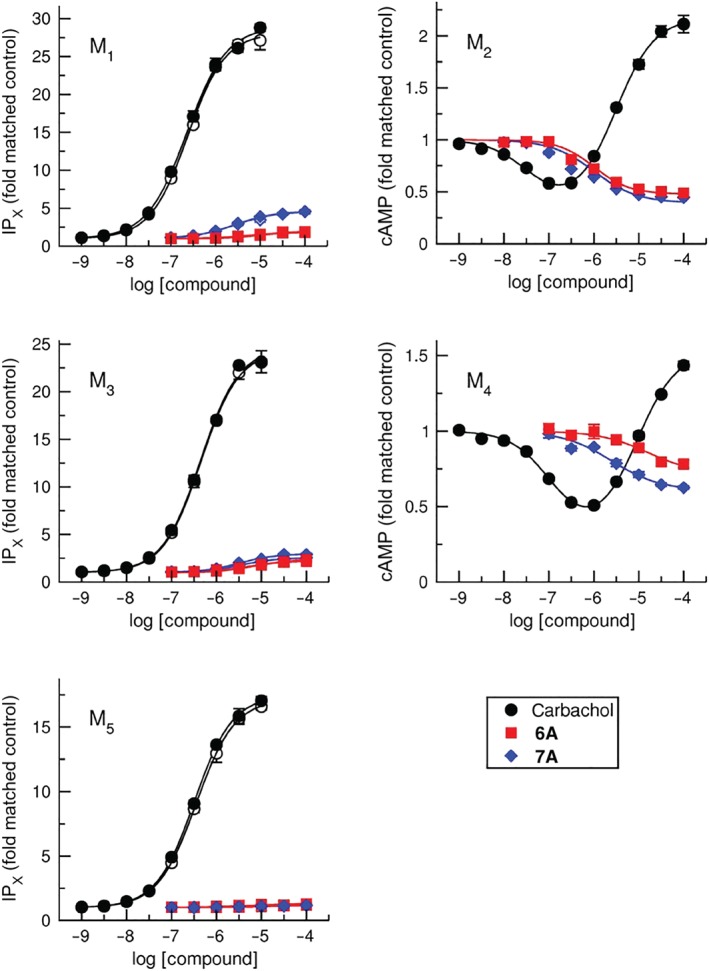
Preferential functional responses to agonists in CHO cells that express individual subtypes of muscarinic receptors. Accumulation of inositol phosphates (IPX; M1, M3, and M5 CHO cells) or forskolin‐stimulated cAMP (M2 and M4 CHO cells) at non‐transfected (open symbols) or G15 G‐protein transfected cells (closed symbols) was measured after stimulation by increasing concentrations of carbachol or tested compounds. Data are expressed as folds of matched controls and are means ± SD from five independent experiments performed in triplicates
Muscarinic receptors are also able to stimulate non‐preferential signalling pathways. The ability of the two most efficacious compounds 6A and 7A to activate non‐preferential responses via muscarinic receptors was determined by measuring of forskolin‐stimulated production of cAMP at M1, M3, and M5 receptors or accumulation of IPX at M2 and M4 receptors co‐transfected with promiscuous G15 G‐protein (Figure 3). Carbachol activated non‐preferential signalling pathways at all receptor subtypes. It increased cAMP level at M1 and M3 receptors (Gs) and stimulated accumulation of IPX (G15) at M2 and M4 receptors. At M5 receptors, carbachol inhibited forskolin‐stimulated production of cAMP at nanomolar concentrations, while at micromolar concentrations, it stimulated cAMP production. In contrast to carbachol, compounds 6A and 7A inhibited cAMP production at M1, M3, and M5 receptors but did not stimulate IPX accumulation at M2 and M4 receptors. Taking together all functional responses, both preferential and non‐preferential, compounds 6A and 7A inhibited forskolin‐stimulated production of cAMP at all receptor subtypes and did not stimulate the production of cAMP at any subtype. In contrast, carbachol stimulated production of IPx and cAMP at all subtypes.
Figure 3.

Non‐preferential functional responses to agonists in CHO cells that express individual subtypes of muscarinic receptors. Non‐preferential signalling was measured, namely, accumulation of forskolin‐stimulated cAMP (M1, M3, and M5) or IPX (M2 and M4 CHO cells) at non‐transfected (open symbols) or G15 G‐protein transfected cells (closed symbols) after stimulation by increasing concentrations of carbachol or compounds 6A and 7A. Levels of IPX and cAMP are expressed as of matched controls. Data are means ± SD from five independent experiments performed in triplicates
To calculate the operational efficacy coefficient τ of preferential (Figure 2) as well as non‐preferential (Figure 3) functional response to tested agonists, the system EMAX was determined from functional responses to the reference agonists carbachol, oxotremorine, and pilocarpine according to the procedure described recently (Jakubík et al., 2019). As carbachol and oxotremorine did not inhibit forskolin‐stimulated production of cAMP at M1 and M3 receptors, system EMAX for these systems was determined from functional responses to pilocarpine and compounds 6A and 7A. Then Equation (5) was fitted to the experimental data. Values of the operational efficacy coefficient τ of carbachol and compounds 6A and 7A (Tables S4 and S5) are plotted in Figure 4. Intrinsic activities relative to carbachol RAi were calculated to analyse potential selectivity of 6A and 7A (Tables 1, S4, and S5). Compounds 6A and 7A had the highest RAi at M2 (6A, M2 > M3 ≈ M4 ≈ M5 ≈ M1) or M2 and M4 receptors (7A: M2 > M4 > M1 = M3 ≈ M5; Table 1). The reference agonist carbachol was efficacious at stimulation of IPX (Gq) and cAMP (Gs) production at all subtypes and in lowering cAMP level at M2, M4, and M5 receptors. Compounds 6A and 7A had no Gs efficacy at any receptor subtype. Their Gq efficacy was always lower than the efficacy of carbachol. In contrast, their Gi efficacy was (except M4) always higher than efficacy of carbachol. Being Gi efficacious at M1 and M3 receptors, compounds 6A and 7A display an absolute Gi bias, while carbachol has no Gi efficacy at these receptors. Being solely efficacious at Gi pathway at M2 and M4 receptors, compounds 6A and 7A are also Gi biased at these receptors (Tables 1, S4, and S5). At M5 receptors, compounds 6A and 7A exerted about 10‐fold and 30‐fold Gi over Gq + G15 bias, respectively.
Figure 4.

Polar plot of operational efficacy coefficient τ. Operational efficacy coefficient τ was determined from functional response curves in Figures 2 and 3 by fitting Equation (5). Logarithms of τ values of inhibition of forskolin‐stimulated cAMP level (Gi), cAMP stimulation (Gs), and IPX stimulation at non‐transfected (Gq) or G15 G‐protein transfected cells (Gq + G15) of reference compound carbachol and compounds 6A and 7A are plotted
Table 1.
Efficacies of compounds 6A and 7A to elicit preferential response
| 6A | 7A | |||
|---|---|---|---|---|
| RAi | Δlog(τ/K A) | RAi | Δlog(τ/K A) | |
| M1 | 0.0010 ± 0.0001 | 2.98 ± 0.26 | 0.0111 ± 0.0002 | 1.96 ± 0.16 |
| M2 | 0.067 ± 0.007[Link] | 1.22 ± 0.08[Link] | 0.140 ± 0.008[Link] | 0.93 ± 0.09[Link] |
| M3 | 0.0058 ± 0.0005 | 2.23 ± 0.23 | 0.011 ± 0.001 | 1.94 ± 0.20 |
| M4 | 0.0046 ± 0.0004 | 2.15 ± 0.16 | 0.0209 ± 0.0011 | 1.58 ± 0.22 |
| M5 | 0.0025 ± 0.0008 | 2.60 ± 0.82 | 0.0007 ± 0.0002 | 3.17 ± 0.88 |
Note. Stimulation of IPX production at M1, M3, and M5 receptors and inhibition of cAMP production at M2 and M4 receptors are expressed as intrinsic activities relative to carbachol (RAi) and as Δlog(τ/K A) to carbachol. Values are means ± SD from five independent experiments performed in triplicates.
*P < .01, significantly different from other subtypes; ANOVA and Tukey's post‐test.
To exclude the possibility that activation of the non‐preferential Gs pathway was obscured by activation of the preferential Gi/o pathway, accumulation of cAMP was measured in CHO cells expressing M2 or M4 receptors where Gi/o G‐proteins were inactivated by PTX treatment (Figure 5). PTX‐treated cells were cultured alongside with untreated cells. PTX treatment was successful as it abolished carbachol‐mediated decrease in cAMP. In fact, carbachol caused about twofold increase in forskolin‐stimulated (Figure 5) as well as basal (Figure 4) accumulation of cAMP in PTX‐treated cells. Carbachol EC50 values in PTX‐treated cells were the same (M2) or three times lower (M4) than in non‐treated cells. Unlike carbachol, compounds 6A and 7A did not change cAMP levels even after inactivation of Gi/o G‐proteins by PTX. Thus, potential stimulatory (e.g., Gs‐mediated) response to compounds 6A and 7A was not obscured by activation of Gi G‐proteins.
Figure 5.

Accumulation of cAMP at PTX‐treated CHO cells. Accumulation of cAMP was measured in CHO cells expressing M2 (left) or M4 receptors (right) that had been treated with Pertussis toxin (PTX). Cells were stimulated by increasing concentrations of carbachol, compound 6A, or compound 7A in the presence (full symbols) or absence (open symbols) of 10 μM forskolin. Level of cAMP is expressed as folds of matched controls. Data are means ± SD from five independent experiments performed in triplicates
To exclude the possibility that the observed effects of compounds 6A and 7A are the result of overexpression in the heterologous system, functional response to the compounds was measured ex vivo, in digests of normal rat tissues. Native tissues express about 10 times less muscarinic receptors than CHO cell lines (Table S6 vs. Table S1). Accumulation of IPX was measured in brain cortex, submaxillary gland, and VTA as brain cortex and submaxillary glands are rich in M1 and M3 receptors, respectively, and VTA is the only region expressing significant amounts of M5 receptors. Accumulation of cAMP was measured in M2‐rich cerebellum and M4‐rich striatum. Carbachol induced a marked accumulation of IPX in the cortex, submaxillary gland, and VTA. In contrast to carbachol, compounds 6A and 7A did not increase IPX levels in submaxillary gland and led to negligible increases in IPX in the cortex and VTA (Figure 6, left). In the cerebellum and striatum, carbachol caused a transient decrease in forskolin‐stimulated cAMP level at sub‐micromolar concentrations followed by an increase at micromolar concentrations. In contrast to carbachol, compounds 6A and 7A caused only a decrease in cAMP level. EMAX of inhibition of cAMP synthesis in the cerebellum and striatum by compounds 6A and 7A was comparable to inhibition by carbachol. Taken together, compounds 6A and 7A only inhibited cAMP synthesis in digests of tissues, and were sometimes as efficacious as the full agonist carbachol.
Figure 6.

Functional responses to agonists in digests of normal rat tissues. Accumulation of IPX in brain cortex, submaxillary gland (submax gland), and ventral tegmental area (VTA) or forskolin‐stimulated cAMP in the cerebellum and striatum, after stimulation by increasing concentrations of carbachol or compounds 6A and 7A was measured. Levels of IPX and cAMP are expressed as folds of matched controls. Data are means ± SD from five independent experiments performed in triplicates
Effects of compounds 6A and 7A on both cAMP and IPX levels were also measured in primary cultures of rat aorta smooth muscle cells that naturally express mainly M2 and to a lesser extent M3 receptors (Eglen, 2012). In this primary cell culture, carbachol caused a transient decrease in cAMP level (Figure 7, left) as well as an increase in IPX level (Figure 7, right). As in digests of normal tissues, compounds 6A and 7A only inhibited cAMP synthesis. Maximal inhibition of cAMP synthesis by compounds 6A and 7A was the same as inhibition by carbachol. Taken together, ex vivo results are in agreement with results obtained at CHO cells. Thus, the pharmacological profile of 6A and 7A was not an artefact of heterologous high‐expression systems.
Figure 7.

Functional responses to agonists in primary culture of smooth muscle cells. Accumulation of cAMP or IPX in primary culture of smooth muscle cells was measured after stimulation by increasing concentrations of carbachol or compounds 6A and 7A. Levels of IPX and cAMP are expressed as folds of matched controls. Data are means ± SD from five independent experiments performed in triplicates
Binding of compounds 6A and 7A was modelled in silico. Binding of compounds 6A and 7A, the classical agonist carbachol, and the super‐agonist iperoxo to the M2 receptor in an active conformation was modelled using the crystal structure of the M2 receptor (PDB ID: 4MQS) and analysed by simulation of molecular dynamics (MD) of receptor–ligand complex. MD analysis showed that all agonists interact with the key residue, Asp103 (Asp3.32 according to Ballesteros–Weinstein numbering, Ballesteros & Weinstein, 1995) in TM3 (Figure 8). Compound 6A interacts with Asp103 mainly via polar interactions and water bridges. In contrast, other modelled agonists interact with Asp103 by ionic interaction that is stronger than polar interactions and water bridging. Compounds 6A and 7A may interact with key Asn404 in TM6 via water bridges, but the super‐agonist iperoxo and the full agonist carbachol interact with Asn404 mainly via polar interactions. Additionally, interaction of compounds 6A and 7A with Trp400 (Trp6.48) was much more frequent than the interaction of iperoxo or carbachol with this residue.
Figure 8.

Interaction of agonists with the receptor during simulation of molecular dynamics. Scheme of major interactions and histograms of iperoxo (upper left), carbachol (upper right), and compounds 6A (lower left) and 7A (lower right) interactions with the receptor were calculated from MD trajectories using Ligand Interaction Diagram in Maestro. Ligand–receptor interactions are categorized into four types: hydrogen bonds (green), hydrophobic (cyan), ionic (red), and water bridges (blue). The stacked bar charts are normalized over the course of the trajectory. Values over 1.0 are possible as some protein residues may make multiple contacts of the same type with the ligand within one time frame
Using “Dynamical Network Analysis” of MD trajectory, we analysed the network of allosteric interactions from the ligand to the receptor G‐protein interface (e.g., Arg121 and Glu382; Figure S8). Optimal path of allosteric interactions from ligand to Arg121 in the edge of the TM3 helix led through Asp103–Val106–Ala109–Met112–Leu115–Ser118 in case of iperoxo; Asn108–Met112–Leu115–Ser118 in case of carbachol; and Ser107–Val111–Leu114–Ser118 in case of compounds 6A and 7A (Figure S8, blue path). Thus, new compounds relay conformational change to Arg121 via an allosteric network that differed from that of the classical agonist and that converges at Ser118. Allosteric networks of carbachol and iperoxo converge at Met112 but are initiated by different residues within the orthosteric binding site. Optimal path of allosteric interactions from ligand to Glu382 in the edge of TM6 helix led through Asn404–Thr399–Ala 395–Ala391–Arg387–Leu384 in case of iperoxo; Cys429–Thr399–Phe396–Ile392–Ile389–Thr386 in case of carbachol; and Phe195–Trp400–Ile397–Leu393–Ile389–Val385 in case of compounds 6A and 7A (Figure S8, red path). The first suboptimal path of carbachol started at Asn404. The first suboptimal path of new compounds started at Trp400. Thus, the new compounds relay conformational change to Glu382 via allosteric networks that are all the way different from those used by classical agonists. The allosteric network of carbachol is also substantially different from that of iperoxo.
Measurements of intramolecular distances over the MD trajectory were made to analyse conformational changes induced by agonists. Individual agonists did not change the size of binding site (distance between Asp103 and Asn404) significantly. In addition, the RMSD of NPxxY switch (Arg436, Pro437, and Tyr440) was similar for all agonists. Agonist induced different degree of opening of the receptor G‐protein interface (distance of TM3 to TM6 and distance of TM5 to TM7). Respective distances in the receptor complex with modelled agonists varied from the ligand‐free receptor (apo structure, Figures 9 and S5, black). The TM3 to TM6 distance was greater (about 16 Å) in case of the receptor complex with carbachol (Figures 9 and S5, red) than in the apo structure. At the other complexes, the TM3 to TM6 distance was similar to that in the apo structure. Compound 7A (cyan) induced almost no tilt of TM6 away from its inactive conformation (blue; Figure S6). Carbachol (red) induced greater tilt of TM6 than compound 7A but smaller than iperoxo (yellow). Carbachol induced slightly small tilt and shift of TM6 in M2 receptor (yellow) than in M1 receptor (green; Figures S6 and S7). The TM5 to TM7 distance was much smaller (about 18 Å) in the complexes of compounds 6A and 7A (Figures 9 and S5, magenta and cyan, respectively) than in the apo structure and iperoxo or carbachol complexes (about 21 Å). Monitoring distances between residues at the edge of TMs, Arg121 in TM3 to Glu382 in TM6, and Tyr206 in TM5 to Tyr440 in TM7 gave similar results with greater variation among agonists but also greater variation within individual MD trajectory. Overall opening of the receptor G‐protein interface induced by compounds 6A and 7A was smaller than the opening induced by carbachol or iperoxo. Taken together, molecular modelling data suggest agonist‐specific binding of compounds 6A and 7A followed by agonist‐specific conformation.
Figure 9.

Simulation of MD. The distance between TM5 and TM7 (abscissa) and between TM3 and TM6 (ordinate) in individual time frames of MD of the M2 receptor in an active conformation (4MQS) with bound agonists, iperoxo or carbachol, and compounds 6A and 7A or with an empty binding site (apo)
Comparison of cryo‐EM structures 6OIJ and 6KOI of G‐protein complexes of iperoxo bound receptors in an active conformation (Maeda, Qu, Robertson, Skiniotis, & Kobilka, 2019) shows that the outward tilt of TM6 and intracellular shift of TM5 are greater in M1–G11 complex than M2–GoA complex (Figure S7). The distance between TM3 and TM6 is greater at M1 (16.9 Å) than at M2 receptor (14.6 Å). Also, the distance between TM5 and TM7 is slightly greater at M1 (20.8 Å) than at M2 receptor (19.9 Å). The insertion of the C‐terminus of the GoA α‐subunit to M2 receptor is shallower and at different angle than the insertion of C‐terminus of G11 α‐subunit to M1 receptor. Overall, greater conformational change of the receptor is needed to accommodate the G11 C‐terminus than the GoA C‐terminus.
4. DISCUSSION
The major achievement of this study is the development of novel muscarinic agonists that are selective for M2 receptors and exhibit bias for Gi proteins, resulting in selective inhibition of production of cAMP (Figure 10).
Figure 10.

Scheme of signalling bias of novel compounds. Comparison of activation of Gi, Gq, and Gs signalling pathways by carbachol (CBC) and compounds 6A and 7A (A, right) leading to inhibition of cAMP production (Gi) or stimulation of production of IPX (Gq) or of cAMP (Gs). Thickness of arrows denotes efficacy: thick arrow—high efficacy, thin arrow—low efficacy, dotted arrow—no activity. Carbachol activates Gq and Gs pathways via all receptor subtypes and Gi pathway via M2 and M4. It has no Gi efficacy at M1 and M3. Compounds 6A and 7A activate Gi pathway with high efficacy via all subtypes and Gq pathway with low efficacy via M1, M3, and M5. They have no Gs efficacy at any receptor subtype
The phenomenon of stabilization of a particular active conformation of a receptor and consequent stimulation of some responses but not others, has been termed signalling bias (Kenakin & Christopoulos, 2013). Recent reports on muscarinic agonists have shown compounds with only modest signalling bias (Fish et al., 2017; Masuho et al., 2015). A specific signalling pathway may be activated by the interaction of an agonist with a specific amino acid within the orthosteric binding site. Such residues are termed functional hot spots (Nivedha et al., 2018). Relatively small agonists may bind only to some, not all, functional hot spots in the binding site, and thus activate only a subset of signalling pathways that result in ligand‐mediated signalling bias.
M2 and M4 receptors preferentially activate the Gi/o signalling pathway and inhibit cAMP synthesis; M1, M3, and M5 receptors preferentially activate the Gq/11 signalling pathway and stimulate PLC, increasing the levels of https://www.guidetopharmacology.org/GRAC/LigandDisplayForward?ligandId=4222 and intracellular calcium (Eglen, 2012). Muscarinic receptors also couple to non‐preferential G‐proteins (Jakubík et al., 2006; Michal, El‐Fakahany, & Dolezal, 2007; Michal, El‐Fakahany, & Doležal, 2014). It has been proposed that some muscarinic agonists, such as analogues of https://www.guidetopharmacology.org/GRAC/LigandDisplayForward?ligandId=296, do not interact with the asparagine residue in the sixth transmembrane α‐helix (Asn6.52 Ballesteros–Weinstein numbering, Ballesteros & Weinstein, 1995) of the orthosteric binding site and exert bias towards Gi/o signalling pathway (Fish et al., 2017). Considering this, we synthesized small muscarinic agonists. New compounds are 1‐substituted‐1‐[(5‐substituted thiophen‐2‐yl)methyl]‐3,6‐dihydro‐2H‐pyridin‐1‐ium salts (Figure S1 and Table S1). These compounds displayed a range of potency and efficacy to stimulate muscarinic receptors, mainly being partial agonists.
In measurements of functional response to agonists, the two most efficacious compounds (6A and 7A) only inhibited the forskolin‐stimulated synthesis of cAMP at M2 and M4 receptors (Figure 2). In contrast to the classical non‐selective agonist carbachol, compounds 6A and 7A did not activate the Gs pathway (Figures 2 and 3). To compare agonistic effects, the operational efficacies τ (Black & Leff, 1983) and agonist equilibrium dissociation constants K A were calculated according to a recently developed procedure (Jakubík et al., 2019; Figure 4 and Tables S4 and S5). The classical definition of bias states that “A biased agonist is a ligand which stabilizes a particular active conformation of a receptor thus stimulating some responses but not others” (Lefkowitz, 2013). In line with this definition, compounds 6A and 7A, in contrast to carbachol, only inhibited production of cAMP at M2 and M4 receptors displaying Gi bias (Figures 2 and 3). Similarly, at M1 and M3 receptors, compounds 6A and 7A inhibited cAMP production, while carbachol did not. Values of τ and K A were used to further quantify bias using the ΔΔlog(τ/K A) method (Kenakin & Christopoulos, 2013) that is reformulation of Equation (6) for relative intrinsic activities (RAi; Griffin et al., 2007; Tables 1, S4, and S5). Besides its “absolute” Gi bias at M1 through M4 receptors, compounds 6A and 7A exerted Gi bias at M5 receptors. RAi relative to the reference agonist carbachol Equation (7) (Griffin et al., 2007) of preferential functional response of compounds 6A and 7A were highest at M2 receptors, suggesting their M2 selectivity (Tables 1, S4, and S5). Good correlation between RAi values obtained according to Equations (6) and (7) suggests that τ and K A values derived from EC50 and E′MAX according to Jakubík et al. (2019) are correct.
Gi/o G‐proteins were inactivated by PTX treatment to exclude the possibility that preferential coupling of M2 and M4 receptors to Gi/o G‐proteins (Figure 5) obscured signalling via Gs G‐proteins. Unlike carbachol, compounds 6A and 7A did not activate Gs G‐proteins in PTX‐treated cells. Thus, activation of Gi G‐proteins did not obscure potential activation of Gs pathway by compounds 6A and 7A. It is expected that inactivation of Gi G‐proteins by PTX removes Gi G‐proteins from the competition of various G‐proteins for receptor and EC50 of carbachol stimulatory response should decrease. However, carbachol EC50 remained unchanged. This may suggest that PTX only inactivates Gi G‐proteins and Gi G‐proteins remain pre‐coupled with M2 and M4 receptors (Jakubík, Janíčková, Randáková, El‐Fakahany, & Doležal, 2011) after PTX treatment and still compete with Gs G‐proteins.
The heterologous expression and expression level of receptors and members of the signalling pathways, including G‐proteins and effectors, may influence coupling selectivity. To exclude contribution of this system bias, the functional response to compounds 6A and 7A was also measured ex vivo in digests of several rat tissues (Figure 6) and primary culture of rat smooth muscle cells (Figure 7). Similar to CHO cells, 6A and 7A only inhibited cAMP production (activated the Gi/o signalling pathway). The cerebellum predominantly expresses M2, and the striatum expresses M4 and M2 receptors (Eglen, 2012). The expression level of muscarinic receptors in these brain tissues is more than 10 times lower than in CHO cells (Table S6). Lower expression levels should lead to lower apparent E′MAX, especially for partial agonists (Black & Leff, 1983). However, compounds 6A and 7A inhibited cAMP production to the same extent as carbachol (Figure 6), suggesting that they are full agonists at these receptors. In contrast, efficacy to stimulate IPX production of compounds 6A and 7A in brain cortex that predominantly expresses M1 receptors and the submaxillary gland that predominantly expresses M3 receptors was negligible, suggesting that compounds 6A and 7A lack significant efficacy at these receptors. About 80% of muscarinic receptors expressed by smooth muscle cells are M2, and the rest are mainly M3 receptors (Eglen, 2012). Compounds 6A and 7A inhibited cAMP production via the M2 receptor to the same extent as carbachol but did not stimulate IPX production via M3 receptors, confirming that these compounds are full agonists at M2 and partial agonists at M3 receptors.
Molecular dynamics of muscarinic agonists docked to the model of the M2 receptor in an active conformation (PDB ID: 4MQS) confirmed the absence of interaction of compounds 6A and 7A with Asn404 in the sixth transmembrane α‐helix (Asn6.52) that is essential for binding of the super‐agonist iperoxo and the full agonist carbachol (Figures 8 and S4). Allosteric interaction networks leading from the agonist to the receptor G‐protein interface of compounds 6A and 7A were different from the allosteric network of iperoxo and carbachol (Figure S8). Receptor conformations specific to compounds 6A and 7A were further confirmed by the smaller distance between TM5 and TM7 upon binding of these compounds in comparison to iperoxo or carbachol (Figure 9). Taken together, the absence of a hydrogen bond of compounds 6A and 7A with Asn404, their differential allosteric interaction network, and finding of conformations specific for compounds 6A and 7A support the theory of functional hot spots (Nivedha et al., 2018) as well as variation among allosteric interaction networks in dependence on receptor conformation (Bhattacharya & Vaidehi, 2014; Miao, Nichols, Gasper, Metger, & McCammon, 2013). A common mechanism of GPCR activation is “opening” of the receptor G‐protein interface by moving TM6 away from TM3 and TM7 away from TM5 (Deupi & Kobilka, 2007; Weis & Kobilka, 2018). The position of the TM6 was especially implicated in coupling selectivity of rhodopsin and β2‐https://www.guidetopharmacology.org/GRAC/ObjectDisplayForward?objectId=29s (Rose et al., 2014; Semack, Sandhu, Malik, Vaidehi, & Sivaramakrishnan, 2016). It has been shown that coupling of various GPCRs to Gs G‐proteins requires a greater degree of TM6 movement than coupling to Gi G‐proteins (Glukhova et al., 2018). Cryo–electron microscopy (cryo‐EM) structures 6OIJ and 6KOI of complexes of muscarinic receptors with G‐proteins (Maeda et al., 2019) further show that greater conformational change of the receptor is needed to accommodate C‐terminus of G11 G‐protein than GoA G‐protein (Figure S7). The molecular modelling data presented here showed that agonist‐specific conformations of compounds 6A or 7A differed from agonist‐specific conformations of iperoxo or carbachol by having less effects in increasing the distance between TM5 and TM7 than that between TM3 and TM6 (Figures 9 and S5 through S7). Molecular modelling data thus suggest that coupling selectivity can be reached in various ways. In this case, data suggest that, unlike iperoxo or carbachol interacting with Asn404, compounds 6A and 7A interact with Phe195 and/or Trp400 having a shorter lever to push TM7 away from TM5. Our findings are in accordance with the recently published structures 6OIJ and 6OIK (Maeda et al., 2019) showing also different orientation of TM5 and TM7 during interaction of the GoA α‐subunit with the M2 receptor when compared to interaction of the G11 α‐subunit with the M1 receptor (Figure S7). Overall, our present molecular modelling data are in a good agreement with a general rule observed in cryo‐EM structures of GPCRs (Glukhova et al., 2018). Gs and G11 coupling receptors show a greater degree of G‐protein interface opening than Gi/o coupling receptors. In turn, molecular modelling data are in a good agreement with experimental data. Compounds 6A and 7A that cause a small opening of G‐protein interface in silico activate only Gi/o signalling pathway in vitro. Carbachol that causes a greater opening of the G‐protein interface in silico activates all three studied signalling pathways in vitro.
The tradition of chewing betel for its stimulating effects and pain relief dates back thousands of years. These effects of betel have been ascribed to the muscarinic agonists arecoline and https://www.guidetopharmacology.org/GRAC/LigandDisplayForward?ligandId=9487 present in areca (betel) nut. Muscarinic agonists can produce strong analgesic effects, at the peripheral, spinal, and brain levels. Analgesic effects of the muscarinic agonist oxotremorine in the tail flick and hot plate tests were largely reduced in M2 knockout mice and absent in M2/M4 double knockout mice (Duttaroy et al., 2002). Several lines of evidence suggest that M2 and M4 receptors inhibit pain transmission at the spinal level (Chen & Pan, 2004) and suggest the potential of M2 agonists as analgesics (Wess et al., 2007). The proposed mechanism of peripheral analgesia mediated by M2 receptors is in principle similar to the analgesia mediated by opioid receptors. Activation of M2 or https://www.guidetopharmacology.org/GRAC/ObjectDisplayForward?objectId=319 leads to activation of Gi/o G‐proteins. The active α‐subunits released from activated Gi/o G‐proteins inhibit AC. The consequent decrease in cAMP causes attenuation in the activity of tetrodotoxin‐resistant https://www.guidetopharmacology.org/GRAC/FamilyDisplayForward?familyId=82. The βγ dimers released from activated Gi/o G‐proteins activate https://www.guidetopharmacology.org/GRAC/FamilyDisplayForward?familyId=74. A decrease in the activity of sodium channels and activation of potassium channels results in a decrease in excitability of nociceptive sensory neurons (De Angelis & Maria Tata, 2016). Moreover, in a model of chronic neuropathic pain, reduction of the expression of M2 receptors in the dorsal root ganglion was accompanied by a diminished analgesic response to muscarinic agonists (Zhang, Chen, Chen, & Pan, 2018), confirming the role of M2 receptor in spinal nociceptive transmission. In contrast to pain, secretion of exocrine and endocrine glands and smooth muscle contraction is mediated primarily by Gq G‐proteins activated by M3 receptors (Ehlert, 2003; Stengel, Yamada, Wess, & Cohen, 2002). Sole activation of M2 and M4 receptors may prevent some undesired side effects of common non‐selective muscarinic agonists, including excessive sweating and salivation and, importantly, incontinence mediated by peripheral M3 receptors. Restricting unwanted side effects of M2 receptor activation, for example, bradycardia or smooth muscle contraction in chronic pulmonary obstructive disease and other smooth muscle related diseases, will require either topical administration (Wess et al., 2007) or advanced approaches like targeted drug delivery or tissue‐selective action (Seemann et al., 2017). If analgesic effects are confirmed in vivo, compounds 6A and 7A may serve as lead compounds in the search for novel non‐steroidal, non‐opioid analgesics.
CONFLICT OF INTEREST
The authors declare no conflicts of interest.
AUTHOR CONTRIBUTIONS
A.R. conducted experiments and data analysis and contributed to experimental design and manuscript, D.N. and D.U. conducted experiments and managed cell lines, P.N. and Q.S. synthesized compounds, V.D. and E.E.E. contributed to experimental design and manuscript, J.B. managed design and synthesis of compounds and contributed to manuscript, J.J. conducted molecular modelling, managed experimental design, experiments, and data analysis, and wrote manuscript. All co‐authors approved final version of manuscript.
DECLARATION OF TRANSPARENCY AND SCIENTIFIC RIGOUR
This Declaration acknowledges that this paper adheres to the principles for transparent reporting and scientific rigour of preclinical research as stated in the BJP guidelines for https://bpspubs.onlinelibrary.wiley.com/doi/abs/10.1111/bph.14207, and https://bpspubs.onlinelibrary.wiley.com/doi/full/10.1111/bph.14206, and as recommended by funding agencies, publishers, and other organizations engaged with supporting research.
Supporting information
Data S1 Supporting information
ACKNOWLEDGEMENTS
This work was supported by the Czech Academy of Sciences Support RVO:67985823, the Grant Agency of the Czech Republic Grant 17‐16182S, and the Physical Science Department at Barry University. We thank Dr. Bačáková (Department of Biomaterials and Tissue Engineering, Institute of Physiology CAS) for providing us with primary cell culture of smooth muscle cells. Access to computing and storage facilities owned by parties and projects contributing to the Czech National Grid Infrastructure MetaCentrum provided under the programme “Projects of Large Research, Development, and Innovations Infrastructures” (CESNET LM2015042) is greatly appreciated.
Randáková A, Nelic D, Ungerová D, et al. Novel M2‐selective, Gi‐biased agonists of muscarinic acetylcholine receptors. Br J Pharmacol. 2020;177:2073–2089. 10.1111/bph.14970
REFERENCES
- Alexander, S. P. H. , Christopoulos, A. , Davenport, A. P. , Kelly, E. , Mathie, A. , Peters, J. A. , … CGTP Collaborators (2019). The Concise Guide To PHARMACOLOGY 2019/20: G protein‐coupled receptors. British Journal of Pharmacology, 176, S21–S141. 10.1111/bph.14748 [DOI] [PMC free article] [PubMed] [Google Scholar]
- Alexander, S. P. H. , Fabbro, D. , Kelly, E. , Mathie, A. , Peters, J. A. , Veale, E. L. , … CGTP Collaborators (2019). The Concise Guide To PHARMACOLOGY 2019/20: Enzymes. British Journal of Pharmacology, 176, S297–S396. 10.1111/bph.14752 [DOI] [PMC free article] [PubMed] [Google Scholar]
- Alexander, S. P. H. , Mathie, A. , Peters, J. A. , Veale, E. L. , Striessnig, J. , Kelly, E. , … CGTP Collaborators (2019). The Concise Guide To PHARMACOLOGY 2019/20: Ion channels. British Journal of Pharmacology, 176, S142–S228. 10.1111/bph.14749 [DOI] [PMC free article] [PubMed] [Google Scholar]
- Bacáková, L. , Lisá, V. , Pellicciari, C. , Mares, V. , Bottone, M. G. , & Kocourek, F. (1997). Sex related differences in the adhesion, migration, and growth of rat aortic smooth muscle cells in culture. In Vitro Cellular & Developmental Biology. Animal, 33, 410–413. 10.1007/s11626-997-0055-9 [DOI] [PubMed] [Google Scholar]
- Ballesteros, J. A. , & Weinstein, H. (1995). Integrated methods for the construction of three‐dimensional models and computational probing of structure‐function relations in G protein‐coupled receptors. Methods Neuroscience, 25, 366–428. [Google Scholar]
- Bhattacharya, S. , & Vaidehi, N. (2014). Differences in allosteric communication pipelines in the inactive and active states of a GPCR. Biophysical Journal, 107, 422–434. 10.1016/j.bpj.2014.06.015 [DOI] [PMC free article] [PubMed] [Google Scholar]
- Black, J. W. , & Leff, P. (1983). Operational models of pharmacological agonism. Proceedings of the Royal society of London. Series B. Biological sciences, 220, 141–162. [DOI] [PubMed] [Google Scholar]
- Bologna, Z. , Teoh, J. P. , Bayoumi, A. S. , Tang, Y. , & Kim, I. M. (2017). Biased G protein‐coupled receptor signaling: New player in modulating physiology and pathology. Biomolecules & Therapeutics, 25, 12–25. 10.4062/biomolther.2016.165 [DOI] [PMC free article] [PubMed] [Google Scholar]
- Boulos, J. , Jakubík, J. , Randáková, A. , & Avila, C. (2013). Synthesis of N‐substituted piperidine salts as potential muscarinic ligands for Alzheimer's applications. Journal of Heterocyclic Chemistry, 50, 1363–1367. [Google Scholar]
- Boulos, J. F. , Jakubik, J. , Boulos, J. M. , Randakova, A. , & Momirov, J. (2017). Synthesis of novel and functionally selective non‐competitive muscarinic antagonists as chemical probes. Chemical Biology & Drug Design, 1–12. [DOI] [PubMed] [Google Scholar]
- Chen, S. R. , & Pan, H. L. (2004). Activation of muscarinic receptors inhibits spinal dorsal horn projection neurons: Role of GABAB receptors. Neuroscience, 125, 141–148. 10.1016/j.neuroscience.2004.01.015 [DOI] [PubMed] [Google Scholar]
- Curtis, M. J. , Alexander, S. , Cirino, G. , Docherty, J. R. , George, C. H. , Giembycz, M. A. , … Ahluwalia, A. (2018). Experimental design and analysis and their reporting II: Updated and simplified guidance for authors and peer reviewers. British Journal of Pharmacology, 175, 987–993. 10.1111/bph.14153 [DOI] [PMC free article] [PubMed] [Google Scholar]
- De Angelis, F. , & Maria Tata, A. (2016). Analgesic effects mediated by muscarinic receptors: Mechanisms and pharmacological approaches. Central Nervous System Agents in Medicinal Chemistry, 16, 218–226. 10.2174/1871524916666160302103033 [DOI] [PubMed] [Google Scholar]
- Deupi, X. , & Kobilka, B. (2007). Activation of G protein‐coupled receptors. Advances in Protein Chemistry, 74, 137–166. 10.1016/S0065-3233(07)74004-4 [DOI] [PubMed] [Google Scholar]
- DeWire, S. M. , Yamashita, D. S. , Rominger, D. H. , Liu, G. , Cowan, C. L. , Graczyk, T. M. , … Violin, J. D. (2013). A G protein‐biased ligand at the μ‐opioid receptor is potently analgesic with reduced gastrointestinal and respiratory dysfunction compared with morphine. The Journal of Pharmacology and Experimental Therapeutics, 344, 708–717. 10.1124/jpet.112.201616 [DOI] [PubMed] [Google Scholar]
- Duttaroy, A. , Gomeza, J. , Gan, J.‐W. , Siddiqui, N. , Basile, A. S. , Harman, W. D. , … Wess, J. (2002). Evaluation of muscarinic agonist‐induced analgesia in muscarinic acetylcholine receptor knockout mice. Molecular Pharmacology, 62, 1084–1093. 10.1124/mol.62.5.1084 [DOI] [PubMed] [Google Scholar]
- Eglen, R. M. (2012). Overview of muscarinic receptor subtypes In Fryer A. D., Christopoulos A., & Nathanson N. M. (Eds.), In Handb Exp Pharmacol (pp. 3–28). Springer. [DOI] [PubMed] [Google Scholar]
- Ehlert, F. J. (2003). Contractile role of M2 and M3 muscarinic receptors in gastrointestinal, airway and urinary bladder smooth muscle. Life Sciences, 74, 355–366. 10.1016/j.lfs.2003.09.023 [DOI] [PubMed] [Google Scholar]
- El‐Fakahany, E. E. , & Jakubik, J. (2016). Radioligand binding at muscarinic receptors In Myslivecek J., & Jakubik J. (Eds.), Springer Science + Business Media LLCMuscarinic receptor: From structure to animal models (pp. 37–68). New York: Humana Press. [Google Scholar]
- Fish, I. , Stößel, A. , Eitel, K. , Valant, C. , Albold, S. , Huebner, H. , … Gmeiner, P. (2017). Structure‐based design and discovery of new M2 receptor agonists. Journal of Medicinal Chemistry, 60, 9239–9250. 10.1021/acs.jmedchem.7b01113 [DOI] [PMC free article] [PubMed] [Google Scholar]
- Glukhova, A. , Draper‐Joyce, C. J. , Sunahara, R. K. , Christopoulos, A. , Wootten, D. , & Sexton, P. M. (2018). Rules of engagement: GPCRs and G proteins. ACS Pharmacol. Transl. Sci., 1, 73–83. [DOI] [PMC free article] [PubMed] [Google Scholar]
- Griffin, M. T. , Figueroa, K. W. , Liller, S. , & Ehlert, F. J. (2007). Estimation of agonist activity at G protein‐coupled receptors: Analysis of M2 muscarinic receptor signaling through Gi/o, Gs, and G15. The Journal of Pharmacology and Experimental Therapeutics, 321, 1193–1207. 10.1124/jpet.107.120857 [DOI] [PubMed] [Google Scholar]
- Haga, K. , Kruse, A. C. , Asada, H. , Yurugi‐Kobayashi, T. , Shiroishi, M. , Zhang, C. , … Kobayashi, T. (2012). Structure of the human M2 muscarinic acetylcholine receptor bound to an antagonist. Nature, 482, 547–551. 10.1038/nature10753 [DOI] [PMC free article] [PubMed] [Google Scholar]
- Harding, S. D. , Sharman, J. L. , Faccenda, E. , Southan, C. , Pawson, A. J. , Ireland, S. , … NC‐IUPHAR (2018). The IUPHAR/BPS Guide to PHARMACOLOGY in 2018: Updates and expansion to encompass the new guide to IMMUNOPHARMACOLOGY. Nucleic Acids Research, 46, D1091–D1106. 10.1093/nar/gkx1121 [DOI] [PMC free article] [PubMed] [Google Scholar]
- Hermans, E. (2003). Biochemical and pharmacological control of the multiplicity of coupling at G‐protein‐coupled receptors. Pharmacology & Therapeutics, 99, 25–44. 10.1016/s0163-7258(03)00051-2 [DOI] [PubMed] [Google Scholar]
- Jakubík, J. , Bačáková, L. , Lisá, V. , El‐Fakahany, E. E, & Tuček, S. , (1996). Activation of muscarinic acetylcholine receptors via their allosteric binding sites. Proceedings of the National Academy of Sciences of the United States of America, 93, 8705–8709. 10.1073/pnas.93.16.8705 [DOI] [PMC free article] [PubMed] [Google Scholar]
- Jakubík, J. , El‐Fakahany, E. E. , & Dolezal, V. (2006). Differences in kinetics of xanomeline binding and selectivity of activation of G proteins at M1 and M2 muscarinic acetylcholine receptors. Molecular Pharmacology, 70, 656–666. [DOI] [PubMed] [Google Scholar]
- Jakubík, J. , El‐Fakahany, E. E. , & Doležal, V. (2015). Towards predictive docking at aminergic G‐protein coupled receptors. Journal of Molecular Modeling, 21, 284 10.1007/s00894-015-2824-9 [DOI] [PubMed] [Google Scholar]
- Jakubík, J. , Janíčková, H. , Randáková, A. , El‐Fakahany, E. E. , & Doležal, V. (2011). Subtype differences in pre‐coupling of muscarinic acetylcholine receptors. PLoS ONE, 6, e27732 10.1371/journal.pone.0027732 [DOI] [PMC free article] [PubMed] [Google Scholar]
- Jakubík, J. , Randáková, A. , Rudajev, V. , Zimčík, P. , El‐Fakahany, E. E. , & Doležal, V. (2019). Applications and limitations of fitting of the operational model to determine relative efficacies of agonists. Scientific Reports, 9, 4637 10.1038/s41598-019-40993-w [DOI] [PMC free article] [PubMed] [Google Scholar]
- Kenakin, T. , & Christopoulos, A. (2013). Signalling bias in new drug discovery: Detection, quantification and therapeutic impact. Nature Reviews. Drug Discovery, 12, 205–216. 10.1038/nrd3954 [DOI] [PubMed] [Google Scholar]
- Kilkenny, C. , Browne, W. , Cuthill, I. C. , Emerson, M. , & Altman, D. G. (2010). Animal research: Reporting in vivo experiments: The ARRIVE guidelines. British Journal of Pharmacology, 160, 1577–1579. [DOI] [PMC free article] [PubMed] [Google Scholar]
- Kruse, A. C. , Hu, J. , Pan, A. C. , Arlow, D. H. , Rosenbaum, D. M. , Rosemond, E. , … Kobilka, B. K. (2012). Structure and dynamics of the M3 muscarinic acetylcholine receptor. Nature, 482, 552–556. 10.1038/nature10867 [DOI] [PMC free article] [PubMed] [Google Scholar]
- Kruse, A. C. , Ring, A. M. , Manglik, A. , Hu, J. , Hu, K. , Eitel, K. , … Kobilka, B. K. (2013). Activation and allosteric modulation of a muscarinic acetylcholine receptor. Nature, 504, 101–106. 10.1038/nature12735 [DOI] [PMC free article] [PubMed] [Google Scholar]
- Laugwitz, K. L. , Allgeier, A. , Offermanns, S. , Spicher, K. , Van Sande, J. , Dumont, J. E. , & Schultz, G. (1996). The human thyrotropin receptor: A heptahelical receptor capable of stimulating members of all four G protein families. Proceedings of the National Academy of Sciences, 93, 116–120. 10.1073/pnas.93.1.116 [DOI] [PMC free article] [PubMed] [Google Scholar]
- Lefkowitz, R. J. (2013). A brief history of G‐protein coupled receptors (Nobel Lecture). Angewandte Chemie (International Ed. in English), 52, 6366–6378. [DOI] [PubMed] [Google Scholar]
- Maeda, S. , Qu, Q. , Robertson, M. J. , Skiniotis, G. , & Kobilka, B. K. (2019). Structures of the M1 and M2 muscarinic acetylcholine receptor/G‐protein complexes. Science, 364, 552–557. 10.1126/science.aaw5188 [DOI] [PMC free article] [PubMed] [Google Scholar]
- Manglik, A. , Lin, H. , Aryal, D. K. , McCorvy, J. D. , Dengler, D. , Corder, G. , … Shoichet, B. K. (2016). Structure‐based discovery of opioid analgesics with reduced side effects. Nature, 537, 185–190. 10.1038/nature19112 [DOI] [PMC free article] [PubMed] [Google Scholar]
- Masuho, I. , Ostrovskaya, O. , Kramer, G. M. , Jones, C. D. , Xie, K. , & Martemyanov, K. A. (2015). Distinct profiles of functional discrimination among G proteins determine the actions of G protein‐coupled receptors. Science Signaling, 8, 1–16. [DOI] [PMC free article] [PubMed] [Google Scholar]
- Miao, Y. , Nichols, S. S. E. S. , Gasper, P. P. M. P. , Metger, V. , & McCammon, J. A. (2013). Activation and dynamic network of the M2 muscarinic receptor. Proceedings of the National Academy of Sciences of the United States of America, 110, 10982–10987. 10.1073/pnas.1309755110 [DOI] [PMC free article] [PubMed] [Google Scholar]
- Michal, P. , El‐Fakahany, E. E. , & Dolezal, V. (2007). Muscarinic M2 receptors directly activate Gq/11 and Gs G‐proteins. The Journal of Pharmacology and Experimental Therapeutics, 320, 607–614. 10.1124/jpet.106.114314 [DOI] [PubMed] [Google Scholar]
- Michal, P. , El‐Fakahany, E. E. , & Doležal, V. (2014). Changes in membrane cholesterol differentially influence preferential and non‐preferential signaling of the M1 and M3 muscarinic acetylcholine receptors. Neurochemical Research, 40, 2068–2077. [DOI] [PMC free article] [PubMed] [Google Scholar]
- Nivedha, A. , Tautermann, C. , Bhattacharya, S. , Lee, S. , Casarosa, P. , Kollak, I. , … Vaidehi, N. (2018). Identifying functional hotspot residues for biased ligand design in G‐protein‐coupled receptors. Molecular Pharmacology, 93, 288–296. 10.1124/mol.117.110395 [DOI] [PMC free article] [PubMed] [Google Scholar]
- Offermanns, S. , & Simon, M. I. (1995). Gα15 and Gα16 couple a wide variety of receptors to phospholipase C. The Journal of Biological Chemistry, 270, 15175–15180. 10.1074/jbc.270.25.15175 [DOI] [PubMed] [Google Scholar]
- Randáková, A. , Dolejší, E. , Rudajev, V. , Zimčík, P. , Doležal, V. , & El‐Fakahany, E. E. , (2018). Role of membrane cholesterol in differential sensitivity of muscarinic receptor subtypes to persistently bound xanomeline. Neuropharmacology, 133, 129–144. 10.1016/j.neuropharm.2018.01.027 [DOI] [PubMed] [Google Scholar]
- Rose, A. S. , Elgeti, M. , Zachariae, U. , Grubmüller, H. , Hofmann, K. P. , Scheerer, P. , & Hildebrand, P. W. (2014). Position of transmembrane helix 6 determines receptor G protein coupling specificity. Journal of the American Chemical Society, 136, 11244–11247. 10.1021/ja5055109 [DOI] [PubMed] [Google Scholar]
- Sastry, G. M. , Adzhigirey, M. , Day, T. , Annabhimoju, R. , & Sherman, W. (2013). Protein and ligand preparation: Parameters, protocols, and influence on virtual screening enrichments. Journal of Computer‐Aided Molecular Design, 27, 221–234. 10.1007/s10822-013-9644-8 [DOI] [PubMed] [Google Scholar]
- Seemann, W. K. , Wenzel, D. , Schrage, R. , Etscheid, J. , Bödefeld, T. , Bartol, A. , … Mohr, K. (2017). Engineered context‐sensitive agonism: Tissue‐selective drug signaling through a G protein‐coupled receptor. The Journal of Pharmacology and Experimental Therapeutics, 360, 289–299. 10.1124/jpet.116.237149 [DOI] [PubMed] [Google Scholar]
- Semack, A. , Sandhu, M. , Malik, R. U. , Vaidehi, N. , & Sivaramakrishnan, S. (2016). Structural elements in the Gαs and Gαq C termini that mediate selective G protein‐coupled receptor (GPCR) signaling. The Journal of Biological Chemistry, 291, 17929–17940. 10.1074/jbc.M116.735720 [DOI] [PMC free article] [PubMed] [Google Scholar]
- Sethi, A. , Eargle, J. , Black, A. A. , & Luthey‐Schulten, Z. (2009). Dynamical networks in tRNA:protein complexes. Proceedings of the National Academy of Sciences of the United States of America, 106, 6620–6625. 10.1073/pnas.0810961106 [DOI] [PMC free article] [PubMed] [Google Scholar]
- Stengel, P. W. , Yamada, M. , Wess, J. , & Cohen, M. L. (2002). M3‐receptor knockout mice: Muscarinic receptor function in atria, stomach fundus, urinary bladder, and trachea. American Journal of Physiology. Regulatory, Integrative and Comparative Physiology, 282, R1443–R1449. [DOI] [PubMed] [Google Scholar]
- Tata, A. M. (2008). Muscarinic acetylcholine receptors: new potential therapeutic targets in antinociception and in cancer therapy. Recent Patents on CNS Drug Discovery, 3, 94–103. [DOI] [PubMed] [Google Scholar]
- Thal, D. M. , Sun, B. , Feng, D. , Nawaratne, V. , Leach, K. , Felder, C. C. , … Christopoulos, A. (2016). Crystal structures of the M1 and M4 muscarinic acetylcholine receptors. Nature, 531, 335–340. 10.1038/nature17188 [DOI] [PMC free article] [PubMed] [Google Scholar]
- Weis, W. I. , & Kobilka, B. K. (2018). The molecular basis of G protein‐coupled receptor activation. Annual Review of Biochemistry, 87, 897–919. 10.1146/annurev-biochem-060614-033910 [DOI] [PMC free article] [PubMed] [Google Scholar]
- Wess, J. , Eglen, R. M. , & Gautam, D. (2007). Muscarinic acetylcholine receptors: Mutant mice provide new insights for drug development. Nature Reviews. Drug Discovery, 6, 721–733. 10.1038/nrd2379 [DOI] [PubMed] [Google Scholar]
- Zhang, J. , Chen, S.‐R. , Chen, H. , & Pan, H.‐L. (2018). RE1‐silencing transcription factor controls the acute‐to‐chronic neuropathic pain transition and Chrm2 receptor gene expression in primary sensory neurons. The Journal of Biological Chemistry, 293, 19078–19091. 10.1074/jbc.RA118.005846 [DOI] [PMC free article] [PubMed] [Google Scholar]
Associated Data
This section collects any data citations, data availability statements, or supplementary materials included in this article.
Supplementary Materials
Data S1 Supporting information