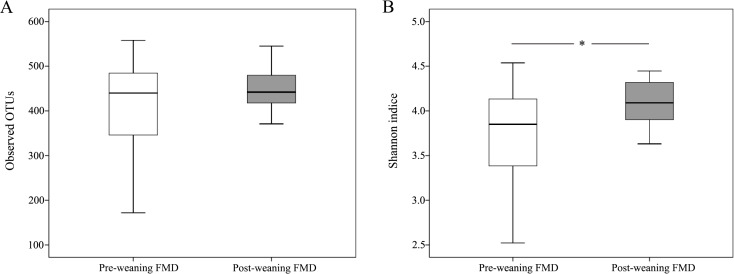
Figure 2. Variations in alpha diversity of the pre-weaning and post-weaning forest musk deer.
(A) Comparisons of the number of observed OTUs between pre-weaning and post-weaning forest musk deer. (B) Comparisons of Shannon indices between pre-weaning and post-weaning forest musk deer. In all panels, boxes represent the interquartile range (IQR) between the first and third quartiles. The lines inside boxes represent the median. Whiskers denote the lowest and highest values within 1.5 IQR from the first and third quartiles, respectively. *P < 0.05 (Student’s t-test) (FMD, forest musk deer).

