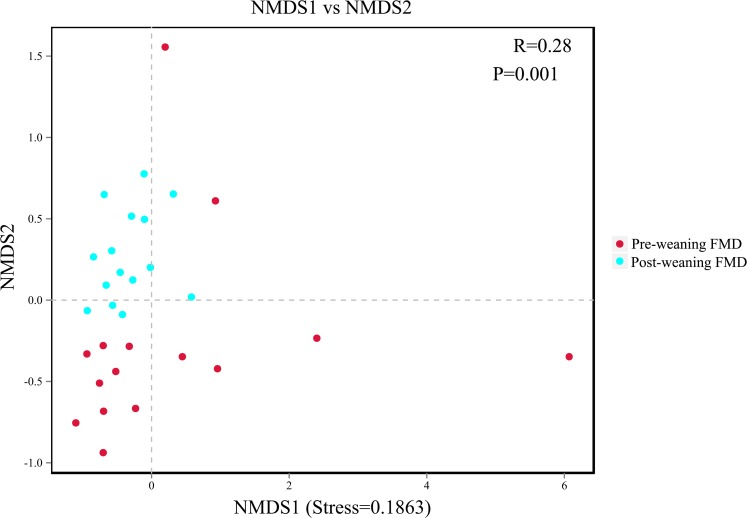
Figure 3. NMDS analysis.
Each point represents one sample, and different colors represent different groups. The distance between points represents the level of differences; stress lower than 0.2 indicates that the NMDS analysis is reliable. The greater distance between two points infers a higher dissimilarity between them (FMD, forest musk deer).

