Abstract
Viral infections constantly jeopardize the global public health due to lack of effective antiviral therapeutics. Therefore, there is an imperative need to speed up the drug discovery process to identify novel and efficient drug candidates. In this study, we have developed quantitative structure–activity relationship (QSAR)‐based models for predicting antiviral compounds (AVCs) against deadly viruses like human immunodeficiency virus (HIV), hepatitis C virus (HCV), hepatitis B virus (HBV), human herpesvirus (HHV) and 26 others using publicly available experimental data from the ChEMBL bioactivity database. Support vector machine (SVM) models achieved a maximum Pearson correlation coefficient of 0.72, 0.74, 0.66, 0.68, and 0.71 in regression mode and a maximum Matthew's correlation coefficient 0.91, 0.93, 0.70, 0.89, and 0.71, respectively, in classification mode during 10‐fold cross‐validation. Furthermore, similar performance was observed on the independent validation sets. We have integrated these models in the AVCpred web server, freely available at http://crdd.osdd.net/servers/avcpred. In addition, the datasets are provided in a searchable format. We hope this web server will assist researchers in the identification of potential antiviral agents. It would also save time and cost by prioritizing new drugs against viruses before their synthesis and experimental testing.
Keywords: algorithm, antiviral compounds, drug design, inhibition, prediction, QSAR
AVCpred is a QSAR approach to predict the antiviral potential of chemical compounds using relationships connecting molecular descriptors and inhibition. Experimentally validated antiviral compounds against important human viruses from ChEMBL database were used to develop the prediction models. The web server with user friendly prediction/design options also has other tools for analysis.
1.
Antiviral compounds (AVCs) inhibit the development of viruses in the host cell and are relatively harmless to the host.1 They can be natural, for example, antivirals found in turmeric2 and eucalyptus oil,3 or synthetic, for example, zidovudine (a nucleoside analog)4 and Tamiflu (neuraminidase inhibitor).5 Many compounds and drugs have also been tested and found to be useful in restricting the growth of certain viruses.6, 7 Scientists are endeavoring to broaden the range of antivirals to other families of viruses.8
However, designing safe and effective antiviral drugs is a difficult task due to the high genetic diversity and consequent drug resistance in viruses.9 Initially, antivirals were discovered using traditional trial‐and‐error methods.10 However, it was a very lengthy process for discovering effective antivirals.10, 11 Later, research on virology helped to identify many target pathways to block viral multiplication.12, 13 Scientists are now using rational drug design strategies for developing antivirals that target the viruses at different stages of their life cycles.14 During the past decade, many new drugs have been successfully identified in controlling the viral replication in host cells, for example, maraviroc (inhibits human immunodeficiency virus or HIV entry), pleconaril (inhibits picornavirus uncoating), acyclovir (inhibits herpesvirus replication), and oseltamivir (inhibits influenza release).9, 15
To save time and money for discovering a new drug, researchers have widely used various computational methods to screen virtual libraries of compounds before the synthesis and animal testing of chemicals. Among the different approaches, quantitative structure–activity relationship (QSAR) is mostly used.16, 17, 18 In this approach, relationships connecting molecular descriptors and activity are used to predict the property of other molecules.19 Molecular descriptors transform the chemical information (structure and linking of groups) of a molecule into simple numbers.20 QSAR‐based virtual screening is an effective computational technique leading toward identification and design of novel antiviral agents.21
Lately, many dedicated bioinformatic resources have been developed for antivirals. For example, in the area of RNA interference resources published are VIRsiRNAdb—antiviral siRNAs resource for about 42 disease causing viruses,22 HIVsirDB—anti HIV siRNAs database,23 VIRsiRNApred—antiviral siRNA inhibition efficacy predictor,24 and VIRmiRNA—database of virus encoded miRNAs including antiviral miRNAs.25 Similarly, for peptide‐based antivirals, a few web servers have also been created like AVPdb—collection of antiviral peptides targeting more than 60 medically important viruses,26 HIPdb—HIV inhibiting peptide repository,27 and AVPpred—predictor of antiviral activity of peptides.28. Many general depositories provide information of antiviral molecules. For example, ChEMBL,29 PubChem—a database of molecules and their activities,30 ZINC—database of commercial compounds for virtual screening,31 and DrugBank—a knowledgebase for drugs and drug targets.32 In addition, there are a few QSAR studies targeting specific viral proteins.33, 34, 35, 36, 37, 38, 39, 40, 41 However, till date there is no web server/software, which can regressively predict the percentage inhibition value of a compound against different human viruses under a single platform.
To cater this need, we developed AVCpred, a web server for prediction and design of antiviral compounds. In this method, we used previously known AVCs against HIV, hepatitis C virus (HCV), hepatitis B virus (HBV), human herpesvirus (HHV) and 26 other viruses with experimentally validated percentage inhibition from ChEMBL, a large‐scale bioactivity database for drug discovery.29 This was followed by descriptor calculation and selection of best performing molecular descriptors. The latter were then used as input for support vector machine (in regression mode) to develop QSAR models for different viruses as well as a general model for other viruses. We have integrated these models in the AVCpred web server, which will be helpful for virtual screening of AVCs and designing new compounds to target the viruses.
2. Methods and Materials
2.1. Datasets
In this study, we have used different datasets of AVCs having experimentally verified percent inhibition values against HIV, HCV, HHV, HBV and a general dataset having AVCs against 26 human viruses. The data were obtained from the ChEMBL resource ( https://www.ebi.ac.uk/chembl/). The desired data were fetched using target browser (taxonomy tree) as well as target search using keywords such as HIV, HCV, HBV, HHV, virus, viral, viruses. Initially, among the AVCs, the majority of data belonged to HIV (1383 compounds), HCV (803 compounds), HHV (473 compounds), HBV (416 compounds), and other viruses (1635 compounds). After filtering entries with desired information and removing redundant entries, we were left with 389 compounds for HIV, 467 in case of HCV, 124 for HHV, 112 against HBV, and 1391 AVCs targeting the 26 viruses (Table 1 and Table S1). These datasets were used for descriptor selection and model development. The datasets are available along with references on the web server and can be downloaded from this URL: http://crdd.osdd.net/servers/avcpred/datasets.php.
Table 1.
Creation of datasets for the development of prediction models
| S. no. | Virus | Overall data | Data filtera | ||
|---|---|---|---|---|---|
| Percent inhibition1 | Reference2 | Non‐redundant3 | |||
| 1 | Human immunodeficiency virus (HIV) | 1383 | 594 | 535 | 389 |
| 2 | Hepatitis C virus (HCV) | 803 | 648 | 618 | 467 |
| 3 | Hepatitis B virus (HBV) | 416 | 284 | 283 | 112 |
| 4 | Human herpesvirus (HHV) | 473 | 312 | 278 | 124 |
| 5 | General (26 viruses)b | 5684 | 2662 | 1635 | 1391 |
Data from ChEMBL were filtered, and only compounds with [1] percent inhibition, [2] reference, and [3] non‐redundant SMILES were considered.
The general dataset is comprised of below viruses with unique number of AVCs in brackets: Dengue virus 1,1 dengue virus 2,16 enterovirus,30 human adenovirus 5,41 human cox B1,4 human cox B5,21 human echovirus 13,3 human echovirus 9,2 human enterovirus 71,19 human enterovirus C,1 human polio virus 1,4 human rhinovirus,1 human rhinovirus 14,29 human rhinovirus 1B,18 human rhinovirus 2,2 human T lymphotropic virus,42 influenza A,36 influenza A (H1N1),16 influenza B,1 monkeypox virus,1 respiratory syncytial virus,4 Rift Valley fever virus (Cercopithecidae),1 sandfly fever Sicilian virus,2 SARS coronavirus,23 simian virus 40,45 Sindbis virus,4 vaccinia virus,12 vaccinia virus WR,22 variola virus,1 vesicular stomatitis virus,63 West Nile virus,17 yellow fever virus.51
This article is being made freely available through PubMed Central as part of the COVID-19 public health emergency response. It can be used for unrestricted research re-use and analysis in any form or by any means with acknowledgement of the original source, for the duration of the public health emergency.
2.2. Descriptor calculation
To develop virus specific as well as general QSAR models, we computed about 18000 chemical descriptors (1D, 2D, and 3D), including geometric, constitutional, electrostatic, topological, hydrophobic, binary fingerprints, using PaDEL, an open‐source software to calculate molecular descriptors and fingerprints.42
2.3. Feature selection
To improve the speed of calculation, we selected the most essential descriptors using ‘RemoveUseless’ filter followed by ClassifierSubsetEval (attribute evaluator) with BestFirst (search method) module available in Weka package.43 ClassifierSubsetEval evaluates attribute subsets on training/testing data using a classifier to estimate the merit of a set of attributes.44, 45 The selected descriptors were then used to develop the QSAR models (Table S3).
2.4. Machine learning
We developed individual QSAR models for each of the 4 viruses (HIV, HCV, HHV, and HBV) as well as a general model comprising 26 different viruses using SMOreg algorithm46 in Weka machine learning software43 freely available at http://www.cs.waikato.ac.nz/ml/weka. SMOreg implements the support vector machine in regression mode. In SMOreg, Pearson VII function‐based universal kernel (Puk) and RegSMOImproved optimizer were used along with parameters such as (i) the regularization constant/complexity value (c) that allows trade‐off between training error and margin, (ii) the omega exponent value (ω) that controls peak half‐width, and (iii) the sigma bandwidth value (σ) that controls peak tailing factor.47, 48 Simultaneously, software SVMlight (freely available at http://svmlight.joachims.org) was employed for machine learning in classification mode. In SVMlight, radial basis function (RBF) kernel was used with parameters (i) gamma (g) that defines how far the influence of a single training example reaches and (ii) complexity constant (c) that allows trade‐off amid training error and margin.49 Selected molecular descriptors and fingerprints were used as input features for the development of QSAR models.
2.5. Evaluation
In order to evaluate performance of our models, we employed a number of statistical parameters including Pearson's correlation coefficient, coefficient of determination, mean absolute error root‐mean‐square error, sensitivity, specificity, accuracy, and Mathew's correlation coefficient as briefly described below.
The Pearson's correlation coefficient (R) is a measure of correlation between two variables.
| (1) |
where n is the size of test set, and E i pred and E i act is the predicted and actual efficacy of AVCs respectively.
A value of 1 denotes total positive correlation, 0 is no correlation, and −1 is total negative correlation.
The coefficient of determination (R 2) indicates how well data fit a statistical model. An R 2 of 1 indicates that the model perfectly fits the data, while an R 2 of 0 means that the model does not fit the data at all.
The mean absolute error (MAE) measure indicates how close the predictions are to the eventual outcomes.
| (2) |
where E i pred is the prediction, E i act the true value, and | E i pred – E i act | the absolute error.
MAEs are negatively oriented scores; that is, lower values are better.
The root‐mean‐square error (RMSE) measures the average magnitude of the error.
| (3) |
RMSEs are also negatively oriented scores; that is, lower values are better.
Sensitivity (Sn) or the true positive rate measures the percentage of correctly identified positives.
| (4) |
An ideal predictor would be expressed as 100% sensitive.
Specificity (Sp) or the true negative rate measures the percentage of correctly identified negatives
| (5) |
An ideal predictor would be expressed as 100% specific.
Accuracy (Ac) is the percentage of correct results (i.e. both true positives and true negatives) among the total number of cases.
| (6) |
An ideal predictor would be expressed as 100% accurate.
The Matthew's correlation coefficient (MCC) is used in machine learning to evaluate the performance of binary classifications.
| (7) |
In the above Eqs. (4), (5), (6), (7), TP, FP, TN, and FN represent the true positives, false positives, true negatives, and false negatives respectively.
Its value ranges from −1 to 1 and a value close to 1 means a better prediction.
3. Results
3.1. Performance of QSAR models
In order to identify the most effective features or descriptors of antiviral drugs, we computed the correlation between selected chemical features of antiviral drugs and their percent inhibition using comprehensive pharmacological screening datasets from ChEMBL29 (Figure 1).
Figure 1.
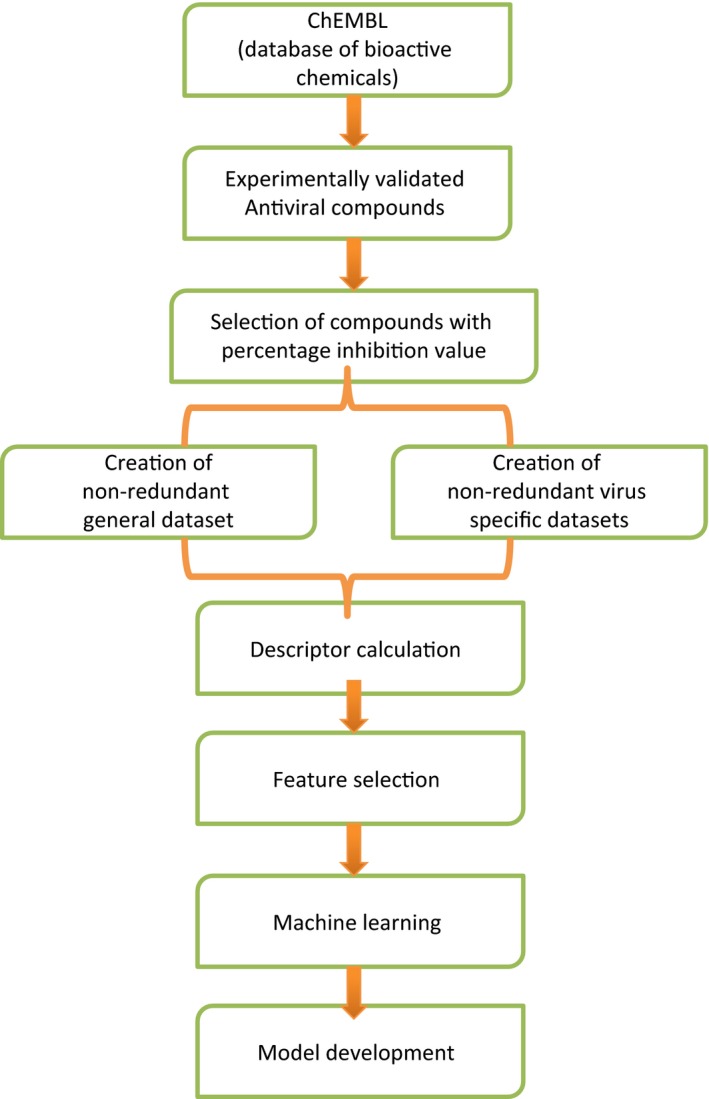
Schematic diagram demonstrating workflow of AVCpred
After attribute selection, the relevant descriptors were 45 for HIV, 52 for HCV, 15 for HBV, 20 for HHV, and 65 for rest of the viruses. A combination of selected chemical descriptors like partial charge, atom‐type electrotopological state, extended topochemical atom, chi cluster, weighted path, and fingerprints based on substructure, graph, path, and extended features including PubChem and Klekota‐Roth were found to be useful in prediction. The selected descriptors were then used to develop the QSAR models (Table S3). During 10‐fold cross‐validation, we achieved maximum Pearson's correlation coefficient (PCC) of 0.72 in case of HIV; 0.74 in case of HCV; 0.66 in case of HBV; 0.68 in case of HHV; and 0.71 in case of rest of the viruses. Also during validation on independent dataset, we achieved a maximum PCC of 0.63, 0.65, 0.61, 0.64, and 0.67, respectively (Table 2). Other statistical parameters used in the development of QSAR models are depicted in Table S2. A scatter plot between actual and predicted efficacy in each case is shown in Figure 2.
Table 2.
Pearson correlation values obtained for each viral dataset on their respective QSAR models
| S. no. | Virus | Antiviral compounds | No. of selected descriptors | Pearson's correlation coefficient (PCC) | |||
|---|---|---|---|---|---|---|---|
| Total | Training | Validation | Training | Validation | |||
| (10x)a | |||||||
| 1 | Human immunodeficiency virus (HIV) | 389 | 351 | 38 | 45 | 0.72 | 0.63 |
| 2 | Hepatitis C virus (HCV) | 467 | 421 | 46 | 52 | 0.74 | 0.65 |
| 3 | Hepatitis B virus (HBV) | 112 | 101 | 11 | 15 | 0.66 | 0.61 |
| 4 | Human herpesvirus (HHV) | 124 | 112 | 12 | 20 | 0.68 | 0.64 |
| 5 | General (26 viruses)b | 1391 | 1252 | 139 | 65 | 0.71 | 0.67 |
10‐fold cross‐validation.
The general dataset is comprised of below viruses with unique number of AVCs in brackets: Dengue virus 1,1 dengue virus 2,16 enterovirus,30 human adenovirus 5,41 human cox B1,4 human cox B5,21 human echovirus 13,3 human echovirus 9,2 human enterovirus 71,19 human enterovirus C,1 human polio virus 1,4 human rhinovirus,1 human rhinovirus 14,29 human rhinovirus 1B,18 human rhinovirus 2,2 human T lymphotropic virus,42 influenza A,36 influenza A (H1N1),16 influenza B,1 monkeypox virus,1 respiratory syncytial virus,4 Rift Valley fever virus (Cercopithecidae),1 sandfly fever Sicilian virus,2 SARS coronavirus,23 simian virus 40,45 Sindbis virus,4 vaccinia virus,12 vaccinia virus WR,22 variola virus,1 vesicular stomatitis virus,63 West Nile virus,17 yellow fever virus.51
This article is being made freely available through PubMed Central as part of the COVID-19 public health emergency response. It can be used for unrestricted research re-use and analysis in any form or by any means with acknowledgement of the original source, for the duration of the public health emergency.
Figure 2.
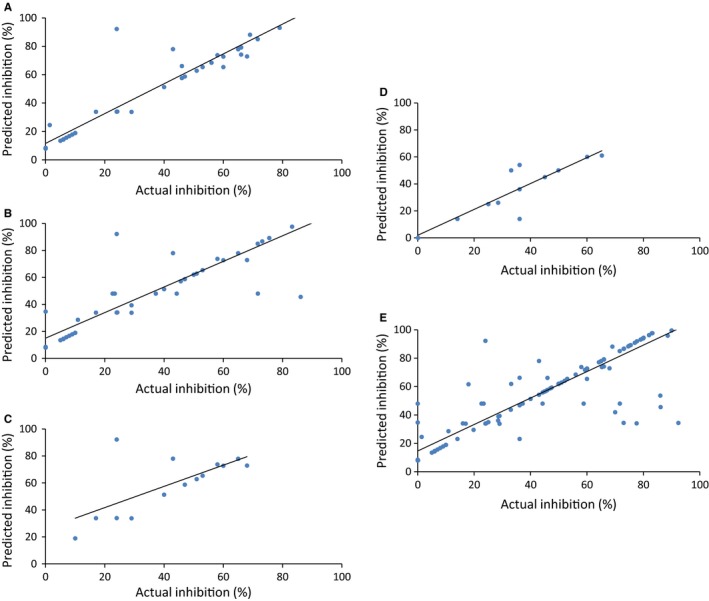
Scatter plot between actual and predicted percentage inhibition on independent validation datasets of (A) HIV, (B) HCV, (C) HBV, (D) HHV, and (E) general (26 viruses)
In addition, we also checked the performance of our models developed using classification mode of machine learning. During 10‐fold cross‐validation, we achieved maximum Matthew's correlation coefficient (MCC) of 0.91 in case of HIV; 0.93 in case of HCV; 0.70 in case of HBV; 0.89 in case of HHV; and 0.71 in case of rest of the viruses. Similar performance was shown on the independent datasets (Table 3). The machine learning parameters used for model development are shown in Table 4. Receiver operating characteristic (ROC) plots illustrating the performance of the QSAR models are shown in Figure 3.
Table 3.
Performance of QSAR models obtained for each viral dataset using classification mode of machine learning
| S. no. | Virus | Training/Testing (10‐fold) | Validation | ||||||
|---|---|---|---|---|---|---|---|---|---|
| Sensitivity | Specificity | Accuracy | MCC | Sensitivity | Specificity | Accuracy | MCC | ||
| 1 | HIV | 94.30 | 96.40 | 95.10 | 0.91 | 88.10 | 82.30 | 86.10 | 0.70 |
| 2 | HCV | 96.90 | 96.40 | 96.60 | 0.93 | 86.61 | 87.20 | 86.80 | 0.73 |
| 3 | HBV | 87.10 | 81.60 | 85.80 | 0.70 | 87.20 | 80.40 | 84.30 | 0.69 |
| 4 | HHV | 93.40 | 92.30 | 93.50 | 0.89 | 87.10 | 91.30 | 88. 6 | 0.77 |
| 5 | General (26 viruses) | 88.30 | 82.20 | 85.70 | 0.71 | 81.70 | 82.10 | 81.90 | 0.64 |
This article is being made freely available through PubMed Central as part of the COVID-19 public health emergency response. It can be used for unrestricted research re-use and analysis in any form or by any means with acknowledgement of the original source, for the duration of the public health emergency.
Table 4.
Machine learning parameters selected for the development of the QSAR models
| S. no. | Model | Parameters | |||||||
|---|---|---|---|---|---|---|---|---|---|
| SMOreg | SVMlight | ||||||||
| Kernel | Optimizer | c | ω | σ | Kernel | g | c | ||
| 1 | HIV | Puk | RegSMOImproved | 4 | 2 | 3 | RBF | 0.02 | 200 |
| 2 | HCV | Puk | RegSMOImproved | 5 | 5 | 5 | RBF | 0.02 | 50 |
| 3 | HBV | Puk | RegSMOImproved | 0.1 | 0.3 | 0.3 | RBF | 0.001 | 300 |
| 4 | HHV | Puk | RegSMOImproved | 3 | 3 | 3 | RBF | 0.1 | 100 |
| 5 | General (26 viruses) | Puk | RegSMOImproved | 3 | 3 | 5 | RBF | 0.01 | 50 |
Abbreviations: Puk: Pearson VII function‐based universal kernel. RegSMOImproved: optimizer for algorithm speed improvement. c: regularization constant/complexity parameter allows trade‐off between training error and margin. ω: omega exponent value (controls half‐width of the peak) σ: sigma bandwidth value (controls tailing factor of the peak). RBF: radial basis function g: parameter gamma in RBF kernel.
This article is being made freely available through PubMed Central as part of the COVID-19 public health emergency response. It can be used for unrestricted research re-use and analysis in any form or by any means with acknowledgement of the original source, for the duration of the public health emergency.
Figure 3.
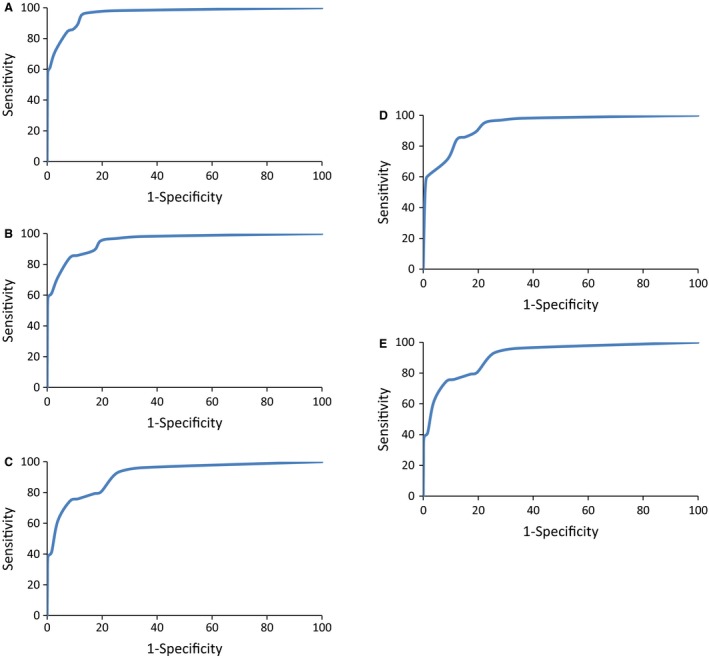
ROC curves depicting performance of QSAR models for (A) HIV, (B) HCV, (C) HBV, (D) HHV, and (E) general (26 viruses)
3.2. Web server
The QSAR models have been integrated into a freely available and easy to use web server, ‘AVCpred’, where users can predict the antiviral potential of their query molecules against the different viruses in terms of percent inhibition value. AVCpred web server includes the following modules:
3.2.1. Submission
This allows users to submit on or more molecules at a time. Users have to choose the viruses on which they want to test their query chemical compounds. On submission, it returns with percent inhibition values against the selected viruses. Also users can view the different properties of the query molecule such as structure, charge, molecular weight, logP value, hydrogen and Lipinski bond donors/acceptors, rigid and rotatable bonds to identify drug‐like molecular structures (Figure 4).
Figure 4.
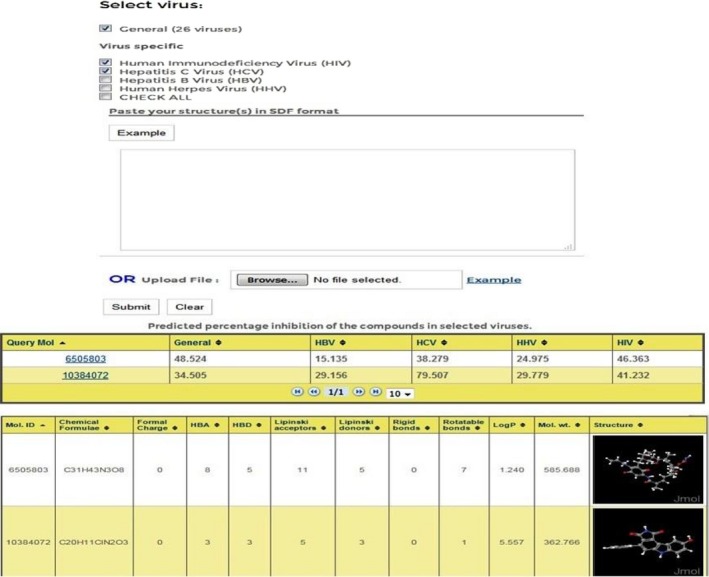
AVCpred submission form with output
3.2.2. Design analogs
It has been found that analogs of known chemical compounds are sometimes more effective than the parent molecule.50 In order to identify potent analogs of an existing AVC, we have included the ‘Design analogs’ tool, where user can design analogs based on given building blocks and predict their inhibition on the viruses.
3.2.3. Draw structure
Using the ‘Draw tool’, one can sketch the structure of the query molecule using Marvin editor (Figure 5). This tool also gives the predicted percent inhibition values against the different viruses. In addition, one can view the various properties of the query structure.
Figure 5.
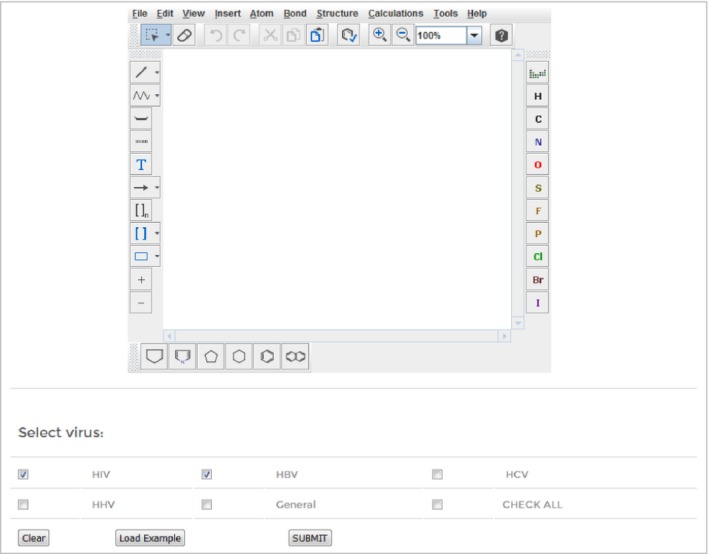
Web interface of ‘ AVC pred Draw’ tool
3.2.4. Search
AVCpred also provides the users a search tool to browse the compounds used in our datasets. In this module, different compounds targeting the viruses are stored in a database. The records can be readily searched, filtered/sorted, and downloaded via the web interface.
3.3. Implementation
AVCpred has been developed using the open‐source LAMP (Linux‐Apache‐MySQL‐PHP) system. The prediction software runs on Red Hat Enterprise Linux 5 environment using Apache http://httpd server.
4. Discussion
To inhibit viral growth, the antiviral molecules or drugs target different phases of viral life cycle such as fusion, integration, replication, maturation and should be relatively non‐toxic to the host organism.51, 52 Each stage can be targeted using AVCs that can, for example, inhibit entry receptors (CD4, CCR5) or viral enzymes (protease, neuraminidase).53, 54, 55 Various AVCs are currently in medical use, and new ones are in clinical trials.56, 57
Finding new and improved viral inhibitors is a major concern in the treatment of deadly human viruses.58, 59 However, discovery of novel AVCs is a tedious process.60 To speed up the identification of new AVCs, a computational approach using QSAR method is a rational strategy to decrease cost and time efforts in the wet laboratory.20 QSAR techniques have been widely used in drug designing and further identification of lead molecules.17
Although there are many QSAR studies pertaining to different types of viral protein inhibitors, they are very specific in their approach and deal with a particular class of inhibitors such as endonuclease inhibitors33 in which 40 compounds were used and reached a correlation of 0.76, thiourea derivatives34 where 85 compounds had a correlation of 0.92, protease inhibitors39 in which 170 compounds had a correlation of 0.60–0.83, and flavonoid inhibitors38 where 20 compounds had a correlation of 0.75–0.97 etc. (Table 5). In most of the cases, the studies are carried out on a limited number of inhibitors. Due to this reason, they predict the inhibitors that are similar to the compound type with a high correlation, but do not work on other dissimilar inhibitors for the same target virus. To address these limitations, AVCpred models have been developed using diverse and large number of inhibitors. In the current algorithm, we have employed antiviral compound datasets from different studies due to which the overall correlation is less than above studies, yet the models are comparatively more robust to predict different classes of inhibitors. However, as new high‐throughput screening data tested under homogeneous conditions on antiviral drugs becomes available, performance of the QSAR method can be improved.
Table 5.
Existing QSAR studies pertaining to antiviral compounds
| S. no. | Compound type | No. of compounds | Correlation | Target virus | Web server/Software | Year | References |
|---|---|---|---|---|---|---|---|
| 1 | PA endonuclease inhibitors | 40 | 0.76 | INFV | No | 2014 | 33 |
| 2 | Thiourea derivatives | 85 | 0.92 | HCV | No | 2013 | 34 |
| 3 | Integrase inhibitors | 77 | 0.98 | HIV | No | 2012 | 35 |
| 4 | Three different series of HBV inhibitors | 30 | 0.92 | HBV | No | 2010 | 36 |
| 5 | HIV‐1 entry inhibitors | 36 | 0.72 | HIV | No | 2010 | 37 |
| 6 | Neuraminidase flavonoid inhibitors | 20 | 0.75–0.97 | H1N1 | No | 2010 | 38 |
| 7 | Protease inhibitors | 170 | 0.6–0.83 | HIV | No | 2010 | 39 |
| 8 | HPV6‐E1 helicase ATPase inhibitors | Full text not available | 0.92 | HPV | No | 2010 | 40 |
| 9 | Thymidine kinase N2‐phenylguanine inhibitors | 20 | 0.85–0.98 | HSV | No | 2000 | 41 |
This article is being made freely available through PubMed Central as part of the COVID-19 public health emergency response. It can be used for unrestricted research re-use and analysis in any form or by any means with acknowledgement of the original source, for the duration of the public health emergency.
In this study, we developed virus specific as well as general prediction models to identify the likelihood of a compound being antiviral using selected chemical attributes of experimentally validated AVCs. PaDEL, an open‐source software, was used to calculate molecular descriptors and fingerprints. However, the software calculates a large number of descriptors, and hence, we used attribute selection approach to reduce their number by eliminating unrelated and extraneous descriptors to get a highly correlated descriptor set. Our analysis revealed that several chemical descriptors are important in predicting the compound inhibition activity, for example, partial charge, atom‐type electrotopological state, extended topochemical atom, chi cluster, weighted path, and fingerprints.
We employed machine learning to train the QSAR models on different sets of experimentally validated data. These models were validated on independent datasets, not used during training, and were found to have satisfactory performance. We used the pharmacological data from the ChEMBL resource for training/testing the models developed for general as well as specific viruses. These models were integrated in an open‐source web server for evaluation and screening of antiviral compounds.
The applicability domain of the QSAR models was demonstrated using Williams plot (Figure 6) in which standardized residuals are plotted against leverages.61 If the standardized residual of a compound is greater than three times standard deviation units (±3σ), the compound is treated as an outlier. The warning value of leverage (h*) is considered as 3p/n, where p is the number of model descriptors plus one and n is the number of training compounds.62, 63 If the leverage of a compound exceeds h*, it is regarded as dissident. The plots demonstrate that the leverages of majority of the compounds do not surpass the critical value (h*) in the regression models, and hence, the compounds are within the chemical domain, implying that the predictivity of the models is reliable.
Figure 6.
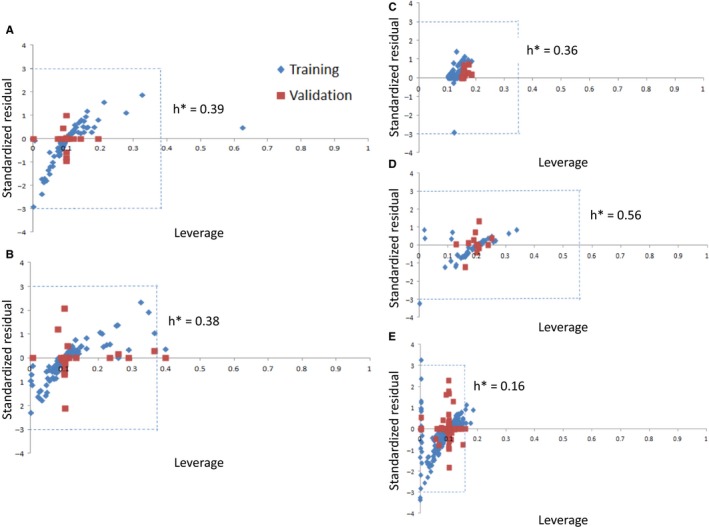
Applicability domain plots of the QSAR models for (A) HIV, (B) HCV, (C) HBV, (D) HHV, and (E) general (26 viruses)
The web server also provides useful services like designing analogs based on given building blocks and drawing structure to sketch novel compounds and predict their inhibition potential against multiple viruses. The AVCpred algorithm is hoped to assist the researchers in discovering novel antiviral compounds as well as virtually check the effect of modifications on existing drugs.
5. Conclusions
AVCpred is the first web‐based algorithm for prediction of AVCs based on experimentally validated datasets. Five prediction models pertaining to HIV, HCV, HHV, HBV, and a general one were implemented in the web server to make comprehensive predictions. In addition, tools for drug design, virtual screening, and collection of existing AVCs have also been integrated. This web server would be helpful for researchers working for the development of antiviral therapeutics.
Competing interests
The authors declare that they have no competing interests.
Supporting information
Acknowledgments
Authors are thankful to Council of Scientific and Industrial Research (CSIR) (GENESIS‐BSC0121), Department of Biotechnology (GAP001), and CSIR‐Institute of Microbial Technology for providing infrastructure and financial support.
References
- 1. Prusoff W. H., Lin T. S., August E. M., Wood T. G., Marongiu M. E., Yale J. Biol. Med. 1989, 62, 215. [PMC free article] [PubMed] [Google Scholar]
- 2. Moghadamtousi S. Z., Kadir H. A., Hassandarvish P., Tajik H., Abubakar S., Zandi K., Biomed. Res. Int. 2014, 2014, 186864. [DOI] [PMC free article] [PubMed] [Google Scholar]
- 3. Schnitzler P., Schon K., Reichling J., Pharmazie 2001, 56, 343. [PubMed] [Google Scholar]
- 4. Wright K., Nature 1986, 323,. 283. [DOI] [PubMed] [Google Scholar]
- 5. Jefferson T., Jones M., Doshi P., Spencer E. A., Onakpoya I., Heneghan C. J., BMJ 2014, 348, g2545. [DOI] [PMC free article] [PubMed] [Google Scholar]
- 6. Liu S., Wolfe M. S., Borchardt R. T., Antiviral Res. 1992, 19, 247. [DOI] [PubMed] [Google Scholar]
- 7. Arakawa T., Yamasaki H., Ikeda K., Ejima D., Naito T., Koyama A. H., Curr. Med. Chem. 2009, 16, 2485. [DOI] [PubMed] [Google Scholar]
- 8. McKinlay M. A., Rossmann M. G., Annu. Rev. Pharmacol. Toxicol. 1989, 29, 111. [DOI] [PubMed] [Google Scholar]
- 9. Razonable R. R., Mayo Clin. Proc. 2011, 86, 1009. [DOI] [PMC free article] [PubMed] [Google Scholar]
- 10. Bauer D. J., Br. Med. Bull. 1985, 41, 309. [DOI] [PubMed] [Google Scholar]
- 11. Hirschman S. Z., Am. J. Med. 1971, 51, 699.4331613 [Google Scholar]
- 12. Capobianchi M. R., Giombini E., Rozera G., Clin. Microbiol. Infect. 2013, 19, 15. [DOI] [PubMed] [Google Scholar]
- 13. Ru J., Li P., Wang J., Zhou W., Li B., Huang C., Li P., Guo Z., Tao W., Yang Y., Xu X., Li Y., Wang Y., Yang L., J. Cheminform. 2014, 6, 13. [DOI] [PMC free article] [PubMed] [Google Scholar]
- 14. Muller B., Krausslich H. G., Handb. Exp. Pharmacol. 2009, 189, 1. [DOI] [PMC free article] [PubMed] [Google Scholar]
- 15. De Clercq E., Nat. Rev. Drug Discov. 2002, 1, 13–25. [DOI] [PubMed] [Google Scholar]
- 16. Pissurlenkar R. R., Khedkar V. M., Iyer R. P., Coutinho E. C., J. Comput. Chem. 2011, 32, 2204. [DOI] [PubMed] [Google Scholar]
- 17. Demchuk E., Ruiz P., Chou S., Fowler B. A., Toxicol. Appl. Pharmacol. 2011, 254, 192. [DOI] [PubMed] [Google Scholar]
- 18. Ruusmann V., Sild S., Maran U., J. Cheminform. 2014, 6, 25. [DOI] [PMC free article] [PubMed] [Google Scholar]
- 19. Gonzalez‐Diaz H., Romaris F., Duardo‐Sanchez A., Perez‐Montoto L. G., Prado‐Prado F., Patlewicz G., Ubeira F. M., Curr. Pharm. Des. 2010, 16, 2737. [DOI] [PubMed] [Google Scholar]
- 20. Cruz‐Monteagudo M., Cordeiro M. N., Tejera E., Dominguez E. R., F. Borges , Mini Rev. Med. Chem. 2012, 12, 920. [DOI] [PubMed] [Google Scholar]
- 21. Prado‐Prado F. J., Borges F., Uriarte E., Perez‐Montoto L. G., Gonzalez‐Diaz H., Anal. Chim. Acta 2009, 651, 159. [DOI] [PubMed] [Google Scholar]
- 22. Thakur N., Qureshi A., Kumar M., Nucleic Acids Res. 2012, 40, D230. [DOI] [PMC free article] [PubMed] [Google Scholar]
- 23. Tyagi A., Ahmed F., Thakur N., Sharma A., Raghava G. P., Kumar M., PLoS ONE 2011, 6, e25917. [DOI] [PMC free article] [PubMed] [Google Scholar]
- 24. Qureshi A., Thakur N., Kumar M., J. Transl. Med. 2013, 11, 305. [DOI] [PMC free article] [PubMed] [Google Scholar]
- 25. Qureshi A., Thakur N., Monga I., Thakur A., Kumar M., Database (Oxford) 2014, 2014, 1. [DOI] [PMC free article] [PubMed] [Google Scholar]
- 26. Qureshi A., Thakur N., Tandon H., Kumar M., Nucleic Acids Res. 2014, 42, D1147. [DOI] [PMC free article] [PubMed] [Google Scholar]
- 27. Qureshi A., Thakur N., Kumar M., PLoS ONE 2013, 8, e54908. [DOI] [PMC free article] [PubMed] [Google Scholar]
- 28. Thakur N., Qureshi A., Kumar M., Nucleic Acids Res. 2012, 40, W199. [DOI] [PMC free article] [PubMed] [Google Scholar]
- 29. Bento A. P., Gaulton A., Hersey A., Bellis L. J., Chambers J., Davies M., Krüger F. A., Light Y., Mak L., McGlinchey S., Nowotka M., Papadatos G., Santos R., Overington J. P., Nucleic Acids Res. 2014, 42, D1083. [DOI] [PMC free article] [PubMed] [Google Scholar]
- 30. Wang Y., Suzek T., Zhang J., Wang J., He S., Cheng T., Shoemaker B. A., Gindulyte A., Bryant S. H., Nucleic Acids Res. 2014, 42, D1075. [DOI] [PMC free article] [PubMed] [Google Scholar]
- 31. Irwin J. J., Shoichet B. K., J. Chem. Inf. Model. 2005, 45, 177. [DOI] [PMC free article] [PubMed] [Google Scholar]
- 32. Wishart D. S., Knox C., Guo A. C., Cheng D., Shrivastava S., Tzur D., Gautam B., Hassanali M., Nucleic Acids Res. 2008, 36, D901. [DOI] [PMC free article] [PubMed] [Google Scholar]
- 33. Yan Z., Zhang L., Fu H., Wang Z., Lin J., Bioorg. Med. Chem. Lett. 2014, 24, 539. [DOI] [PubMed] [Google Scholar]
- 34. Sharma A., Gupta S. P., Siddiqui A. A., Indian J. Biochem. Biophys. 2013, 50, 278. [PubMed] [Google Scholar]
- 35. Sun X. H., Guan J. Q., Tan J. J., Liu C., Wang C. X., SAR QSAR Environ. Res. 2012, 23, 683. [DOI] [PubMed] [Google Scholar]
- 36. Arora P. K., Patil V. M., Gupta S. P., Bioinformation 2010, 4, 417. [DOI] [PMC free article] [PubMed] [Google Scholar]
- 37. Pirhadi S., Ghasemi J. B., Eur. J. Med. Chem. 2010, 45, 4897. [DOI] [PubMed] [Google Scholar]
- 38. Mercader A. G., Pomilio A. B., Eur. J. Med. Chem. 2010, 45, 1724. [DOI] [PubMed] [Google Scholar]
- 39. Basak S. C., Mills D., Garg R., Bhhatarai B., Curr. Comput. Aided Drug Des. 2010, 6, 269. [DOI] [PubMed] [Google Scholar]
- 40. Pillai G. G., Sikk L., Tamm T., Karelson M., Burk P., Tamm K., Curr. Comput. Aided Drug Des. 2014, 10, 303. [DOI] [PubMed] [Google Scholar]
- 41. Gaudio A. C., Richards W. G., Takahata Y., J. Mol. Graph. Model. 2000, 18, 33. [DOI] [PubMed] [Google Scholar]
- 42. Yap C. W., J. Comput. Chem. 2011, 32, 1466. [DOI] [PubMed] [Google Scholar]
- 43. Frank E., Hall M., Trigg L., Holmes G., Witten I. H., Bioinformatics 2004, 20, 2479. [DOI] [PubMed] [Google Scholar]
- 44. Kumar R., Chaudhary K., Singla D., Gautam A., Raghava G. P., Sci. Rep. 2014, 4, 4668. [DOI] [PMC free article] [PubMed] [Google Scholar]
- 45. Chauhan J. S., Dhanda S. K., Singla D., Agarwal S. M., Raghava G. P., PLoS ONE 2014, 9, e101079. [DOI] [PMC free article] [PubMed] [Google Scholar]
- 46. Li C., Jiang L., in Using Locally Weighted Learning to Improve SMOreg for Regression, (Eds: Yang Q., Webb G.), Springer, Berlin: 2006, 375–384. [Google Scholar]
- 47. Üstün B., Melssen W. J., Buydens L. M. C., Chemometr. Intell. Lab. Syst. 2006, 81, 29. [Google Scholar]
- 48. Shevade S. K., Keerthi S. S., Bhattacharyya C., Murthy K. K., IEEE Trans. Neural Netw. 2000, 11, 1188. [DOI] [PubMed] [Google Scholar]
- 49. Joachims T., Learning to Classify Text Using Support Vector Machines: Methods, Theory and Algorithms, Kluwer Academic Publishers, Norwell, MA: 2002. [Google Scholar]
- 50. Kumar A., Khan I. A., Koul S., Koul J. L., Taneja S. C., Ali I., Ali F., Sharma S., Mirza Z. M., Kumar M., Sangwan P. L., Gupta P., Thota N., Qazi G. N., J. Antimicrob. Chemother. 2008, 61, 1270. [DOI] [PubMed] [Google Scholar]
- 51. Littler E., Oberg B., Antivir. Chem. Chemother. 2005, 16, 155. [DOI] [PubMed] [Google Scholar]
- 52. Reusser P., Schweiz. Med. Wochenschr. 2000, 130, 101. [PubMed] [Google Scholar]
- 53. De Clercq E., Int. J. Antimicrob. Agents 2009, 33, 307. [DOI] [PubMed] [Google Scholar]
- 54. Arts E. J., Hazuda D. J., Cold Spring Harb. Perspect Med. 2012, 2, a007161. [DOI] [PMC free article] [PubMed] [Google Scholar]
- 55. Barik S., BMC Med. 2012, 10, 104. [DOI] [PMC free article] [PubMed] [Google Scholar]
- 56. De Clercq E., J. Clin. Virol. 2004, 30, 115.15125867 [Google Scholar]
- 57. De Clercq E., Expert Opin. Emerg. Drugs 2008, 13, 393. [DOI] [PubMed] [Google Scholar]
- 58. Martinez J. P., Sasse F., Bronstrup M., Diez J., Meyerhans A., Nat. Prod. Rep. 2015, 32, 29. [DOI] [PubMed] [Google Scholar]
- 59. Niu B., Lu L., Liu L., Gu T. H., Feng K. Y., Lu W. C., Cai Y. D., J. Comput. Chem. 2009, 30, 33. [DOI] [PubMed] [Google Scholar]
- 60. De Clercq E., Curr. Opin. Virol. 2012, 2, 572. [DOI] [PubMed] [Google Scholar]
- 61. Minovski N., Zuperl S., Drgan V., Novic M., Anal. Chim. Acta 2013, 759, 28. [DOI] [PubMed] [Google Scholar]
- 62. Fatemi M. H., Heidari A., Gharaghani S., J. Theor. Biol. 2015, 369, 13. [DOI] [PubMed] [Google Scholar]
- 63. Zhao Q., Yang K., Li W., Xing B., Sci. Rep. 2014, 4, 3888. [DOI] [PMC free article] [PubMed] [Google Scholar]
Associated Data
This section collects any data citations, data availability statements, or supplementary materials included in this article.
Supplementary Materials


