

Abstract
Minimal residual disease (MRD) has been increasingly investigated in mantle cell lymphoma (MCL), including for individual therapeutic stratification and pre-emptive treatment in clinical trials. Although patient/allele specific real-time quantitative polymerase chain reaction (qPCR) of IGH or BCL1-IGH clonal markers is the gold-standard method, its reliance on a standard curve for relative quantification limits quantification of low-level positivity within the 1E-4 to 1E-5 range; over half of positive MRD samples after treatment fall below the quantitative range (BQR) of the standard curve. Droplet digital PCR (ddPCR), in contrast, allows absolute quantification, including for samples with no baseline determination of tumor infiltration by multicolor flow cytometry (MFC), avoiding the need for a reference standard curve. Using updated, optimized, ddPCR criteria we compared it with qPCR in 416 MRD samples (and with MFC in 63), with over-representation (61%) of BQR results by qPCR, from a total of 166 patients from four prospective MCL clinical trials. ddPCR, qPCR and MFC gave comparable results in MRD samples with at least 0.01% (1E-4) positivity. ddPCR was preferable to qPCR since it provided more robust quantification at positivity between 1E-4 and 1E-5. Amongst 240 BQR samples with duplicate or triplicate analysis, 39% were positive by ddPCR, 49% negative and only 12% remained positive below quantifiable ddPCR limits. The prognostic relevance of ddPCR is currently under assessment in the context of prospective trials within the European MCL Network.
Introduction
Minimal residual disease (MRD) detection in mantle cell lymphoma (MCL) provides relevant prognostic information, leading to the design of MRD-based therapeutic strategies in prospective clinical trials.1,2 Currently, real time quantitative polymerase chain reaction (qPCR), based on amplification of clonal immunoglobulin heavy chain (IGH) or BCL1/IGH rearrangements, is the gold standard for MRD monitoring in MCL, as the most validated and standardized method.3,4 Multiparameter flow cytometry (MFC) showed promise on retrospective testing of cryopreserved samples in the European MCL Newtork (EU-MCL) trials, providing comparable information to qPCR for MRD level above 0.01% (1E-4).5 However, both methods present limitations. The major limitation of qPCR is its relative quantitative nature, which requires a diagnostic DNA standard curve with a known level of infiltration, preferably in excess of 1-10%. As such, it is unreliable for samples with low or unknown levels of basal infiltration, as defined by MFC, including tissue samples, whether cryopreserved or formalin fixed (FFPE). Moreover, qPCR is unable to provide reliable target quantification for a substantial proportion of follow-up (FU) samples with a very low tumor burden, above the sensitivity of the standard curve but below the quantitative range (BQR). MFC, even if attractive in terms of cost and time of execution, is less sensitive than qPCR, although this depends on the number of events analyzed.5
Droplet digital PCR (ddPCR) has recently been shown to have, at least, comparable sensitivity to qPCR in MRD assessment of mature B cell malignancies, including in a limited number of MCL samples.6,7 ddPCR presents numerous technical advantages compared to qPCR, including: (1) absolute quantification, thus obviating the need for extrapolation from a standard curve and assessment of infiltration of diagnostic material by MFC; (2) its high dynamic range that allows achievement of high levels of precision and sensitivity, depending on the total number of replicates and quantity of DNA analyzed; (3) its high tolerance to inhibitors8–10 and its superior capacity to limit the effect of experimental variation on quantification of rare events.11 qPCR and ddPCR measure the same target DNA clonotype and, as such, are both limited by molecular informativity of sufficiently infiltrated diagnostic samples and detectability of specific rearrangements, which is approximately 90% for IGH and 30% for BCL1-IGH. Both also depend on the performance of patient-specific ASO (allele-specific oligonucleotide) assays that must be developed and validated for each patient. This does, however, limit the risk of PCR contamination and clone-specific molecular approaches have proved to be relatively easy to standardize, at least within the Euro-MRD group (www.euromrd.org).
In the past 5 years, ddPCR workflows and guidelines have been established within several European countries, initially within the context of the MRD Network of the Fondazione Italiana Linfomi (FIL) and more recently within the Euro-MRD consortium. Ten QA (Quality Assessment) rounds (six Italian and four European) have been performed to date, allowing the development of a standard ddPCR protocol and common guidelines for ddPCR-based MRD analysis in mature B lymphoid malignancies.
This study reports the largest comparison so far described between qPCR and ddPCR in MCL samples from four prospective EU-MCL clinical trials, plus prospective MFC in one of these trials. MRD analysis was performed independently by four laboratories (Paris-Necker [NCK)], Créteil [CRE], Torino [TOR] and Kiel [KIEL]), all actively involved in EU-MCL and belonging to the Euro-MRD Lymphoma QA group. We here present an update of initially proposed ddPCR guidelines.6,12 We intentionally focused on samples with low MRD level (BQR: Below Quantitative Range) by qPCR, in order to investigate whether ddPCR could reduce the number of samples that fall into the grey-zone of not reliably quantifiable positivity by qPCR. This is particularly important as MRD evaluation is progressively used in clinical trials, not just for evaluating prognostic risk of a cohort of patients within a given protocol, but also to guide individual patient treatment, including by pre-emptive therapy at molecular relapse.13 We show that ddPCR drastically reduces the incidence of grey-zone BQR positivity.
Results
Inter-laboratory reproducibility
In order to demonstrate the accuracy of ddPCR and its reproducibility between laboratories which use common guidelines, we here report the results from the first QA rounds, performed within the Euro-MRD standardization group, by ddPCR for IGH and/or BCL1-IGH targets on 14 FU samples (23 evaluations in total), involving four to nine laboratories that progressively joined the Euro-MRD lymphoma group (Fig. 1). 128/142 (90%) measurements were concordant between laboratories. All five qPCR negative samples were confirmed to be negative by ddPCR in all laboratories, other than 2 false positive results detected by one laboratory, on both targets of a single sample.
Figure 1.
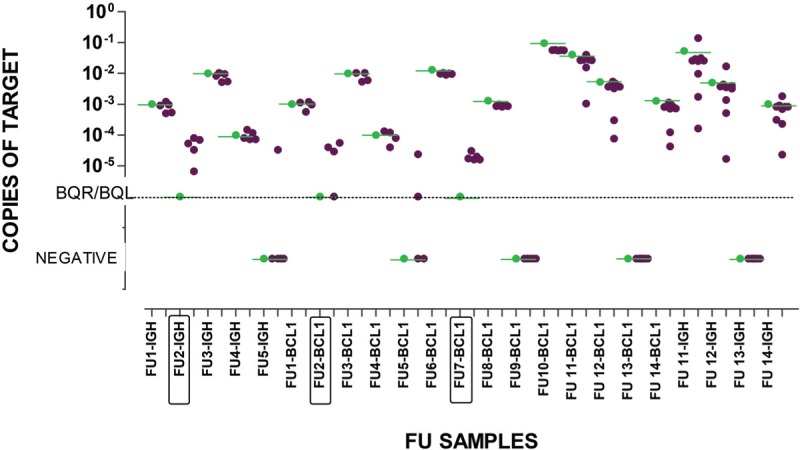
Results from 4 QA rounds performed on 14 FU samples by up to 9 Euro-MRD consortium Lymphoma QA-group laboratories. The qPCR reference result is shown in green. Each dark dot represents the result from an individual laboratory. BQR by qPCR samples are boxed in the X-axis.
Among 114 assessments, from 15 positive samples, 11 were consistently under-estimated, by two laboratories, only by ddPCR and not by qPCR, 9 of them with a >1 log difference from the qPCR reference value. This is likely to reflect a learning process in standardized analysis and interpretation. Using the initial criteria for ddPCR positivity all 3 BQR samples were reproducibly quantified at values between 1E-4 and 1E-5. The introduction of the new updated criteria (Fig. 1, Table 1S) only affected 2 samples (FU2-BCL1 and FU5-BCL1, both BQR by qPCR), which became BQL rather than negative when interpreted with the previous guidelines. BCL1 targets gave a slightly better performance compared to IGH targets in FU11 and FU12 evaluations. Taken together, these results demonstrate excellent reproducibility between laboratories using the same protocols and superior quantifiable sensitivity of ddPCR compared to qPCR.
qPCR vs ddPCR
Overall, 416 FU samples from 166 MCL patients (197 samples from 64 EU-MCL patients, 117 from 51 MCLR2 and 102 from 51 MCL0208 patients) were analyzed (Table 2S). The majority of patients were followed on their clonal IGH-VDJ target, but 5 were followed with BCL1-IGH and 3 with both. Fifty six samples did not meet the defined ddPCR criteria, (insufficient replicates and/or droplets) and were evaluated separately (see below). A disproportionate number of these (25/56, 44.6% compared to 26/360, 7.2% of samples meeting acceptability criteria) came from MCLR2 samples and were extracted on a bead-based automated extractor (Maxwell 16, Promega). Updating the model to Maxwell RSC, dramatically reduced the number of samples with insufficient droplets, although this may also be due to changes in other reagents.
All ddPCR acceptability criteria were met by 360/416 (86.5%) MRD samples (131 BM and 229 PB); these were selected for the initial qPCR vs ddPCR comparison. Based on Euro-MRD qPCR criteria, 47/360 (13%) were qPCR positive, 95 (26%) were negative and 218 (61%) were BQR (Table S2). BQR samples were divided into 3 sub-groups: 3/3-BQR, in which all 3 replicates were positive but not reliably quantifiable, 2/3-BQR in which 2 out of 3 replicates were positive and 1/3-BQR in which only 1 out of 3 replicates was positive, as described.5 Among the BQR samples: 14/87 (16%) of 3/3-BQR, 10/63 (15.9%) of 2/3-BQR and 10/73 (13.7%) of 1/3-BQR had a QR >1E-4. ddPCR was considered positive if at least 3 events were detected. 78/360 (21.6%) samples, from 41 patients, had only one (42 samples) or two (36 samples) events within the triplicates but no events in the negative control (PBMC: peripheral blood mononuclear cells from healthy donors) and were initially considered negative. Amongst the 36 samples with 2 events, all were at least BQR, whereas none of the samples with 1 event were quantifiably positive by qPCR and 12/42 were negative. For the revised quantification criteria we therefore considered samples with 2 ddPCR events as BQL and those with 1 event as negative.
Using these updated criteria and despite the intentional selection of a majority of low-level BQR samples (Fig. 2, Table 3S), ICC analysis, which measures the degree of correlation and agreement between continuous variables measured with both techniques, showed good concordance between qPCR and ddPCR (ICC = 0.79, 95% CI: 0.75-0.83).14
Figure 2.
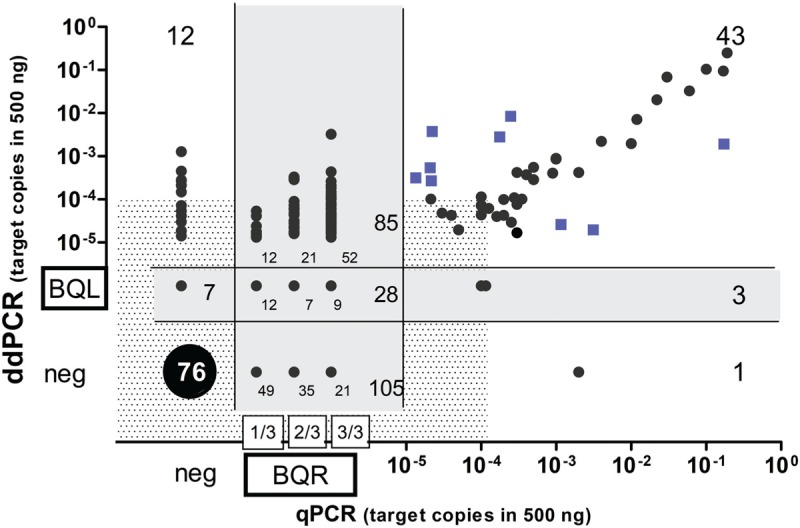
MRD comparison between ddPCR and qPCR in MCL. Blue squares: positive samples with MRD levels >1 log discordant between methods; Shaded zone: cut-off at 1E-4 copies; Grey zone: positive Below Quantitative Limit (BQL) by ddPCR and Below Quantitative Range (BQR) by qPCR, neg: MRD negative.
As expected, exclusion of BQR and BQL values improved agreement between methods, with an even better result, when calculated by Cohen's κ coefficient, (k = 0.8, 90% agreement, 95% CI: 0.7 to 0.9), which estimates the agreement between methods using categorical variables (positive vs. negative).15 However, when BQR and BQL samples were included in the analysis, a moderate agreement was observed only when 3/3-BQR (k = 0.6, 79% agreement, 95% CI: 0.5 to 0.7) or both 3/3-BQR and 2/3-BQR (k = 0.5, 75% of agreement, 95% CI: 0.4 to 0.6) were included as positive and 1/3-BQR considered as negative. Conversely, only a fair agreement was observed when all BQR cases (1/3, 2/3 and 3/3) were considered positive (k = 0.3, 63% of agreement, 95% CI: 0.2 to 0.4).
Of note, few samples (12/73, 16%) from the 1/3-BQR group were quantified by ddPCR, and all were below 10E-4, while 21/63 (33%) and 52/82 (63%) of 2/3-BQR and 3/3-BQR samples, respectively, were reliably quantifiable by ddPCR.
These results were also analyzed using the initial criteria which required positivity (≥3 droplets) in all triplicates, Cohen's coefficients were slightly inferior (Table 1S and Table 4S) and all further analyses were performed with the revised criteria specified in materials and methods, supplement A1 and in Table 1.
Table 1.
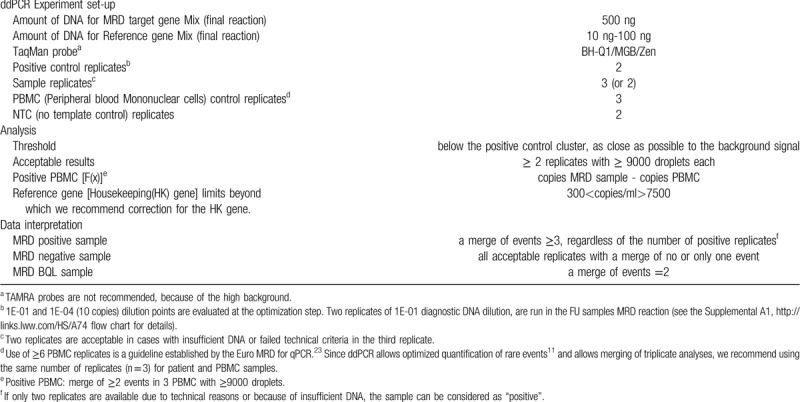
Guidelines for ddPCR Analysis and Interpretation
MRD detection was concordantly positive in 43/47 (91.5%) qPCR positive samples. Discordances were observed in 4 samples (4 patients), with 1 ddPCR negative and 3 BQL samples. Concordant negativity was observed in 76/95 (80%) qPCR negative samples. Among the qPCR negative samples, twelve from 8 patients (including 4 from a single patient), were positive by ddPCR, (median 8 copies; range 1–96 copies) and 7 (7 patients) were BQL. (Fig. 2 and Table 3S).
BQR samples were reliably quantified by ddPCR in 85/218 (39%), including 16 samples from 12 patients who were positive above 1E-4, (median 14 copies; range 8-243) and 69 ddPCR samples, from 54 patients, which were positive below 1E-4, with a median of 2 copies (range 1-7 copies, 3-17 positive events). A minority of BQR samples (28/218; 12.8%) were also borderline by ddPCR, since they fell into the BQL group (grey-zone in Fig. 2). The majority of BQR samples (105/218; 48%) were negative by ddPCR. Albumin ddPCR values for the 48/105 samples tested were all acceptable.
Amongst the 43 samples that were quantifiably positive by both techniques, 8 samples (5 BM and 3 PB from 8 patients) showed a discordance below 1 log but above or equal to a half log, while 9 (7 patients) PB, belonging to the MCL0208 trial, showed more than a 1 log difference between techniques (squares in Fig. 2). Samples which were ddPCR<qPCR came from patients that showed similar tendencies in their other MRD samples. Six samples with ddPCR>qPCR came from 3 patients, 2 of which had unreliable standard curves since no MFC had been performed, thus reflecting the value of absolute quantification by ddPCR and its independence from MFC.
Sub-optimal ddPCR results
In order to determine whether ddPCR results should be corrected for DNA amplifiability, two centers (NCK and CRE) quantified the albumin housekeeping gene from 100 ng of DNA, in a separate ddPCR reaction to the IgH/BCL1-IgH target. Since 100ng DNA theoretically contains 30000 albumin copies, this should generate 1500 copies/μl. 178/186 (95.5%) samples were within a 5-fold range from 1500 (300–7500) copies/μl and correction for these albumin values did not significantly change target values (Figure 1S). We therefore chose to not correct for albumin values but to use them to exclude samples with very low or high values, outside the range of 300–7500 copies/μl (corresponding theoretically to 20–500 ng). This corresponded to 8 samples. Three samples with very low albumin levels, below 30 copies, were excluded from the analysis but two samples with only 100 albumin copies/μl and 3 with more than 7500 copies/μl, but with no remaining DNA for verification and with ddPCR IgH values concordant with the qPCR result, were retained.
Seven patients (11 samples) showed non-specific amplification by ddPCR, defined by a total of greater than 3 positive droplets in the 6 PBMC replicates. Most also showed non-specific amplification by qPCR (Table 5S). Alternative ASO design or target choice was not possible for these patients. Target quantification, by subtraction of the number of non-specific events in the PBMC from the total number of events in the sample (using the formula described in materials and methods and supplemental A2), did not affect the results in 8/11 samples (3 positive and 5 negative) whereas 3 samples, (1 ddPCR positive and 2 BQL), became negative, in agreement with the qPCR result (Table 4S). We recommend this method of target quantification if there is a merge of ≥2 events in 3 PBMC with ≥9000 droplets (Table 1). The need for 6 PBMC triplicates is widely accepted for qPCR assessment of non-specific positivity, but is not necessary for ddPCR, since the calculation of rare events is more dependent on the number of negative droplets, and not just positive events. We consider that 3 replicates are sufficient for detection of non-specific positivity by ddPCR, in addition to facilitating calculation of true positivity in such cases, although this aspect could benefit from validation, including in other hematological malignancy MRD settings.
Fifty six samples were excluded from the initial analysis, 3 because of low albumin levels and 53 due to failed ddPCR quality criteria. In 6 samples, ddPCR was done only in duplicate, 31 samples had only 2 wells with sufficient droplets and 16 had at most one well with enough droplets. ICC analysis of the 37 samples with 2 reliable wells showed good correlation (ICC = 0.79, 95% CI: 0.62–0.88, p < 0.0001).
MRD detection was concordantly positive in 5/5 qPCR positive samples and concordantly negative in 9/10 qPCR negative samples. Overall, 22 samples were BQR by qPCR, with 13/22 (59%) negative by ddPCR, 1 (4.5%) being BQL and 8 (36.5%) positive by ddPCR, including 4/8 above 1E-4 (median 2.13.E-4 (16 copies); range 1.1E-4 to 5E-4 (9-38 copies). Taken together, these data justify using results obtained from duplicate, rather than triplicate, analyses, when necessary. Of a total of 240 BQR samples with duplicate or triplicate analysis, 39% were positive by ddPCR, 12% were BQL and 49% were negative (Table 1). When using the initial guidelines for positivity, 24% were positive by ddPCR, 15% were BQL and 61% were negative.
MFC vs ddPCR
Prospective MFC and ddPCR were performed on 65 FU samples from the MCLR2 trial in one center [NCK], with acceptable MFC sensitivity of 1E-4 in 63 samples. Three samples (from 2 patients) had been selected since MFC was positive at 5.1E-5, 2E-4, and 1E-2 but qPCR was negative. ddPCR confirmed the molecular negativity and genescan clonality analysis failed to detect a different, clonal IgH population in the latter sample, the only one with a quantification value theoretically detectable by genescan (sensitivity 0.5%–5%). Of the remaining 60 FU samples, 7 had only been analyzed in duplicate by ddPCR (5 were negatively concordant with MFC and 2 BQF (below quantitative fluorescence) samples were ddPCR positive). Overall, an excellent rate of concordance (ICC = 0,923, 95%CI: 0.874-0.953) was observed. 8/10 samples positive by ddPCR >1E-4 (median 107 copies, range 21–18720) were also MFC positive, including one BQF, whereas only 3/13 samples positive by ddPCR below 1E-4, including 2 BQL, were positive by MFC. Conversely, 3/38 ddPCR negative samples were MFC positive, between 5E-5 and 4E-4. (Fig. 3, Table 6S)
Figure 3.
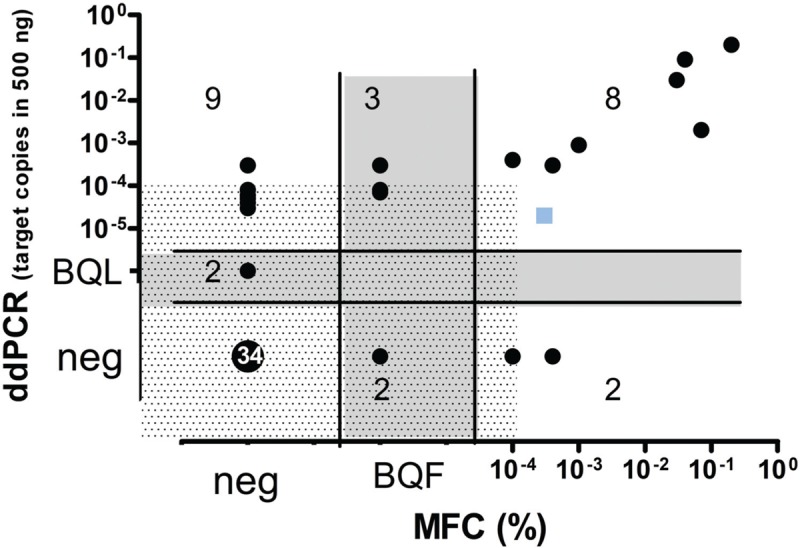
MRD quantification by ddPCR in comparison to Multiparameter Flow Cytometry (MFC). Blue square: positive sample with a discordant MRD level between methods (MFC >1E-4 (10-4) and ddPCR<1E-4 (10-4)). Shaded zone: cut-off at 1E-4 copies; grey-zone: positive Below Quantitative Limit (BQL) by ddPCR and Below Quantitative Fluorescence (BQF) by MCF, neg: MRD negative.
Discussion
MRD monitoring is widely used in MCL patients, not only to assess prognosis of a cohort of similarly treated patients at end of induction or prior to stem cell therapy (SCT), but also increasingly to guide individual treatment, including for pre-emptive treatment at molecular relapse.1–3,16 So far, qPCR represents the gold standard analysis for molecular MRD quantification, but the fact that half of the positive results are below the quantifiable range of 0.01% or 1E-4, is problematic.5
Following on from the standardization of qPCR MRD quantification in ALL and lymphoma within the Euro-MRD group, we now show that reproducible results can be obtained by ddPCR, including for very low-level positivity, on condition that operating procedures and interpretation are highly standardized, with dissemination of clear guidelines. We now show that ddPCR drastically reduces the incidence of non-quantifiable positivity and splits these samples into approximately 40% positive, 50% negative and 10% borderline (BQL), providing more robust quantification than qPCR for samples with positivity between 1E-4 and 1E-5. We also show that ddPCR is more sensitive than MCF but that all 3 techniques give comparable results above 0.01%.
Borderline results are less common with ddPCR than qPCR, partly since the former is not dependent on use of a standard curve. Standard curves are usually reliable when diagnostic samples are massively infiltrated, with known levels of infiltration, and the proportion of apoptotic cells is low, as in ALL. These conditions are often not met in MCL, since PB and BM infiltration at diagnosis is usually below 10% (median 7% in EU-MCL trials) and the presence of apoptotic MCL cells, which contribute to DNA but not to the MCF window of analysis, is frequent.3 The reported extended dynamic range of quantifiable positivity for ddPCR, confirmed here, and its tolerance to inhibitors, are additional explanations.9,10 MRD by qPCR and ddPCR start with the same amount of DNA (total 1.5 μg, equivalent to 225,000 cells) but only ddPCR allows compilation between triplicate wells, giving a 3-fold higher maximal theoretical sensitivity, at 2E-5, by ddPCR, presuming a capacity to specifically detect a single event. Using a ddPCR cut-off of at least 3 events, 125/360 (34.7%) ddPCR results were quantifiably positive within the 1E-4 to 1E-5 range, of which only 30/125 (24%) were quantifiable by qPCR. The fact that, in the QA rounds, up to 9 laboratories were able to reproducibly quantify low-level of positivity within this range, confirms that low-level ddPCR positivity is robust, when performed by laboratories working according to standardized procedures.
Approximately 60% of BQR results were ddPCR negative, particularly when only one or 2 qPCR triplicates were positive. This must either reflect inferior sensitivity of ddPCR, false positivity of qPCR, or both. The latter is likely, since the clone-specific, patient-specific nature of ASO strategies makes qPCR and ddPCR performance variable. It is clearly important to evaluate the clinical relevance of MRD positivity by ddPCR compared to qPCR but this requires large patient cohorts in order to have sufficient patients with BQR positivity at clinical time points that have most prognostic impact. It will also be important to evaluate these samples by NGS, as is being undertaken within the Euro-MRD group.17–21
Borderline positivity by ddPCR continues to exist, since MRD positivity is a continuous spectrum. In the previously published EU-MCL cohort of 894 MRD samples, 20% were BQR.5 By extrapolation, based on our results, ddPCR analysis will reduce this grey-zone to only approximately 2% of overall results. Individual therapeutic stratification is based on repeated sampling, so BQL results should be confirmed by repeat testing prior to treatment modification.
ddPCR has its own limitations. It requires at least 9000 droplets in each replicate to guarantee proper Poisson correction. 4% (16/416) of samples were excluded on this basis. These came disproportionately from one clinical trial and one center (MCLR2 at NCK) and coincided with a particular form of automated DNA bead-based extraction. DNA quality is an important issue for droplet generation, although satisfactory results were obtained for many samples with DNA extracted over 10 years ago, albeit from fresh, not fixed, samples.22 When duplicate samples were obtained, however, ddPCR values showed a good correlation with qPCR (ICC = 0.787, 95%CI: 0,624–0,884, p < 0.0001) indicating that duplicate results are reliable, although it is prudent to maintain triplicate MRD analysis.
A minority of samples demonstrated non-specific ASO positivity by both ddPCR and qPCR. We here propose a method for quantification of these results (Table 1), although whenever possible, an alternative IG or BCL1-IGH target or ASO primer should be chosen.
We chose not to correct target values for DNA quantity, based on albumin quantification in a separate reaction, since correction of target values did not change the result in the vast majority of MRD samples. Albumin correction can be considered for results with excessively low (<300 copies/μl) or high (>7500 copies/ μl) values. This is particularly important when working with FFPE samples. It is also useful for correcting infiltration at diagnosis.
There were a small number of patients with discordant results, including at relatively high levels of positivity. These are likely to result from problematic qPCR standard curves (ie, not corrected for infiltration, late/high diagnostic Ct-value, high quantitative range, etc) and sub-optimal ASO primers. While the former is specific to qPCR strategies, the latter applies to both qPCR and ddPCR and is inherent in using immune repertoire targets for MRD. This is less problematic when using BCL1-IGH targets.
Having previously shown that retrospective MFC was comparably sensitive to qPCR, down to levels of 0.01% (1E-4), we undertook to compare prospective MFC and ddPCR.5 This showed that, as for qPCR, MFC was comparable to ddPCR for positivity above 1E-4, but was not designed to reach lower level sensitivity. This would require an increase in the number of cells analyzed, above the 200,000 to 1 million cells evaluated here. MFC is a valuable complement to molecular analysis, at both diagnosis and FU and its realization in integrated platforms is to be recommended.
The present comparison demonstrates that ddPCR is preferable to qPCR for MRD quantification in MCL. At a strict minimum, we recommend its use for quantification of diagnostic tissue infiltration or PB/BM samples for which MFC analysis is not feasible or when MFC estimates of infiltration do not match those found with qPCR standard curves. The improved, reproducible, capacity to quantify low level positivity between 1E-5 and 1E-4 makes ddPCR preferable to qPCR for clone-specific MRD quantification in MCL, if practiced in a standardized manner. The guidelines presented here will allow assessment of the clinical predictive value within and between MCL protocols and their evaluation in other lymphoid malignancies, including by the Euro-MRD group. The prognostic relevance of ddPCR needs to be compared to qPCR, but it appears better adapted to pre-emptive surveillance, since more sensitive than MCF, less subject to grey-zone, BQR, positivity than qPCR and capable of absolute and reproducible quantification of low-level positivity. The Euro-MRD lymphoma group is investigating its prognostic relevance.
Materials and methods
Inter-laboratory Quality assessment (QA) rounds
QA rounds involved analysis of two provided sequences, an IGH gene rearrangement and/or a BCL1-IGH translocation, from the same patient. Primers and probe assays were optimized by each laboratory and both qPCR and ddPCR were performed on provided FU genomic DNA. Concordance was assessed compared to the MRD value previously quantified by qPCR, considered to be the reference value.
Sample characteristics and DNA extraction
Sample collection and storage was performed based on specific standard operating procedures (Sop) for each protocol. gDNA derived from bone marrow (BM) and peripheral blood (PB) samples from 166 MCL patients was analysed (Table 7S). Samples were selected for having a molecular marker based on the IGH VDJ or BCL1-IGH rearrangements and were collected in the context of four registered prospective clinical trials approved by the local institutional review boards (MCL0208:EUdract 2009-012807-25; EUMCL: NCT00209222 and NCT00209209; MCLR2: EUdract 2012-002542-20). All patients provided written informed consent for PCR-based MRD determination, according to the Helsinki Declaration. Analyses were performed independently by four distinct laboratories: Necker/NCK (EUMCL and MCLR2); Créteil/CRE (MCLR2); Torino/TOR (MCL0208) and KIEL (EUMCL), according to Euro-MRD guidelines, as described.6,12,23 Overall, 416 FU samples were analyzed.
Tumor-specific molecular marker assessment
Patient-specific rearrangements were detected in diagnostic gDNA by qualitative consensus PCR for IGH and BCL1-IGH and direct sequencing.4,24,25 Sequences were analysed using the IMGT/V-QUEST tool [http://imgt.org],26,27 and patient-specific ASO primers and consensus probes were designed as described.28–30
qPCR
ASO-based qPCR MRD quantification was carried out, relative to diagnostic gDNA 10-fold serial dilution standard curves, as described29,30 and interpreted according to Euro-MRD guidelines, using a 1 Ct cut-off from background, usually adopted for protocols that aim at therapy reduction.23 Samples which were positive but not quantifiable, because the ΔCt of the replicates was >1.5 and/or showed alternatively positive or negative replicates and/or Ct mean values outside the quantitative range QR (the part of the standard curve in which the MRD levels can be quantified reproducibly and accurately) were defined as BQR (below quantitative range).
MFC
MFC was performed in Paris-Necker on a FACS canto-II flow cytometer with DIVA software (Becton-Dickinson, USA) and standardized EuroFlow instrument settings, as previously described.5 Prospective eight-color MRD MFC was performed on 2E5 - 1E6 cells from fresh whole blood/bone marrow cells stained with a conjugated monoclonal antibody combination using CD3/CD14/CD56-(FITC), LAIR-1/CD305-(PE), CD19-(PeCy7), CD5-(PerCPCy5.5), CD11A- (APC), and CD45 (V500) (Becton-Dickinson, San Jose, CA, USA) Lambda (Alexa700), Kappa (Pacific Blue) (Exbio, Prague, the Czech Republic). At least 2E5 non-gated events were acquired. MRD positivity was defined by a homogenous cluster of >20 events and was quantified by dividing the number of MCL cells by the total number of events acquired. This resulted in a robust quantifiable sensitivity (<20 cells in the Mantle box) of 1E-4. Samples positive between 5E-5 and 1E-4 were defined as BQF (below quantitative fluorescence).
ddPCR
ddPCR was performed using the QX100/200 Droplet Digital PCR system (Bio-Rad Laboratories, Hercules, CA) as described.6,12 Of note, ddPCR experiments employed the same primers and probes used for qPCR, although in some cases MGB or BHQ-1 quenchers were used instead of TAMRA. Droplets were generated by a droplet generator device, and end-point PCR was performed on a Thermal Cycler (following the manufacturer's recommendations). Each experiment included at least a duplicate of positive control sample (1E-1 or 1E-2 diluted diagnostic gDNA), at least six replicates of negative control (BCT: pool of 10 healthy donor PBMC gDNA) and at least 2 replicates of non-template control (NTC) (Supplemental A1).
In 208 samples, DNA amplifiability was assessed by quantification of the albumin housekeeping gene from 100ng of gDNA sample in a single well, total volume 20 μl.31 As for qPCR, FU samples were analyzed in triplicate using 500 ng of gDNA (equivalent of 75000 cells) in each well (250ng in EU-MCL samples at NCK) on the QX100/200 droplet reader and analyzed by QuantaSoft v1.6.6 or QuantaSoft™ Analysis Pro 1.0 (Bio-Rad Laboratories). Copies were calculated by the mean of copies/μl in each replicate and multiplied by the volume of the reaction (20 μl). The essential requirements listed on the digital MIQE guidelines32 are reported in Table 7S.
Results were initially interpreted using ddPCR guidelines, developed since 2015 within the Italian FIL-MRD network and adopted by the EURO-MRD group6 (Table 1S). ddPCR samples were selected based on the availability of all three technical replicates with ≥9000 droplets each, in order to guarantee proper Poisson law correction. Samples with less than 3 technical replicates were analyzed separately. Samples with all 3 positive replicates and a merge of events ≥3 (1 event in each replicate = 1 copy of target) were defined as MRD positive, while those samples with all negative replicates (with no events) or replicates with a merge of events <3 (either 1 or 2 events) were defined as MRD negative. Those samples with ≥3 events, but not all replicates with at least one event, were defined as BQL.
Results (for the 360 MRD samples with triplicate results meeting acceptability criteria) were then reevaluated considering all samples with a merge of events ≥3, regardless of the number of positive triplicates, as positive and samples with a merge of events =2 as BQL and these criteria were adopted after comparison. Samples with only one event were considered negative throughout.
For positive samples, based on the aforementioned criteria, the amount of copies of the target was expressed as the mean of replicate copies. Copies are counted based on the number of positive droplets with respect to the total droplets generated, corrected by Poisson, which takes account of positive droplets but mainly of negative droplets. Events are the total positive events identified in the 3 replicates. As such, copy numbers were used for quantification and cumulative events for acceptability criteria.
In cases with significant non-specific positivity in the pooled PBMC wells (>3 events in the merge of all 6 PBMC wells), an alternative ASO primer or target was used, whenever possible. No rules have been established, within the Euro-MRD group, for those cases with positive PBMC for which an alternative ASO primer and/or target is not possible (Table 1S). We here evaluated calculation of these results, based on Poisson statistics, extrapolating the value of PBMC copies from the number of positive events and subtracting them from the target copies, using the formula detailed in Table 5S, supplemental A2.
Statistical analysis
The qPCR versus ddPCR comparison was performed on log transformed data. qPCR results were calculated based on the standard curve (adjusted for MFC infiltration at diagnosis), while ddPCR results were expressed as amount of target copies per 105 cells, considering that 75.000 cells correspond to 500 ng of gDNA (∼6.6 pg/cell; ie, 1 copy of target or one positive droplet/replicate in 500ng corresponds to 1.3E-5). All BQL and negative samples were imputed arbitrarily at 1E-6 and 1E-8 respectively, for graphical representation, as done for qPCR results within Euro-MRD.23
To calculate the correlation and agreement between the methods, we evaluated the test-retest reliability for continuous variables by a single-measurement, consistent, 2-way mixed-effects model, Inter Class Correlation (ICC) analysis, with a 95% confident interval (CI).14 The strength of agreement of MRD positivity versus negativity between the two methods was calculated using the Cohen's k coefficient for categorical variables (graphpad.com/quickcalcs) (rather than continuous variables, as assessed by ICC analysis), thus also allowing inclusion of BQR and BQL results.14 Correlation analyses and their representation plots were performed using IBM SPSS Statistics (version 25.0. Armonk, NY: IBM Corp.) or GraphPad5 Software (GraphPad Software Inc, San Diego, CA).
Acknowledgements
We thank Benjamin Tournier, Sylviane Ragot, Susanna Grassi, Marzia Cavalli, Lucia Anna De Novi, Massimo Degan, Ariane Stur, Anne-Wiebke Kruse for their valuable technical support to the inter-laboratory QA.
Supplementary Material
Supplementary Material
Supplementary Material
Footnotes
Citation: Drandi D, Alcantara M, Benmaad I, Söhlbrandt A, Lhermitte L, Zaccaria G, Ferrante M, Genuardi E, Mantoan B, Villarese P, Cheminant M, Starza Id, Ciabatti E, Bomben R, Jimenez C, Callanan M, Abdo C, Eckert C, Ribrag V, Cortelazzo S, Dreyling M, Hermine O, Delfau-Larue MH, Pott C, Ladetto M, Ferrero S, Macintyre E. Droplet digital PCR quantification of Mantle cell lymphoma follow-up samples from four prospective trials of the European MCL network. HemaSphere, 2020;4:2(e347). http://dx.doi.org/10.1097/HS9.0000000000000347
Clincal trials: MCL0208:EUdract 2009-012807-25; EUMCL: NCT00209222 and NCT00209209; MCLR2: EUdract 2012-002542-20.
This work was supported by S.F.- Progetto di Ricerca Sanitaria Finalizzata 2010 [RF-2010-2307262 to S.C.], A.O. S. Maurizio, Bolzano/Bozen, Italy; Fondi di Ricerca Locale, Università degli Studi di Torino, Italy; Fondazione Neoplasie Del Sangue (Fo.Ne.Sa), Torino, Italy; Fondazione CRT (projects code: 2016.0677, 2018.1284), Torino, Italy.
CJ: Instituto de Salud Carlos III (ISCIII), Spanish Ministry of Economy and Competitiveness, CIBERONC-CB16/12/00233, the Lymphoma Study Association (LYSA), France
VR: ArgenX
DL, MH: Association pour la Recherche Therapeutique Genetique Immunologique sur le lymphome (ARTGIL), Creteil, France
EM: The Lymphoma Study Association (LYSA), Lyon, France.
References
- 1.Andersen NS, Pedersen LB, Laurell A, et al. Pre-emptive treatment with rituximab of molecular relapse after autologous stem cell transplantation in mantle cell lymphoma. J Clin Oncol. 2009;27:4365–4370. [DOI] [PubMed] [Google Scholar]
- 2.Pott C, Hoster E, Delfau-Larue MH, et al. Molecular remission is an independent predictor of clinical outcome in patients with mantle cell lymphoma after combined immunochemotherapy: a European MCL intergroup study. Blood. 2010;115:3215–3223. [DOI] [PMC free article] [PubMed] [Google Scholar]
- 3.Pott C. Minimal residual disease detection in mantle cell lymphoma: technical aspects and clinical relevance. Semin Hematol. 2011;48:172–184. [DOI] [PubMed] [Google Scholar]
- 4. Pott, C. Brüggemann M, Ritgen M. et al. MRD Detection in B-Cell Non-Hodgkin Lymphomas Using Ig Gene Rearrangements and Chromosomal Translocations as Targets for Real-Time Quantitative PCR BT - Lymphoma: Methods and Protocols. In: Küppers R. (eds) Lymphoma. Methods in Molecular Biology (Methods and Protocols), vol 971. Humana Press, Totowa, NJ. [DOI] [PubMed] [Google Scholar]
- 5.Cheminant M, Derrieux C, Touzart A, et al. Minimal residual disease monitoring by 8-color flow cytometry in mantle cell lymphoma: an EU-MCL and LYSA study. Haematologica. 2016;101:336–345. [DOI] [PMC free article] [PubMed] [Google Scholar]
- 6.Drandi D, Kubiczkova-Besse L, Ferrero S, et al. Minimal residual disease detection by droplet digital PCR in multiple myeloma, mantle cell lymphoma, and follicular lymphoma: a comparison with real-time PCR. J Mol Diagn. 2015;17:652–660. [DOI] [PubMed] [Google Scholar]
- 7.Cavalli M, De Novi LA, Della I, et al. Comparative analysis between RQ-PCR and digital droplet PCR of BCL2/IGH gene rearrangement in the peripheral blood and bone marrow of early stage follicular lymphoma. Br J Haematol. 2017;177:588–596. [DOI] [PubMed] [Google Scholar]
- 8.Hindson BJ, Ness KD, Masquelier DA, et al. High-throughput droplet digital PCR system for absolute quantitation of DNA copy number. Anal Chem. 2011;83:8604–8610. [DOI] [PMC free article] [PubMed] [Google Scholar]
- 9.Dingle TC, Sedlak RH, Cook L, et al. Tolerance of droplet-digital PCR vs real-time quantitative PCR to inhibitory substances. Clin Chem. 2013;59:1670–1672. [DOI] [PMC free article] [PubMed] [Google Scholar]
- 10.Huggett JF, Cowen S, Foy CA. Considerations for digital PCR as an accurate molecular diagnostic tool. Clin Chem. 2015;61:79–88. [DOI] [PubMed] [Google Scholar]
- 11.Lievens A, Jacchia S, Kagkli D, et al. Querci measuring digital PCR quality: performance parameters and their optimization. PLoS One. 2016;11:e0153317. [DOI] [PMC free article] [PubMed] [Google Scholar]
- 12.Drandi D, Ferrero S, Ladetto M. Droplet digital PCR for minimal residual disease detection in mature lymphoproliferative disorders. Methods Mol Biol. 2018;1768:229–256. [DOI] [PubMed] [Google Scholar]
- 13.Dogliotti I, Ferrero S. Personalized medicine in lymphoma: tailoring treatment according to minimal residual disease. Med Res Archives. 2017;5: [Google Scholar]
- 14.Koo TK, Li MY. A guideline of selecting and reporting intraclass correlation coefficients for reliability research. J Chiropr Med. 2016;15:155–163. [DOI] [PMC free article] [PubMed] [Google Scholar]
- 15.McHugh ML. Interrater reliability: the kappa statistic. Biochem Med. 2012;22:276–282. [PMC free article] [PubMed] [Google Scholar]
- 16.Gressin R, Daguindau N, Tempescul A, et al. A phase 2 study of rituximab, bendamustine, bortezomib and dexamethasone for first-line treatment of older patients with mantle cell lymphoma. Haematologica. 2019;104:138–146. [DOI] [PMC free article] [PubMed] [Google Scholar]
- 17.Wren D, Walker BA, Brüggemann M, et al. Comprehensive translocation and clonality detection in lymphoproliferative disorders by next-generation sequencing. Haematologica. 2017;102:e57–e60. [DOI] [PMC free article] [PubMed] [Google Scholar]
- 18.Kotrova M, van der Velden VHJ, van Dongen JJM, et al. Next-generation sequencing indicates false-positive MRD results and better predicts prognosis after SCT in patients with childhood ALL. Bone Marrow Transplant. 2017;52:962–968. [DOI] [PubMed] [Google Scholar]
- 19.Scheijen B, Meijers RWJ, Rijntjes J, et al. Next-generation sequencing of immunoglobulin gene rearrangements for clonality assessment: a technical feasibility study by EuroClonality-NGS. Leukemia. 2019;33:2227–2240. [DOI] [PMC free article] [PubMed] [Google Scholar]
- 20.Brüggemann M, Kotrova M, Knecht H, et al. Standardized next-generation sequencing of immunoglobulin and T-cell receptor gene recombinations for MRD marker identification in acute lymphoblastic leukaemia; a EuroClonality-NGS validation study. Leukemia. 2019;33:2241–2253. [DOI] [PMC free article] [PubMed] [Google Scholar]
- 21.Knecht H, Reigl T, Kotrova M, et al. Quality control and quantification in IG/TR next-generation sequencing marker identification: protocols and bioinformatic functionalities by EuroClonality-NGS. Leukemia. 2019;33:2254–2265. [DOI] [PMC free article] [PubMed] [Google Scholar]
- 22.Kim SS, Choi HJ, Kim JJ, et al. Droplet digital PCR-based EGFR mutation detection with an internal quality control index to determine the quality of DNA. Sci Rep. 2018;8:543. [DOI] [PMC free article] [PubMed] [Google Scholar]
- 23.van der Velden VH, Cazzaniga G, Schrauder A, et al. Analysis of minimal residual disease by Ig/TCR gene rearrangements: guidelines for interpretation of real-time quantitative PCR data. Leukemia. 2007;21:604–611. [DOI] [PubMed] [Google Scholar]
- 24.Voena C, Ladetto M, Astolfi M, et al. A novel nested-PCR strategy for the detection of rearranged immunoglobulin heavy-chain genes in B cell tumors. Leukemia. 1997;11:1793–1798. [DOI] [PubMed] [Google Scholar]
- 25.Rimokh R, Berger F, Delsol G, et al. Detection of the chromosomal translocation t(11;14) by polymerase chain reaction in mantle cell lymphomas. Blood. 1994;83:1871–1875. [PubMed] [Google Scholar]
- 26.Brochet X, Lefranc M.P, Giudicelli V. IMGT/V-QUEST: the highly customized and integrated system for IG and TR standardized V-J and V-D-J sequence analysis. Nucleic Acids Res. 2008;36:W503–W508. [DOI] [PMC free article] [PubMed] [Google Scholar]
- 27. Lefranc, M.-P. IMGT, the international ImMunoGeneTics database. Nucleic Acids Res. 2003;31:307–310. [DOI] [PMC free article] [PubMed] [Google Scholar]
- 28.van Dongen JJ, Langerak AW, Bruggemann M, et al. Design and standardization of PCR primers and protocols for detection of clonal immunoglobulin and T-cell receptor gene recombinations in suspect lymphoproliferations: report of the BIOMED-2 Concerted Action BMH4-CT98-3936. Leukemia. 2003;17:2257–2317. [DOI] [PubMed] [Google Scholar]
- 29.Pott C, Brüggemann M, Ritgen M, et al. MRD detection in B-cell non-Hodgkin lymphomas using Ig gene rearrangements and chromosomal translocations as targets for real-time quantitative PCR. Methods Mol Biol. 2013;971:175–200. [DOI] [PubMed] [Google Scholar]
- 30.Brüggemann M, Droese J, Bolz I, et al. Improved assessment of minimal residual disease in B cell malignancies using fluorogenic consensus probes for real-time quantitative PCR. Leukemia. 2000;14:1419–1425. [DOI] [PubMed] [Google Scholar]
- 31.Pongers-Willemse MJ, Verhagen OJ, Tibbe GJ, et al. Real-time quantitative PCR for the detection of minimal residual disease in acute lymphoblastic leukemia using junctional region specific TaqMan probes. Leukemia. 1998;12:2006–2014. [DOI] [PubMed] [Google Scholar]
- 32.Huggett JF1, Foy CA, Benes V, et al. The digital MIQE guidelines: minimum information for publication of quantitative digital PCR Experiments. Clin Chem. 2013;59:892–902. [DOI] [PubMed] [Google Scholar]
Associated Data
This section collects any data citations, data availability statements, or supplementary materials included in this article.