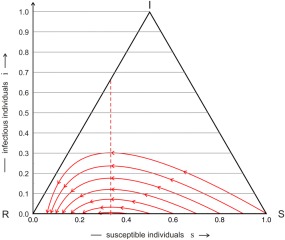
Figure 4.

Trajectories of the simple SIR model. Trajectories of individual epidemics, ϑ(t), calculated by the simple SIR model are shown on the unit simplex S 3, ϑ(t) = {s(t), i(t), r(t)} with s + i + r = 1. Every trajectory starts at t = 0 at the right end and progresses with increasing time to the left end that corresponds to the limit t → ∞. The initial conditions are given by s 0 = α − δ, i 0 = δ, and r 0 = 1 − α, with δ = 0.001 and α = 1.0, 0.9, 0.8, 0.7, 0.6, 0.5, and 0.4, or in other words a population of α susceptible and 1 − α immune individuals is infected by a small fraction of diseased people. The number of infectious individual increases, passes through a maximum at , and for long times converges to limt →∞ i(t) = 0, the disease has disappeared. Parameters: β = 3, γ = 1, and .
