

Abstract
Objective
To investigate viral infection in patients with acute exacerbation of chronic obstructive pulmonary disease (AECOPD) in Shanghai, and to analyze the clinical characteristics and biomarkers in viral infection.
Methods
This study included all consecutive patients who were admitted for a diagnosis of AECOPD during June 2013 to May 2015. Thirty‐one stable COPD patients and 31 healthy controls were also recruited. Oropharyngeal samples were assessed, PCR for respiratory viruses were performed. Patients were divided into AECOPD virus‐positive (+) group and AECOPD virus‐negative (−) group according to viral detection. Luminex was used to detect the concentrations of inflammatory cytokines in the serum.
Results
A total of 264 patients were included with a mean age of 75 ± 0.5 years. There were 72 patients (27.3%) identified with viral positive, of whom two patients were detected with double viral infections (FluA + FluB and RSVA + HRV, respectively). The rate of viral detection was associated with season, highest in winter. Comparisons of clinical characteristics showed no significant differences between AECOPD virus+ group and AECOPD virus− group. However, serum concentrations of interferon‐inducible protein‐10 (IP‐10) and interferon‐gamma (IFN‐γ) in virus+ AECOPD patients were significantly higher than those in the virus− AECOPD, stable COPD and healthy control groups (P < .05).
Conclusion
Viral infection was an important pathogen in AECOPD patients; the most common viruses included FluA, HRV and FluB. It was very difficult to diagnose the viral infection according to clinical characteristics. The increased of serum IP‐10 and IFN‐γ levels might be value to indicate viral infection in AECOPD.
Keywords: acute exacerbation of chronic obstructive pulmonary disease, chronic obstructive pulmonary disease, cytokine, IP‐10, viral infection
1. INTRODUCTION
Chronic obstructive pulmonary disease (COPD) is a common respiratory and inflammatory disease that is characterized by limited and incompletely reversible airflow.1 COPD ranks 12th among the most prevalent chronic diseases throughout the world, and is estimated to reach 5th in the next two decades.2, 3 Acute exacerbation in COPD is considered as the main cause of mortality, especially in patients with severe acute exacerbation.4
The main cause of acute exacerbation of COPD (AECOPD) includes air pollution, bacterial infection and viral infection. But most of the AECOPDs are correlated with bacterial and viral infections. Virus accounts for 40% of all the incidences. Of all the viral infections, the leading cause of COPD is rhinovirus (HRV) accounting for approximately 58%. Few pathogens such as respiratory syncytial virus (RSV), human coronavirus (HCoV), influenza virus (Flu), parainfluenza virus (PIV) and human adenovirus (HADV) are also included in the cause of COPD.5, 6 Bacteria can be easily separated with specific remedial effects and, therefore, are easier to confirm, but viruses are hard to be isolated and detected to bring effective treatment outcomes. Therefore, importance of virus is not adequately recognized. Recently, with the development of clinical application of nucleic acid detection technology for respiratory viruses, the importance of viral infection in AECOPD has been increasingly regarded.7
Clinicians expect to find some highly specific biomarkers that can easily and quickly confirm viral infection in AECOPD. Levels of C‐reaction protein (CRP) increase rapidly during serious infections. But it is suggested that CRP and procalcitonin (PCT) may provide no valuable evidence in distinguishing bacterial and viral infections.8 It is also reported that AECOPD is correlated with higher levels of airway proinflammatory cytokines such as Interleukin‐6 (IL‐6)9, 10 and Interleukin‐8 (IL‐8) in viral infections.11 Moreover, it is found that increased interferon‐inducible protein‐10 (IP‐10) is associated with HRV infection, and therefore, is considered as a biomarker in HRV infection.12 In addition, there are no reports till date regarding other biomarkers in AECOPD that are associated with viral origin.13, 14
Studies in the recent years showed that pathogens involved in the respiratory viral infections in Shanghai were mainly Flu and HRV.15, 16 2282 patients (including adults and children) with acute respiratory tract infection were studied in Shanghai during 2009–2011, and then the results showed that the main pathogens were Flu and HRV.15 Xia et al16 had investigated 2346 adult patients with acute respiratory tract infection during 2012–2015 in Shanghai, which indicated that respiratory tract infections were mainly caused by FluA, followed by FluB. But both two studies focused on the prevalence of pathogens involved in the respiratory tract infection in Shanghai.
Hence, in order to further elucidate the broad spectrum of viral infection in AECOPD patients and to determine some biomarkers associated with the clinical features and viral infection, this study prospectively investigated the viral pathogens in 264 AECOPD patients who were hospitalized in our hospital. The levels of some serum cytokines (IFN‐γ, interleukin [IL]‐17A, IL‐1α, IL‐1β, IL‐4, IL‐6, IP‐10 and tumor necrosis factor [TNF]‐α) were determined among the AECOPD virus‐positive (+), AECOPD virus‐negative (−), stable COPD and healthy control groups. We hoped to find some specific biomarkers related to viral infections in AECOPD.
2. MATERIAL AND METHODS
2.1. Subjects
During June 2013 to May 2015, 264 clinician‐diagnosed AECOPD patients (197 males and 67 females, with a mean age of 75 years old) who were consecutively admitted were enrolled into this study. In every quarter, 33 swab samples were collected from AECOPD patients on an average. Meanwhile, 31 patients eligible for stable COPD criteria as well as 31 healthy controls were selected by screening the population at Jiangchuan Community, Minhang District in Shanghai during April and July 2014. Our study was approved by the Ethics Committee of the Fifth People's Hospital of Shanghai, Fudan University. All the participants signed the written informed consent forms.
2.2. Inclusion and exclusion criteria
COPD were diagnosed according to GOLD criteria,1 with a postbronchodilator forced expiratory volume in 1 second (FEV1) to forced vital capacity (FVC) ratio <70%. The AECOPD was defined as an acute event characterized by a worsening of respiratory symptoms (dyspnea, sputum purulence or sputum volume) that was beyond normal day‐to‐day variations, and led to a change in medication. Stable COPD was defined as without any symptoms of exacerbation or changes in treatment within the last 8 weeks. The patients were assigned to COPD stages based on the GOLD criteria and according to the most recent available spirometric values (the last 3 months). Some AECOPD patients performed a spirometry when his symptoms bad been relieved before discharged or within one month after discharged from the hospital. Standardized pulmonary function test was performed with a dry spirometer device (Quark PFT Ergo, COSMED, Italy) at 15 minutes after inhaling salbutamol 400 μg (Ventolin, GlaxoSmithKline, London, UK) and the FVC, FEV1 and FEV1/FVC ratio were recorded.
Exclusion criteria for AECOPD or COPD included: did not meet inclusion criteria; did not complete pulmonary function tests, a primary diagnosis of asthma, bronchiectasis, lung cancer or other active chronic respiratory disease requiring treatments, interventions or diagnostics or any other severe or uncontrolled co‐morbidities; mental disorders.
The inclusion criteria for healthy controls (>18 years) included: absence of infection, no history of respiratory disease or any other severe or uncontrolled diseases, no abnormal findings in the physical examination, chest X‐ray or pulmonary function test in the last two months before initiation of the study.
In the AECOPD virus+ group, 28 serum samples were accidentally destroyed during storage and hence were excluded as this would result in severe hemolysis or hyperlipidemia of the sample and show a great impact on the results.
2.3. Experimental reagents
QIAGEN nucleic acid extraction kit was purchased from Roche (Switzerland). TaKaRa reverse transcription polymerase chain reaction (RT‐PCR) detection kit was purchased from TaKaRa (Japan). HCYTOMAG‐60K kit was purchased from Merck Millipore (Germany); and the reagents were manufactured and purchased in China. Primers and probes were provided by the Department of Pathogen Detection and Biosecurity, Shanghai Public Health Clinical Center affiliated to Fudan University (Supporting Information Table 1).
2.4. Methods
2.4.1. Clinical data collection
The following parameters were recorded on admission: age, sex, stage of COPD (according to GOLD criteria), smoking habits, comorbidities (confirmed by medical records), duration of antibiotic usage, disease outcomes and length of hospital stay. All patients underwent routine blood examination, including C‐ reactive protein, blood routine, liver function, blood coagulation function, blood gas analysis and so on.
2.4.2. Swab sample collection
Swab samples were collected from patients within 24 hours after admission and were then transferred into the test tubes with a screw cap where each test tube carried 3 mL minimum essential medium containing 1 mg/mL gentamicin, 1000 U/mL penicillin, 2.5 μg/mL amphotericin B and 2% fetal bovine serum. They were then stored temporarily in the refrigerator at 4°C and were transferred to the lab within 48 hours. For each patient, 3 mL blood sample was harvested intravenously to separate the serum and then was stored in the refrigerator at −80°C.
2.4.3. Nucleic acid extraction and RT‐PCR virus detection
High Pure Viral Nucleic Acid kit (Roche, Switzerland) was used to extract DNA/RNA from the swab samples while the extracts were dissolved in 50 μL eluent and was immediately transferred into the refrigerator at −80°C preparing for use. Primers and probes were provided by the Department of Pathogen Detection and Biosecurity, Shanghai Public Health Clinical Center affiliated to Fudan University. One‐step real‐time PCR reaction was performed with ABI‐ViiA7 real‐time fluorescent quantitative PCR. Nine types of respiratory viruses were detected, which included FluA, FluB, HADV, RSVA, RSVB, HRV, PIV, human bocavirus (HBoV) and human metapneumovirus (HMPV). The 25 μL reaction system (TaKaRa, Japan) consisting of 12.5 μL 2 × buffer, 0.5 μL Ex TaqHS, 0.5 μL Enzyme Mix, 0.75 μL upstream primer, 0.75 μL downstream primer, 0.5 μL probe, 7 μL H2O and 2.5 μL RNA template was used. Reaction conditions included reverse transcription at 42°C for 10 minutes, predegeneration at 95°C for 1 minute, degeneration at 95°C for 5 seconds, 40 cycles of annealing extension at 60°C for 30 seconds and collection of fluorescence in the annealing temperature. Nine types of respiratory viruses were determined by FAM, FAM, FAM, FAM, FAM, CY3, HEX, FAM and FAM fluorescence signal, respectively. Positive judgment principles included Ct value <35 and S amplification curve. Ct value <35 and a good amplification curves can be directly judged positive; Ct value between 35 and 37 needed to repeat the experiment. If two tests can both get good S amplification curve, it can be judged positive.
While HCoV was detected using RT‐PCR. The 25 μL reaction system consisting of 12.5 μL 2 × buffer, 0.5 μL Ex TaqHS, 0.5 μL Enzyme Mix, 0.75 μL upstream primer, 0.75 μL downstream primer, 7.5 μL H2O and 2.5 μL RNA template was used. Reaction conditions included reverse transcription at 42°C for 10 minutes, predegeneration at 95°C for 1 minute, 5 cycles of degeneration at 95°C for 5 seconds and at 55°C for 1 minute, 40 cycles of annealing extension at 95°C for 30 seconds and at 55°C for 1 minute. The PCR products were electrophoresed in 2% agarose gel and the type of virus was judged with reference to positive quality product.
2.4.4. Detection of serum cytokines
The Merck Millipore human cytokine/chemokine magnetic bead panel kit (96‐well plate) was used to detect serum cytokines such as IFN‐γ, IL‐17A, IL‐1α, IL‐1β, IL‐4, IL‐6, IP‐10 and TNF‐α. Serum was added into the 96‐well plates according to the manufacturer's instructions. Results were analyzed by Luminex200 and stored the median fluorescence intensity data. A 5‐parameter logistic or spline curve fitting was adopted to calculate the cytokine concentrations in the samples.
2.5. Statistical analysis
Discrete variables were expressed as counts (percentages) and continuous variables were expressed as mean ± standard deviation or median (interquartile difference). T test was used to compare the means of independent samples between the two groups. Mann‐Whitney test was used to analyze the median of independent samples between the two groups. Chi‐square (χ2) test and Fisher's exact probability method were utilized to compare the discrete variables, and Spearman correlation test was adopted to assess the correlation of independent samples between the two groups. P < .05 was considered to be statistically significant. SPSS 18.0 software and GraphPad 6.0 were used for statistical analysis.
3. RESULTS
3.1. Variety of composition of respiratory viral pathogens in AECOPD patients
Respiratory viruses were detected by PCR, which indicated that of the 264 patients, 72 were virus+ (with the positive rate of 27.3%) and 192 were virus−; while 70 (26.72%) showed single virus infection and 2 (0.76%) showed dual viral infection (FluA + FluB and RSVA + HRV, respectively) (Figure 1). A total of 74 respiratory viral strains from eight viral types were isolated (with a total detection rate of 28.0%), which included 25 (9.5%) FluA strains, 15 (5.7%) FluB strains, 4 (1.5%) HADV strains, 4 (1.5%) RSVA strains, 21 (8.0%) HRV strains, 3 (1.1%) HCoV strains, 1 (0.4%) HBoV strain and 1 (0.4%) HMPV strain (Figure 2).
Figure 1.

The proportions of patients with a negative viral infection, dual viral infection and single viral infection from the 264 AECOPD patients. Abbreviation: AECOPD, acute exacerbation of chronic obstructive pulmonary disease
Figure 2.
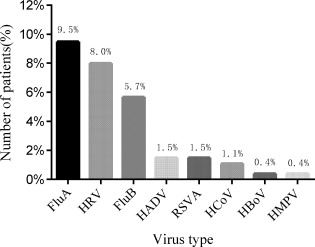
Identified viruses in 264 AECOPD patients. Abbreviations: FluA, influenza virus type A; HRV, rhinovirus; FluB, influenza virus type B; HADV, human adenovirus; RSVA, respiratory syncytial virus type A; HCoV, human coronavirus; HBoV, human Bocavirus; HMPV, human metapneumovirus; AECOPD, acute exacerbation of chronic obstructive pulmonary disease
3.2. Correlation between the detected number of respiratory viruses in AECOPD patients and season
The duration between June 2013 and May 2015 was divided into four seasons of spring, summer, autumn and winter. We found that viral infections appeared in AECOPD patients in every season, and of these winter season witnessed most of the infections, followed by spring and summer. The most common viral pathogens were FluA, FluB and HRV and the specific distributions of the most commonly detected viruses were as follows: FluA from December 2013 to February 2014 (winter); HRV from March to May 2014 (spring); FluA from July to August 2014 (summer); FluA and FluB from December 2014 to February 2015 (winter) (Figure 3).
Figure 3.

Seasonal variability of viruses detected in 264 AECOPD patients. Abbreviations: FluA, influenza virus type A; FluB, influenza virus type B; HADV, human adenovirus; RSVA, respiratory syncytial virus type A; HRV, rhinovirus; AECOPD, acute exacerbation of chronic obstructive pulmonary disease
3.3. Analysis of the clinical characteristics of the patients
AECOPD patients were divided into AECOPD virus+ group (n = 72) and AECOPD virus− group (n = 192). No statistically significant differences were observed for the clinical indices such as age, sex, history of smoking, complications, body temperature, blood routine, liver function, blood coagulation function, duration of antibiotic use, disease outcome, length of hospital stay and so on. between AECOPD virus+ group and AECOPD virus− group (all P > .05, Table 1). Based on the definition of an older or elderly person by the World health organization,17 we classified all the AECOPD patients into elderly group (age >65 years old, n = 199) and nonelderly group (age ≤ 65years old, n = 65), and compared the aforementioned clinical parameters. The results showed statistically significant differences in age, pulmonary hypertension value, length of hospital stay, days of antibiotic use and number of patients with viral infection between elderly group and nonelderly group (all P < .05, Table 2). In addition, for adopting the diagnostic criteria for community‐acquired pneumonia,18 we also classified all the patients from AECOPD virus+ group into virus+ patients with pneumonia group (n = 41) and virus+ patients without pneumonia group (n = 31) and compared the above clinical indices between these two groups. We found that the patients in the two groups differed significantly in body temperature, erythrocyte sedimentation rate, length of hospital stay and days of antibiotic use (all P < .05, Table 3).
Table 1.
Comparison of clinical data between AECOPD virus+ and AECOPD virus− patients
| Parameter | AECOPD virus+ (n = 72) | AECOPD virus− (n = 192) | χ2 value and P value |
|---|---|---|---|
| Age (years) | 76 ± 7.6 | 74 ± 8.9 | P = .235 |
| Smoker | 33(45.83) | 82(43.16) | χ2 = 0.152, P = .697 |
| Comorbidities | 48(66.67) | 143(75.26) | χ2 = 1.953, P = .162 |
| T≤37.3°C | 59(81.94) | 165(85.94) | χ2 = 1.273, P = .259 |
| T>37.3°C | 14(18.06) | 26(13.54) | |
| WBC (>10 × 10^9/L) | 14(19.44) | 44(22.92) | χ2 = 0.368, P = .544 |
| WBC (≤10 × 10^9/L) | 58(80.56) | 148(77.08) | |
| WBC (<4 × 10^9/L) | 7(9.72) | 16(8.33) | χ2 = 0.127, P = .727 |
| WBC (≥4 × 10^9/L) | 65(90.28) | 176(91.67) | |
| NEUT (10^9/L) | 6.00 ± 3.63 | 6.58 ± 6.41 | P = .467 |
| LY (10^9/L) | 1.10 ± 0.61 | 1.17 ± 0.62 | P = .447 |
| EOS (10^9/L) | 0.09 ± 0.12 | 0.11 ± 0.21 | P = .406 |
| HGB (g/L) | 130 ± 14.8 | 130 ± 19.6 | P = .830 |
| ESR (mm/h) | 21 ± 2.4 | 20 ± 1.9 | P = .867 |
| CRP (mg/L) | 25.98 ± 4.16 | 23.70 ± 2.37 | P = .615 |
| PCT (ng/mL) | 0.11 ± 0.03 | 0.11 ± 0.01 | P = .960 |
| D‐Dimer (ug/L) | 1.03 ± 1.36 | 1.08 ± 1.80 | P = .859 |
| ALT (U/L) | 20 ± 10.9 | 23 ± 25.4 | P = .437 |
| LDH (U/L) | 308 ± 22.6 | 282 ± 12.9 | P = .314 |
| CK (U/L) | 147 ± 6.7 | 141 ± 6.3 | P = .126 |
| PH | 7.35 ± 0.06 | 7.37 ± 0.04 | P = .147 |
| PO2 (mm Hg) | 75.8 ± 1.5 | 73.1 ± 1.4 | P = .385 |
| PCO2 (mm Hg) | 46.2 ± 1.8 | 48.0 ± 0.9 | P = .828 |
| SpO2 (%) | 95.4 ± 0.3 | 94.8 ± 0.5 | P = .446 |
| PAP (mm Hg) | 42 ± 17.4 | 40 ± 14.9 | P = .614 |
| GOLD class (n, group sI, II, III, IV) | 3/16/32/21 | 17/34/75/66 | χ2 = 2.887, P = .409 |
| FEV1 (L) | 0.9 ± 0.1 | 1.0 ± 0.1 | P = .915 |
| FEV1(% pred) | 42.2 ± 4.1 | 40.6 ± 2.3 | P = .734 |
| FEV1/FVC(%) | 50.8 ± 3.7 | 50.2 ± 2.3 | P = .902 |
| Length of stay(d) | 12 ± 4.2 | 12 ± 4.9 | P = .574 |
| Use of antibiotics(d) | 12 ± 4.2 | 11 ± 4.6 | P = .532 |
| Deaths | 3(4.17) | 3(1.56) | χ2 = 0.641, P = .423 |
Notes: P < .05 is considered statistical significant; Data are presented as number (%) or mean ± SD; T test and chi‐square test are adopted.
Abbreviations: AECOPD, acute exacerbation of chronic obstructive; NEUT, neutrophil count; LY, Lymphocyte count; EOS, eosinophil count; HGB, hemoglobin concentration; ESR, erythrocyte sedimentation rate; CRP, C‐reactive protein; PCT, procalcitonin; ALT, alanine aminotransferase; LDH, lactate dehydrogenase; CK, creatine kinase; PAP, pulmonary artery pressure; GOLD, global initiative for chronic obstructive lung disease; FEV1, forced expiratory volume in one second; FVC, forced vital capacity.
Table 2.
Comparison of clinical data between elderly and nonelderly AECOPD patients
| Parameter | Patients ≤65 Years (n=65) | Patients>65 Years (n=199) | χ2 value and P value |
|---|---|---|---|
| Age (years) | 62 ± 0.8 | 79 ± 0.3 | P < .0001 |
| Smoker (%) | 27(41.54) | 88(44.22) | χ2 = 0.143, P = 0.705 |
| Comorbidities (%) | 46(70.77) | 145(72.86) | χ2 = 0.108, P = .743 |
| T≤37.3°C | 54(83.08) | 170(85.43) | χ2 = 0.211, P = .646 |
| T>37.3°C | 11(16.92) | 29(14.57) | |
| WBC (>10 × 10^9/L) | 14(19.44) | 44(22.92) | χ2 = 0.368, P = .544 |
| WBC (≤10 × 10^9/L) | 58(80.56) | 148(77.08) | |
| WBC (<4 × 10^9/L) | 7(9.72) | 16(8.33) | χ2 = 0.127, P = .727 |
| WBC (≥4 × 10^9/L) | 65(90.28) | 176(91.67) | |
| NEUT (10^9/L) | 6.91 ± 1.31 | 6.13 ± 0.28 | P = .374 |
| LY (10^9/L) | 1.25 ± 0.09 | 1.11 ± 0.04 | P = .171 |
| EOS (10^9/L) | 0.08 ± 0.02 | 0.11 ± 0.01 | P = .237 |
| HGB (g/L) | 132 ± 2.4 | 130 ± 1.1 | P = .429 |
| ESR (mm/h) | 20 ± 3.4 | 22 ± 1.6 | P = .810 |
| CRP (mg/L) | 23.74 ± 4.22 | 25.10 ± 2.40 | P = .788 |
| PCT (ng/mL) | 0.09 ± 0.01 | 0.12 ± 0.01 | P = .117 |
| D‐Dimer (ug/L) | 0.91 ± 0.11 | 1.11 ± 0.08 | P = .183 |
| ALT (U/L) | 19 ± 1.9 | 23 ± 1.7 | P = .321 |
| LDH (U/L) | 297 ± 22.6 | 291 ± 13.9 | P = .826 |
| CK (U/L) | 140 ± 3.2 | 146 ± 1.8 | P = .220 |
| PH | 7.40 ± 0.01 | 7.41 ± 0.01 | P = .092 |
| PO2 (mm Hg) | 88.0 ± 4.2 | 91.8 ± 2.4 | P = .434 |
| PCO2 (mm Hg) | 49.6 ± 2.1 | 47.3 ± 0.8 | P = .228 |
| SpO2 (%) | 94.2 ± 0.9 | 94.2 ± 0.8 | P = .998 |
| PAP (mm Hg) | 34 ± 2.5 | 42 ± 1.2 | P = .011 |
| GOLD class (n, groups I, II, III, IV) | 9/11/23/22 | 12/39/89/59 | χ2 = 0.251, P = .616 |
| FEV1 (L) | 1.2 ± 0.1 | 1.0 ± 0.1 | P = .096 |
| FEV1 (% pred) | 42.0 ± 4.1 | 40.8 ± 2.3 | P = .784 |
| FEV1/FVC (%) | 52.2 ± 3.7 | 49.6 ± 2.3 | P = .542 |
| Length of stay (d) | 11 ± 0.5 | 13 ± 0.3 | P = .032 |
| Use of antibiotics (d) | 10 ± 0.5 | 12 ± 0.3 | P = .006 |
| Virus infection (%) | 8(12.31) | 64(32.16) | χ2 = 9.736, P = .001 |
| Deaths (%) | 2(3.08) | 4(2.01) | χ2 = 0.251, P = .616 |
Notes: P < .05 is considered statistical significant; Data are presented as number (%) or mean ± SD; t test and chi‐square test are adopted.
Abbreviations: AECOPD, acute exacerbation of chronic obstructive; NEUT, neutrophil count; LY, lymphocyte count; EOS, eosinophil count; HGB, hemoglobin concentration; ESR, erythrocyte sedimentation rate; CRP, C‐reactive protein; PCT, procalcitonin; ALT, alanine aminotransferase; LDH, lactate dehydrogenase; CK, creatine kinase; PAP, pulmonary artery pressure; GOLD, global Initiative for chronic obstructive lung disease; FEV1, forced expiratory volume in one second; FVC, forced vital capacity.
Table 3.
Comparison of clinical data between AECOPD virus+ patients with and without pneumonia
| Parameter | AECOPD virus+ with pneumonia (n = 41) | AECOPD virus+ without pneumonia (n = 31) | χ2 value and P value |
|---|---|---|---|
| Age (years) | 77 ± 1.1 | 74 ± 1.4 | P = .116 |
| Smoker (%) | 23(56.10) | 11(35.48) | χ2 = 3.010, P = .083 |
| T≤37.3°C | 28(68.29) | 30(96.77) | χ2 = 9.142, P = .002 |
| T>37.3°C | 13(31.71) | 1(3.23) | |
| WBC (>10 × 10^9/L) | 8(19.51) | 6(19.35) | χ2 = 0.369, P = .544 |
| WBC (≤10 × 10^9/L) | 23(80.49) | 25(80.65) | |
| WBC (<4 × 10^9/L) | 11(26.83) | 11(35.48) | χ2 = 0.623, P = .430 |
| WBC (≥4 × 10^9/L) | 30(73.17) | 20(64.52) | |
| NEUT (10^9/L) | 6.40 ± 0.65 | 5.39 ± 0.51 | P = .246 |
| LY (10^9/L) | 1.14 ± 0.11 | 1.08 ± 0.09 | P = .644 |
| EOS (10^9/L) | 0.10 ± 0.02 | 0.07 ± 0.02 | P = .437 |
| HGB (g/L) | 129 ± 2.8 | 131 ± 2.2 | P = .490 |
| ESR (mm/h) | 29 ± 3.7 | 19 ± 2.7 | P = .044 |
| CRP (mg/L) | 30.82 ± 5.65 | 24.47 ± 5.95 | P = .141 |
| PCT (ng/mL) | 0.14 ± 0.05 | 0.08 ± 0.04 | P = .400 |
| D‐Dimer (ug/L) | 1.30 ± 0.27 | 0.70 ± 1.12 | P = .070 |
| ALT (U/L) | 20 ± 1.9 | 20 ± 1.7 | P = .746 |
| LDH (U/L) | 331 ± 33.8 | 311 ± 25.6 | P = .143 |
| CK (U/L) | 149 ± 8.8 | 143 ± 12.4 | P = .715 |
| PH | 7.42 ± 0.01 | 7.41 ± 0.02 | P = .113 |
| PO2 (mm Hg) | 85.9 ± 5.8 | 89.9 ± 4.7 | P = .613 |
| PCO2 (mm Hg) | 47.5 ± 2.8 | 46.1 ± 3.4 | P = .758 |
| SpO2 (%) | 95.1 ± 0.5 | 92.7 ± 3.3 | P =0.393 |
| PAP (mm Hg) | 37 ± 3.5 | 41 ± 3.6 | P = .388 |
| GOLD class (n, groups I, II, III, IV) | 1/9/20/11 | 2/7/12/10 | χ2 = 1.266, P = .737 |
| FEV1(L) | 0.9 ± 0.1 | 1.0 ± 0.1 | P = .316 |
| FEV1 (% pred) | 37.1 ± 3.5 | 41.8 ± 5.1 | P = .440 |
| FEV1/FVC (%) | 45.3 ± 3.9 | 48.5 ± 7.9 | P = .705 |
| Length of stay (d) | 13 ± 0.7 | 11 ± 0.7 | P = .047 |
| Use of antibiotics (d) | 13 ± 0.7 | 10 ± 0.5 | P = .006 |
| Deaths (%) | 2(4.88) | 1(3.23) | χ2 = 0.121, P = .728 |
Notes: P < .05 is considered statistical significant; Data are presented as number (%) or mean ± SD; t test and chi‐square test are adopted.
Abbreviations: AECOPD, acute exacerbation of chronic obstructive; NEUT, neutrophil count; LY, lymphocyte count; EOS, eosinophil count; HGB, hemoglobin concentration; ESR, erythrocyte sedimentation rate; CRP, C‐reactive protein; PCT, procalcitonin; ALT, alanine aminotransferase; LDH, lactate dehydrogenase; CK, creatine kinase; PAP, pulmonary artery pressure; GOLD, global Initiative for chronic obstructive lung disease; FEV1, forced expiratory volume in one second; FVC, forced vital capacity.
3.4. Detection of serum cytokines
Serum samples were collected from AECOPD virus+ patients (n = 44), AECOPD virus− patients (n = 44), stable COPD patients (n = 31) and healthy volunteers (n = 31), respectively. Considering that the serum samples of AECOPD virus− patients available in the pool were far more than those of the AECOPD virus+ patients and to keep the samples from the two groups in close collection years, we selected a serum sample size equal to that of the AECOPD virus+ patients for the negative control. Comparison of concentrations of eight cytokines (IFN‐γ, IL‐17A, IL‐1α, IL‐1β, IL‐4, IL‐6, IP‐10 and TNF‐α) among the four groups indicated that the concentrations of IP‐10 and IFN‐γ in the AECOPD virus+ group were significantly increased, which were significantly higher than those of the AECOPD virus− group, stable COPD group and healthy control group (all P < .0001 for IP‐10 and all P < .05 for IFN‐γ); while no significant difference was observed in the remaining cytokines (all P > .05, Table 4). Moreover, we also assessed the correlation between IP‐10 concentration and FEV1% predicted value, which showed that the concentration of IP‐10 in either AECOPD virus+ group or the AECOPD virus− group was not correlated with FEV1% predicted value (both P > .05, Figure 4A and B).
Table 4.
Comparison of serum biomarkers among AECOPD virus+ group, AECOPD virus− group, stable COPD group and Controls group
| AECOPD virus+(n = 44) | AECOPD virus−(n = 44) | stable COPD (n = 31) | Controls (n = 31) | AECOPD virus+ versus AECOPD virus‐ | AECOPD virus+ versus stable COPD | AECOPD virus+ versus controls | AECOPD virus− versus stable COPD | AECOPD virus− versus controls | Stable COPD versus controls | |
|---|---|---|---|---|---|---|---|---|---|---|
| IFN‐γ | 6.89 | 4.09 | 3.62 | 3.29 | 0.020 | 0.005 | 0.005 | n.s. | n.s. | n.s. |
| (13.33) | (6.29) | (4.78) | (2.85) | |||||||
| IL‐17A | 1.88 | 2.08 | 2.22 | 1.77 | n.s. | n.s. | n.s. | n.s. | n.s. | n.s. |
| (4.68) | (2.67) | (1.21) | (2.09) | |||||||
| IL‐1α | 0.31 | 0.40 | 0.27 | 0.30 | n.s. | n.s. | n.s. | n.s. | n.s. | n.s. |
| (0.72) | (0.84) | (0.59) | (0.62) | |||||||
| IL‐1β | 0.87 | 0.85 | 0.73 | 0.99 | n.s. | n.s. | n.s. | n.s. | n.s. | n.s. |
| (0.47) | (0.46) | (0.39) | (0.44) | |||||||
| IL‐4 | 0.38 | 0.36 | 0.44 | 0.48 | n.s. | n.s. | n.s. | n.s. | n.s. | n.s. |
| (1.35) | (0.95) | (1.07) | (1.08) | |||||||
| IL‐6 | 1.87 | 2.20 | 1.76 | 1.22 | n.s. | n.s. | n.s. | n.s. | n.s. | n.s. |
| (2.39) | (3.46) | (1.32) | (1.25) | |||||||
| IP‐10 | 629.0 | 331.3 | 319.0 | 274.3 | <0.0001 | <0.0001 | <0.0001 | n.s. | n.s. | n.s. |
| (365.5) | (242.9) | (120.1) | (136.2) | |||||||
| TNF‐α | 10.92 | 9.76 | 8.90 | 8.90 | n.s. | n.s. | n.s. | n.s. | n.s. | n.s. |
| (2.98) | (10.54) | (6.40) | (6.66) |
Notes: P < .05 is considered statistical significant, n.s. is considered no statistical significant; Data are presented as median (interquartile rank); Man‐Whitney test are adopted.
Abbreviations: AECOPD, acute exacerbation of chronic obstructive pulmonary disease; IFNγ, interferonγ; IL‐17A, interleukin17A; IL‐1α, interleukin‐1α; IL‐1β, interleukin‐1β; IL‐4, interleukin‐4; IL‐6, interleukin‐6; IP‐10, interferon‐inducible protein‐10; TNF‐α, tumor necrosis factor.
Figure 4.

Correlations between IP‐10 concentrations and FEV1% predicted values in the AECOPD virus+ group (A) and AECOPD virus− group (B). Abbreviations: IP‐10, interferon‐γ inducible protein 10; FEV1, forced expiratory volume in one second; AECOPD, acute exacerbation of chronic obstructive pulmonary disease
Note: P < .05 indicates statistical significance in the Spearman correlation test
4. DISCUSSIONS
Currently, COPD has become a growing epidemic throughout the world. The upper respiratory tract virus infection leads to a more severe acute exacerbation of COPD and a relatively longer recovery time. Exacerbations are associated with increased airway inflammation.19 Therefore, it is extremely important to detect the respiratory viruses and screen the biomarkers in AECOPD patients with viral infections.
In this study, the positive viral detection rate of 264 AECOPD patients in Shanghai was 27.3% (72/264), which was obviously lower than the study results by Dai et al,20 De et al,21 Dimopoulos et al,22 Biancardi et al23 and Rohde et al,24 but obviously higher than the study results by Ko et al,25 Chang et al26 and Koul et al.27 This variation might be associated with the comprehensive factors such as geography, season, prevalence of pathogen, economic status, the regional influence of vaccinations and so on.28 The major infection causative viruses were FluA, HRV and FluB in this study. Flu (FluA and FluB) was highly detected virus. Our results were consistent with the study results by Koul et al,27 Tan et al29 and Biancardi et al,23 but inconsistent with the study results by Hosseini et al,30 Dimopoulos et al,22 Kherad et al8 and Greenberg et al.31 The characteristics of Flu frequently occurred in the temperate zones, especially in East Asia,32 which might be another reason for the prevalence of H7N9 virus infection in China.33 HRV prevalence was followed by Flu, which was inconsistent with the study results by Wilkinson et al,34 Djamin et al35 and Varkey et al36 in Euro‐American region. In Euro‐American region, HRV was the primary infective virus in patients with AECOPD, but HRV lacked an effective vaccination and hence was higher in Euro‐American region than that in other Asian regions. Other viruses such as HADV, RSVA and HCoV were detected in low rates, at 1.5%, 1.5% and 1.21%, respectively. This was inconsistent with some study results, for example Hosseini et al30 found that HADV was highly detected virus at a rate of 9.4%. Similarly, Dimopoulos et al22 found RSV at a rate of 28.5% and Greenberg et al31 found HCoV at a rate of 4.9%. The high prevalence rates of these viruses might be related to some factors such as the sampling period, test method, patients age, and so on.22, 30 HBoV and HMPV were poorly detected. But according to the results of Hosseini et al30 and Ringshausen et al,37 HBoV showed a relatively high detection rate. Martinello et al38 and Perotin et al39 showed that HMPV was the second most common virus detected. The two respiratory viruses were discovered recently and the dilemma still existed as to whether these were related to COPD exacerbations. Because of these differences in their detection rates, further research was still warranted for more definitive conclusions.
Dual viral infection rates were very low in our study, mainly with the combinations of FluA + FluB and RSVA + HRV. While Hosseini et al,30 Mcmanus et al,40 Malekshahi et al32 found that dual viral infection rates were high, mainly with the combination of RSV, HADV, HRV and enterovirus (EV). In this study, FluA + FluB were observed to be a new and uncommon viral co‐infection, which may in turn lead to the co‐circulation in COPD crowd. We also found that the frequency of viral infection remained highest in the winter season and this was consistent with the study results by Zwaans et al41 and Dimopoulos et al.22 Seasonal distribution of influenza virus in patients with AECOPD was comparable to that in adults at the same time in Shanghai.14
Clinical manifestations of AECOPD virus+ patients lacked specificity in this study, and this was consistent with the study results by Chang et al.42 But Dimopoulos et al22 found that the length of hospital stay in virus+ AECOPD patients was significantly higher than that in the virus− AECOPD, and this indicated that it might be difficult to differentiate viral infections from nonviral infections based solely on clinical data. In addition, this study also found that older patients were significantly higher than nonelderly patients with viral infections, which was not in accordance with the study results of Dimopoulos et al.5 It might be associated with regional differences, poor physical state, long COPD course, susceptibility of secondary bacterial infections, long recovery duration, and so on.
Our study also found that respiratory viruses showed a significant increase in the serum IP‐10 and IFN‐γ levels. This was consistent with the IP‐10 study results by Almansa et al,13 but slight differences were observed by Quint et al12 study. Quint et al found that IP‐10 was the only effective biomarker for HRV‐related AECOPD, while AECOPD virus+ group in our study contained seven other types of respiratory viruses in addition to HRV. Whether or not these seven types of respiratory viruses affected the significant increase of IP‐10 concentration was worth for further investigation. These results showed obvious differences with the IFN‐γ results in Almansa et al43 study. This study also demonstrated that the respiratory viruses cannot cause a significant rise in the IFN‐γ levels, which might be associated with differences in sample size. Therefore, both two biomarkers might provide certain reference values in the indication of viral infection.
This study had some limitations. First, because of the high sensitivity of quantitative PCR techniques, respiratory viruses were also found in the patients with stable COPD.44 Although it cannot be ruled out that virus particles remained in the respiratory tract from a previous exacerbation, the patients were still in stable disease condition. This might be a subject of future longitudinal studies. Second, as the study did not include sputum culture for common bacteria, we cannot completely separate the virus from bacteria. Thus, there were some samples with mixed viral‐bacterial co‐infection, which in turn might influence the comparison of clinical data and serum biomarkers.
In conclusion, the nucleic acid detection of respiratory viruses showed a higher viral detection rate in AECOPD patients in Shanghai than those in other provinces of China, such as Hong Kong and Taiwan.25, 26 The most common viruses included FluA, HRV and FluB. AECOPD patients who were positive for virus lacked typical clinical characteristics. The increases of serum IP‐10 and IFN‐γ levels might act as potential and valuable biomarkers for the diagnosis of AECOPD. These findings improved the awareness regarding the importance of viral infection during AECOPD.
CONFLICT OF INTEREST
The authors have stated explicitly that there are no conflicts of interest in connection with this article.
Supporting information
Additional Supporting Information may be found online in the supporting information tab for this article.
Table S1 The primers and probes for detecting respiratory viruses
ACKNOWLEDGMENTS
This work was supported by the grants from Science and Technology Commission of Shanghai Natural Fund (134119b1200), Training Plan of Outstanding academic leader of health system in Shanghai (No. XBR2013078), Key Department of Shanghai Fifth Peopleˊs Hospital (2017WYZDZK07). The funders had no role in study design, data collection or analysis, decision to publish or preparation and revision of the manuscript.
AUTHOR CONTRIBUTIONS
Conceived and designed the experiments: ZJJ, YWH.
Performed the experiments: TPY.
Analyzed the data: TPY, ZQZ, ZFM.
Contributed reagents/ materials/analysis tools: TPY, ZQZ, ZFM, JJF, WJZ, YCH, JDS, LQ, YL, QHH.
Wrote the first draft of the manuscript: TPY.
Contributed to the writing of the manuscript: TPY, ZQZ.
ICMJE criteria for authorship read and met: ZJJ, TPY, ZQZ, ZFM, JJF, WJZ, YCH, JDS, LQ, YL, QHH, YWH.
Agree with manuscript results and conclusions: ZJJ, TPY, ZQZ, ZFM, JJF, WJZ, YCH, JDS, LQ, YL, QHH, YWH.
ETHICS
Ethics approval was obtained from Clinical Research Ethics Committee of the Fifth Hospital of Shanghai, Fudan University. The ethics approval will be supplied with this proof.
Yin T, Zhu Z, Mei Z, et al. Analysis of viral infection and biomarkers in patients with acute exacerbation of chronic obstructive pulmonary disease. Clin Respir J. 2018;12:1228–1239. 10.1111/crj.12656
Funding information Science and Technology Commission of Shanghai Natural Fund, Grant/Award Number: 134119b1200; Training Plan of Outstanding academic leader of health system in Shanghai, Grant/Award Number: XBR2013078; Key Department of Shanghai Fifth Peopleˊs Hospital, Grant/Award Number: 2017WYZDZK07
Contributor Information
Yunwen Hu, Email: ywhu0117@126.com.
Zhijun Jie, Email: jiezjlxh@163.com.
REFERENCES
- 1. Garvey C. Recent updates in chronic obstructive pulmonary disease. Postgrad Med. 2016;128(2):231–238. [DOI] [PubMed] [Google Scholar]
- 2. Wedzicha JA, Brill SE, Allinson JP, et al. Mechanisms and impact of the frequent exacerbator phenotype in chronic obstructive pulmonary disease. BMC Med. 2013;11(1):181–190. [DOI] [PMC free article] [PubMed] [Google Scholar]
- 3. Singh M, Lee SH, Porter P, et al. Human rhinovirus proteinase 2A induces Th1 and Th2 immunity in COPD. J Allergy Clin Immunol. 2010;125(6):1369–1378. [DOI] [PMC free article] [PubMed] [Google Scholar]
- 4. Almagro P, Hernandez C, Martinezcambor P, et al. Seasonality, ambient temperatures and hospitalizations for acute exacerbation of COPD: a population‐based study in a metropolitan area. Int J Chron Obstruct Pulmon Dis. 2015;10(1):899–908. [DOI] [PMC free article] [PubMed] [Google Scholar]
- 5. Hudy MH, Traves SL, Proud D. Transcriptional and epigenetic modulation of human rhinovirus‐induced CXCL10 production by cigarette smoke. Am J Resp Cell Mol. 2014;50(3):571–582. [DOI] [PubMed] [Google Scholar]
- 6. Kwak HJ, Park DW, Kim JE, et al. Prevalence and risk factors of respiratory viral infections in exacerbations of chronic obstructive pulmonary disease. Tohoku J Exp Med. 2016;240(2):131–139. [DOI] [PubMed] [Google Scholar]
- 7. Shih HI, Wang HC, Su IJ, et al. Viral respiratory tract infections in adult patients attending outpatient and emergency departments, Taiwan, 2012–2013: a PCR/electrospray ionization mass spectrometry study. Medicine. 2015;94(38):e1545. [DOI] [PMC free article] [PubMed] [Google Scholar]
- 8. Kherad O, Kaiser L, Bridevaux PO, et al. Upper‐respiratory viral infection, biomarkers, and COPD exacerbations. Chest. 2010;138(4):896–904. [DOI] [PMC free article] [PubMed] [Google Scholar]
- 9. Matsumoto K, Inoue H. Viral infections in asthma and COPD. Respir Investig. 2014;52(2):92–100. [DOI] [PubMed] [Google Scholar]
- 10. Kurai D, Saraya T, Ishii H, et al. Virus‐induced exacerbations in asthma and COPD. Front Microbiol. 2013;4(1):293–304. [DOI] [PMC free article] [PubMed] [Google Scholar]
- 11. Piper SC, Ferguson J, Kay L, et al. The role of interleukin‐1 and interleukin‐18 in pro‐inflammatory and anti‐viral responses to rhinovirus in primary bronchial epithelial cells. Plos One. 2013;8(5):e63365. [DOI] [PMC free article] [PubMed] [Google Scholar]
- 12. Quint JK, Donaldson GC, Goldring JJ, et al. Serum IP‐10 as a biomarker of human rhinovirus infection at exacerbation of COPD. Chest. 2009;137(4):812–822. [DOI] [PMC free article] [PubMed] [Google Scholar]
- 13. Almansa R, Sanchez‐Garcia M, Herrero A, et al. Host response cytokine signatures in viral and nonviral acute exacerbations of chronic obstructive pulmonary disease. J Interf Cytok Res. 2011;31(31):409–413. [DOI] [PubMed] [Google Scholar]
- 14. Singanayagam A, Glanville N, Walton RP, et al. A short‐term mouse model that reproduces the immunopathological features of rhinovirus‐induced exacerbation of COPD. Clin Sci. 2015;129(Pt 3):245–258. [DOI] [PMC free article] [PubMed] [Google Scholar]
- 15. Zhang XL, He J, Song ZG, et al. Epidemic and molecular characteristics of enterovirus in acute respiratory tract infection patients in Shanghai, China, 2009–2011. J Microbes Infect. 2015;10(6):351–358. [Google Scholar]
- 16. Xia YL, Zhang WJ, Tian D, et al. Antigenic analysis of the human influenza A (H3N2) virus during 2012–2015 in Shanghai, China. Chin J Exp Clin Virol. 2016;30(02):133–137. [Google Scholar]
- 17. Dimopoulos G, Tsiodras S, Lerikou M, et al. Viral profile of COPD exacerbations according to patients. Open Respir Med J. 2015;9(1):1–8. [DOI] [PMC free article] [PubMed] [Google Scholar]
- 18. MandellL A, Wunderink RG, Anzueto A, et al. Infectious diseases society of America/American thoracic society consensus guidelines on the management of community‐acquired pneumonia in adults. Clin Infect Dis. 2007;44(suppl 2):S27–S72. [DOI] [PMC free article] [PubMed] [Google Scholar]
- 19. Triantafilou K, Kar S, van Kuppeveld FJ, et al. Rhinovirus‐induced calcium flux triggers NLRP3 and NLRC5 activation in bronchial cells. Am J Resp Cell Mol. 2013;49(6):923–934. [DOI] [PubMed] [Google Scholar]
- 20. Dai MY, Qiao JP, Xu YH, et al. Respiratory infectious phenotypes in acute exacerbation of COPD: an aid to length of stay and COPD Assessment Test. Int J Chron Obstruct. 2015;10(1):2257–2263. [DOI] [PMC free article] [PubMed] [Google Scholar]
- 21. De SG, Lampron N, La FJ, et al. Importance of viral and bacterial infections in chronic obstructive pulmonary disease exacerbations. J Clin Virol. 2009;46(2):129–133. [DOI] [PMC free article] [PubMed] [Google Scholar]
- 22. Dimopoulos G, Lerikou M, Tsiodras S, et al. Viral epidemiology of acute exacerbations of chronic obstructive pulmonary disease. Pulm Pharmacol Ther. 2012;25(1):12–18. [DOI] [PMC free article] [PubMed] [Google Scholar]
- 23. Biancardi E, Fennell M, Rawlinson W, et al. Viruses are frequently present as the infecting agent in acute exacerbations of chronic obstructive pulmonary disease in patients presenting to hospital. Intern Med J. 2016;46(10):1160–1165. [DOI] [PMC free article] [PubMed] [Google Scholar]
- 24. Rohde G, Wiethege A, Borg I, et al. Respiratory viruses in exacerbations of chronic obstructive pulmonary disease requiring hospitalization: a case‐control study. Thorax. 2003;58(1):37–42. [DOI] [PMC free article] [PubMed] [Google Scholar]
- 25. Ko FW, Ip M, Chan PK, et al. A 1‐year prospective study of the infectious etiology in patients hospitalized with acute exacerbations of COPD. Chest. 2007;131(1):44–52. [DOI] [PubMed] [Google Scholar]
- 26. Chang CH, Tsao KC, Hu HC, et al. Procalcitonin and C‐reactive protein cannot differentiate bacterial or viral infection in COPD exacerbation requiring emergency department visits. Int J Chronic Obstr. 2015;10(1):767–774. [DOI] [PMC free article] [PubMed] [Google Scholar]
- 27. Koul PA, Mir H, Akram S, et al. Respiratory viruses in acute exacerbations of chronic obstructive pulmonary disease. Lung India. 2017;34(1):29–33. [DOI] [PMC free article] [PubMed] [Google Scholar]
- 28. Clark TW, Medina MJ, Batham S, et al. C‐reactive protein level and microbial aetiology in patients hospitalised with acute exacerbation of COPD. Eur Respir J. 2015;45(1):76–86. [DOI] [PubMed] [Google Scholar]
- 29. Tan WC, Xiang X, Qiu D, et al. Epidemiology of respiratory viruses in patients hospitalized with near‐fatal asthma, acute exacerbations of asthma, or chronic obstructive pulmonary disease. Am J Med. 2003;115(4):272–277. [DOI] [PubMed] [Google Scholar]
- 30. Hosseini SS, Ghasemian E, Jamaati H, et al. Association between respiratory viruses and exacerbation of COPD: a case‐control study. Infect Dis‐nor. 2015;47(8):523–529. [DOI] [PubMed] [Google Scholar]
- 31. Greenberg SB, Allen M, Wilson J, et al. Respiratory viral infections in adults with and without chronic obstructive pulmonary disease. Pulm Pharmacol Ther. 2000;162(1):167–173. [DOI] [PubMed] [Google Scholar]
- 32. Malekshahi SS, Azad TM, Yavarian J, et al. Molecular detection of respiratory viruses in clinical specimens from children with acute respiratory disease in Iran. Pediatr Infect Dis J. 2010;29(10):931–933. [DOI] [PubMed] [Google Scholar]
- 33. Shi J, Xie J, He Z, et al. A detailed epidemiological and clinical description of 6 human cases of Avian‐origin influenza A (H7N9) virus infection in Shanghai. PLoS One. 2013;8(10):e77651. [DOI] [PMC free article] [PubMed] [Google Scholar]
- 34. Wilkinson TM, Hurst JR, Perera WR, et al. Effect of interactions between lower airway bacterial and rhinoviral infection in exacerbations of COPD. Chest. 2006;129:317–324. [DOI] [PMC free article] [PubMed] [Google Scholar]
- 35. Djamin RS, Uzun S, Snelders E, et al. Occurrence of virus‐induced COPD exacerbations during four seasons. Infect Dis (Lond). 2015;47(2):96–100. [DOI] [PubMed] [Google Scholar]
- 36. Varkey JB, Varkey B. Viral infections in patients with chronic obstructive pulmonary disease. Curr Opin Pulm Med. 2008;14(2):89–94. [DOI] [PubMed] [Google Scholar]
- 37. Ringshausen FC, Tan AYM, Allander T, et al. Frequency and clinical relevance of human bocavirus infection in acute exacerbations of chronic obstructive pulmonary disease. Int J Chron Obstruct Pulmon Dis. 2009;4(1):111–117. [DOI] [PMC free article] [PubMed] [Google Scholar]
- 38. Martinello RA, Esper F, Weibel C, et al. Human metapneumovirus and exacerbations of chronic obstructive pulmonary disease. J Infection. 2006;53(4):248–254. [DOI] [PMC free article] [PubMed] [Google Scholar]
- 39. Perotin JM, Dury S, Renois F, et al. Detection of multiple viral and bacterial infections in acute exacerbation of chronic obstructive pulmonary disease: a pilot prospective study. J Med Virol. 2013;85(5):866–873. [DOI] [PMC free article] [PubMed] [Google Scholar]
- 40. Mcmanus TE, Marley AM, Baxter N, et al. Respiratory viral infection in exacerbations of COPD. Respir Med. 2008;102(11):1575–1580. [DOI] [PMC free article] [PubMed] [Google Scholar]
- 41. Zwaans WA, Mallia P, van Winden ME, et al. The relevance of respiratory viral infections in the exacerbations of chronic obstructive pulmonary disease‐a systematic review. J Clin Virol. 2014;61(2):181–188. [DOI] [PMC free article] [PubMed] [Google Scholar]
- 42. Dai MY, Qiao JP, Xu YH, et al. Respiratory infectious phenotypes in acute exacerbation of COPD: an aid to length of stay and COPD assessment test. Int J Chronic Obstr. 2015;10(1):2257–2263. [DOI] [PMC free article] [PubMed] [Google Scholar]
- 43. Almansa R, Socias L, Andaluz‐Ojeda D, et al. Viral infection is associated with an increased proinflammatory response in chronic obstructive pulmonary disease. Viral Immunol. 2012;25(4):249–253. [DOI] [PubMed] [Google Scholar]
- 44. Gump DW, Phillips CA, Forsyth BR, et al. Role of infection in chronic bronchitis. New Engl J Med. 1975;292(11):563–571. [DOI] [PubMed] [Google Scholar]
Associated Data
This section collects any data citations, data availability statements, or supplementary materials included in this article.
Supplementary Materials
Additional Supporting Information may be found online in the supporting information tab for this article.
Table S1 The primers and probes for detecting respiratory viruses