Abstract
Hypercholesterolaemia is considered an important cause of atherosclerotic cardiovascular disease. In a previous investigation, we demonstrated that cultured hepatoma cells treated with hypercholesterolaemic sera compared with cells treated with normocholesterolaemic sera show overexpression of mRNAs related to mitochondrial 3-hydroxy-3-methylglutaryl-coenzyme A synthase (HMGCS2). In the present work, using an NMR metabolomic analysis, we demonstrate that the hypercholesterolaemic blood sera previously used to treat cultured hepatoma cells are characterized by a metabolomic profile that is significantly different from the normocholesterolaemic sera. Acetate, acetone, 2-hydroxybutyrate, cysteine, valine, and glutamine are the metabolites distinguishing the two groups. Abnormalities in the concentrations of these metabolites reflect alterations in energy-related pathways, such as pantothenate and CoA biosynthesis, pyruvate, glycolysis/gluconeogenesis, the citrate cycle, and ketone bodies. Regarding ketone bodies, the pathway is regulated by HMGCS2; therefore, serum samples previously found to be able to increase HMGCS2 mRNA levels in cultured cells also contain higher amounts of the metabolites of its encoded enzyme protein product.
Introduction
Excessive serum cholesterol concentration is considered an important cause of atherosclerotic cardiovascular disease [1]. Cholesterol is deeply involved in numerous molecular mechanisms leading to vascular damage; therefore, its concentration is widely used as a diagnostic clinical parameter to assess atherosclerotic disease and risk [2]. Most importantly, backgrounds of hypercholesterolemia can be mainly separated between those deriving from lifestyle, with a significant role of the quality and quantity of nutritional intake, and, much less frequently, those deriving from genetic factors [3].
Nevertheless, cholesterol concentration is only one element of a general metabolic condition that includes, but is not limited to, lipidic components. This metabolic change is generally known to be the causal pathogenic mechanism resulting in the high incidence of cardiovascular diseases, which leads to the most important cause of mortality in the developed world [4–6].
To investigate a possible correlation between this general dysmetabolic condition and specific gene regulation, we previously searched for mRNAs that are differentially expressed from cultured hepatoma cells treated with hypercholesterolaemic sera compared with cells treated with normocholesterolaemic sera [4]. Our data indicated that hypercholesterolaemic sera specifically modulate several mRNAs among them, the most relevant being mitochondrial 3-hydroxy-3-methylglutaryl-coenzyme A synthase (HMGCS2). HMGCS2 is an essential enzyme in the biochemical pathway leading to mitochondrial ketone body production and is already reported in the literature to be involved in the development of several chronic pathologies [5–8].
Extending this study, in the present work, we report an NMR metabolomic analysis of the sera previously used to treat hepatoma cultured cells. Metabolomics is the large-scale study of metabolites within cells, biofluids, tissues, or organisms. As such, metabolomics detects systemic fluctuations of multiple metabolite concentrations in response to drugs, diet, lifestyle, environment, stimuli, and genetic modulations. A variety of compounds (charged, neutral, hydrophobic, hydrophilic) are simultaneously, qualitatively, and quantitatively detected in biologic samples using NMR-based metabolomics analysis [9, 10]. As hypercholesterolaemia reflects metabolic disease that includes but is not limited to lipidic components, the determination of the metabolomics profile is appropriate to produce many points of observation on a complex disease characterized by multifactorial and heterogeneous aspects [6]. Our data show concentration abnormalities of metabolites involved in energy related pathways, indicating that the transcriptional regulation of the gene HMGCS2 affects the synthesis of metabolites involved in mitochondrial energy processes. In particular, samples previously found to be able to increase HMGCS2 mRNA levels in cultured cells also contain higher amounts of metabolites of its encoded enzyme protein product.
Materials and methods
Participants
Human serum samples were selected from October 2009 to July 2010 to study serum composition, as previously described [11], from the Clinical Pathology Laboratory, Santa Maria Goretti Hospital, AUSL Latina, Lt, Italy. The study protocol was approved by the institutional ethics committee (Comitato Etico Lazio 2 Azienda Unità Sanitaria Locale Latina), and all subjects gave written informed consent in accordance with the 1964 Helsinki declaration and its later amendments. The normocholesterolaemic group included 16 samples with cholesterolaemia below 170 mg/dl, while the hypercholesterolaemic group included 16 samples with cholesterolaemia above 260 mg/dl. All subjects were healthy males aged between 40 and 50 years. Inclusion criteria included patients presenting abnormal serum cholesterol levels, with no other disease symptoms, and healthy individuals who voluntarily agreed to participate in this study. Exclusion criteria included all subjects presenting any pathological condition or other abnormal serum values, in addition to cholesterol. No access to any identifying participant information was available besides cholesterol concentrations and the absence of other disease symptoms.
NMR sample preparation
NMR sample preparation and NMR spectra acquisition were performed as previously reported [9, 12]. Blood was collected into standard blood collection tubes and allowed to clot at room temperature for 30 to 120 min before centrifugation.
Serum was aliquoted and stored at -80°C in Greiner cryogenic vials before NMR spectrometry measurements. Before being transferred to a 5-mm heavy-walled NMR tube, samples were thawed at room temperature and then spun at 3000 rpm using a Vivaspin® 6 centrifugal concentrator to remove proteic and particulate matter. Serum supernatant was removed, and to prepare NMR samples, 425 μL of each sample was added to 25 μL of 1 M potassium phosphate buffer (pH 7.4) and 50 μL of D2O. Trimethylsilyl propionic-2,2,3,3-d4 acid, sodium salt (TSP-d4 0.1% in D2O) was used as an internal reference for alignment and quantification of NMR signals; the mixture, homogenized by vortexing for 30 s, was transferred to a 5 mm NMR tube (Bruker NMR tubes) before the analysis started [9].
NMR spectroscopy and processing
NMR experiments were carried out on a Bruker DRX600 MHz spectrometer equipped with a 5 mm triple-resonance z-gradient CryoProbe. TOPSPIN, version 3.0, was used for spectrometer control and data processing (Bruker Biospin). 1D NOESY experiments [13, 14] were acquired using spectra with 14 ppm, 16 k data points, excitation sculpting for water suppression, 192 transients, 4 s relaxation delay, and 60 ms mixing time. The pulse sequence used included an excitation sculpting routine for the suppression of the water signal [15]. Due to the effect of excitation sculpting on the signal height of resonances in the region close to the water resonance [16, 17], the metabolites that have resonances close to this region (ascorbate, glucose, mannose, and pyroglutamate) were quantified using resonances from those metabolites in other spectral regions. A weighted Fourier transform was applied to the time domain data with a 0.5 Hz line-broadening followed by manual phase and baseline correction in preparation for targeted profiling analysis.
NMR data analysis
NMR spectra were manually phased and baseline corrected. Quantification of serum metabolites was achieved using Chenomx NMR-Suite v8.0 (Chenomx Inc.). Briefly, the Chenomx profiler is linked to the human metabolome database (HMDB) containing more than 250 metabolite NMR spectral signatures encoded at different spectrometer 1H frequencies, including 600 MHz (http://www.hmdb.ca). A comparison of the spectral data obtained for each serum sample with the Chenomx metabolite library results in a list of compounds together with their respective concentrations based on the known concentration of the added internal reference compound, TSP-d4.
We submitted our data to the MetaboLights database with ID code MTBLS1416 [18].
Statistical analysis
Multivariate statistical analysis, principal component analysis (PCA) and partial least-squares discriminant analysis (PLS-DA) were conducted with normalized metabolomics data using MetaboAnalyst 4.0 (http://www.metaboanalyst.ca/) [19]. The performance of the PCA and PLS-DA model was evaluated using the coefficient Q2 (using the 7-fold internal cross-validation method) and the coefficient R2, defining the variance predicted and explained by the model, respectively. The loading plot was used to identify significant metabolites responsible for maximum separation in the PLS-DA score plot, and these metabolites were ranked according to their variable influence on projection (VIP) scores. VIP scores are weighted sums of squares of the PLS-DA weights, which indicate the importance of the variable.
Results
Multivariate data analysis
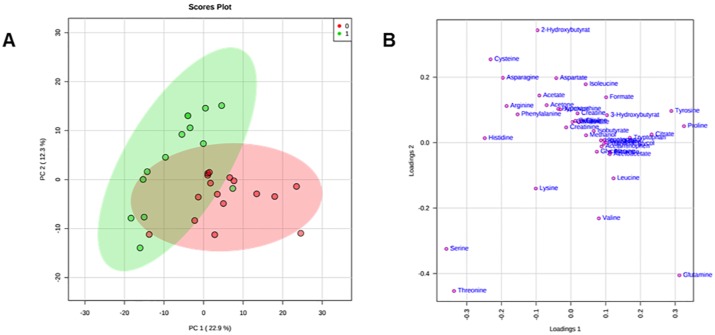
Matrices, including metabolites and their concentrations as derived from 1H NMR data collected in 1D NOESY [13, 14], were analysed according to multivariate statistical analysis using MetaboAnalyst 4.0 [19]. Original matrices, including 16 normocholesterolaemic sera and 16 hypercholesterolaemic sera, were normalised according to the concentration ranges of the human metabolome database; as a result, the data of 2 hypercholesterolaemic sera were identified as outliers and excluded [20]. The data matrix, after normalization by sum and Pareto scaling, was analysed by PCA (S1 and S2 Figs). To minimize false discoveries and to obtain robust statistical models, T-test and fold change tests were applied according to good standardized practice (S1 and S2 Tables, S3 and S4 Figs) [19]. For each sample, 41 metabolites were identified and quantified. In Fig 1, PCA shows that the datasets relative to hypercholesterolaemic sera are well separated from those of normocholesterolaemic sera. The first component explains 22.9% of the variance, while the second explains 12.3% (S3 Table).
Fig 1. PCA score scatter plot (A) and PCA loading scatter plot (B) for the 1H NMR data collected in 1D NOESY spectra acquired at 600 MHz.
Data are relative to 14 hypercholesterolaemic (green circles) and 16 normocholesterolaemic (red circles) human sera.
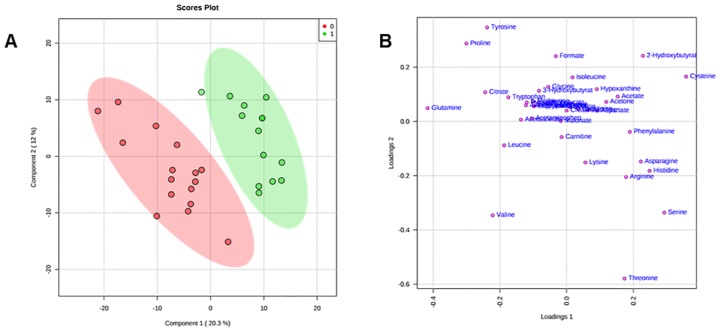
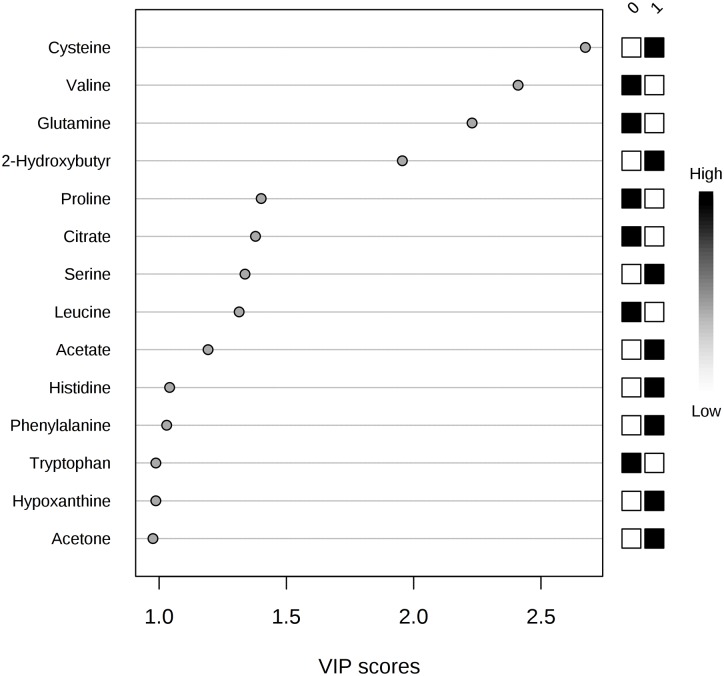
To improve the separation observed with the PCA model, supervised PLS-DA was applied: the fitting (R2Y) value was 95.5%, and the predictive (Q2Y) value was 68.7% (S4 Table, S5 Fig). Inspection of the PLS-DA score scatter plot (Fig 2A) and loading scatter plot (Fig 2B) point to 2-hydroxybutyrate, citrate, and acetate as metabolites that significantly discriminate hypercholesterolaemic sera from normocholesterolaemic sera; significant differences in concentration can also be observed for acetone, cysteine, and proline. This evidence is confirmed by applying VIP score analysis (Fig 3, S5 Table). Accordingly, the metabolites characterized by a VIP score higher than 1 are considered good classifiers between the hypercholesterolaemic and normocholesterolaemic groups. In particular, the graph reported in Fig 3 shows that hypercholesterolaemic sera contain higher concentrations of acetate, cysteine, acetone, and 2-hydroxybutyrate and lower concentrations of citrate, glutamine, valine, proline, leucine, and tryptophan than normocholesterolaemic sera. To gain meaningful insight from these data, we applied metabolic pathway analysis using MetaboAnalyst 4.0.
Fig 2. PLS-DA score scatter plot (A) and PLS-DA loading scatter plot (B) for the 1H NMR data collected in 1D NOESY spectra acquired at 600 MHz.
Data represent 14 hypercholesterolaemic (green circles) and 16 normocholesterolaemic (red circles) human sera.
Fig 3. Metabolites discriminating hypercholesterolaemic from normocholesterolaemic samples, according to VIP score values.
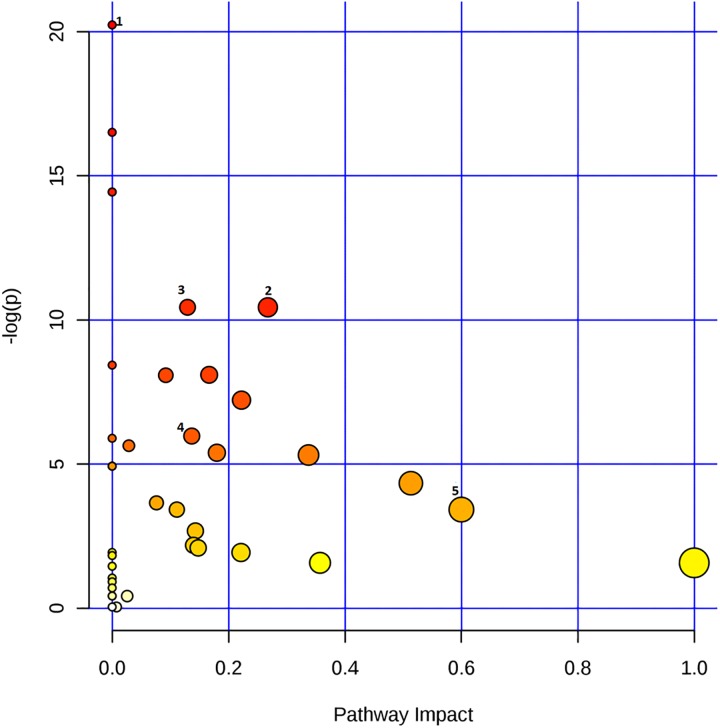
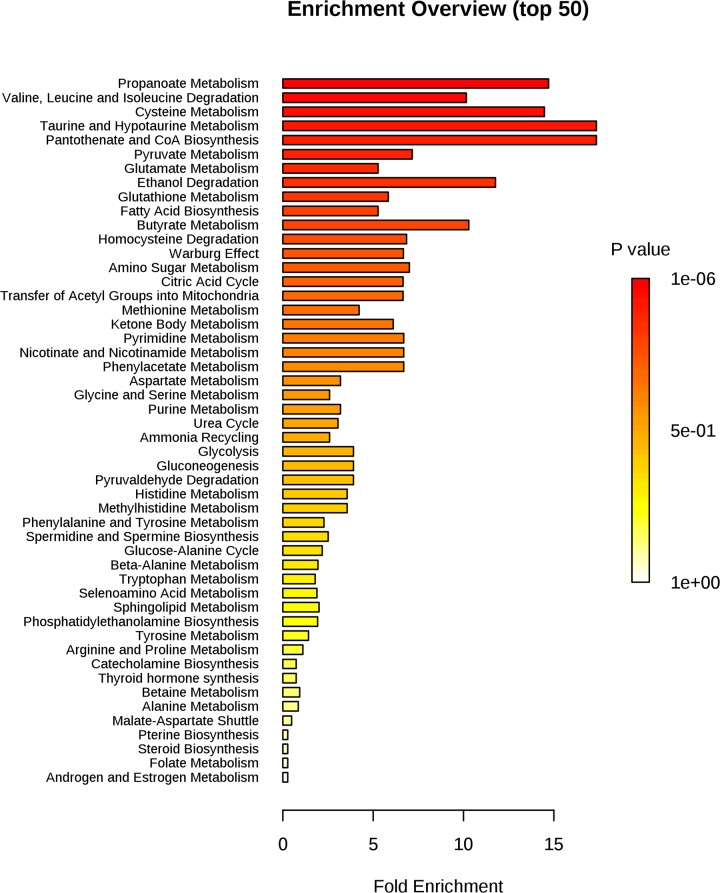
The graph reported in Fig 4 indicates all matched pathways according to p-values from pathway enrichment analysis (Fig 5) and according to pathway impact values from pathway topology analysis (S6a–S6e Fig). The pathways were classified according to the total number of compounds found in the KEGG database [21]. Specifically, the metabolic pathways are represented as circles according to their scores from enrichment (p-values in the vertical axis) and topology analyses (pathway impact, horizontal axis). Darker circle colours indicate the most significant changes in metabolites in the corresponding pathway. The size of the circle corresponds to the pathway impact score and is correlated with the number of metabolites involved (number of hits). By combining pathways characterized by hits >1 and p-values <1e-6 (S6 Table), we observed the following top 5 pathways as the most perturbed in our analysis: 1) pantothenate and CoA biosynthesis, 2) pyruvate metabolism, 3) glycolysis/gluconeogenesis, 4) citrate cycle (TCA cycle), and 5) synthesis and degradation of ketone bodies (S6 Fig). The deepening of these results using Reactome analysis [22] indicates that pathways related to mitochondrial dysmetabolism and, in particular, pathways related to the synthesis and metabolism of ketone bodies (p-value 0.001) are those most related to the reported metabolic abnormalities. Interestingly, both metabolic pathway analysis and Reactome analysis support the evidence of a relationship between HMGCS2 mRNA overexpression in the hypercholesterolaemic sera and the metabolomic profile characterized by increased levels of acetate and 2-hydroxybutyrate, which are indeed ketone body metabolites.
Fig 4. Graph of pathway impact and relative p-value.
Pathway analysis showing all matched pathways according to p-values from pathway enrichment analysis (y-axis) and pathway impact values from pathway topology analysis (x-axis). The colour and size of each circle are based on p-values and pathway impact values, respectively. Small p-values and large pathway impact circles indicate that the pathway is greatly perturbed. The top 5 pathways in order of p-values from the pathway analysis are numbered as follows: 1) pantothenate and CoA biosynthesis, 2) pyruvate metabolism, 3) glycolysis/ gluconeogenesis, 4) citrate cycle (TCA cycle) and 5) synthesis and degradation of ketone bodies.
Fig 5. Pathway enrichment analysis: The pathways related to a p-value that excludes randomness and correlates with hypercholesterolaemia.
Discussion
Analysis of serum components is a traditional source of reference parameters that allows for obtaining relevant diagnostic and prognostic information on numerous diseases. Additionally, the importance of serum composition comes from the fact that it is determined both from endogenous metabolism and from the nutritional intake. Serum components also actively participate in most physiological and pathological mechanisms.
Considering the possibility that serum molecules, including diet-derived nutrients, directly affect pathogenic mechanisms, we previously searched for genes selectively regulated in human hepatoma cells by treatment with dyslipidaemic sera [4]. In these experiments, we found that in response to high cholesterol concentrations, the expression of the HMGCS2 gene was significantly increased [4]. We also observed overexpression of HMGCS2 mRNA [6] in the liver of rats receiving a diet containing only saturated fats [23]. Extending previous works using an NMR-based metabolomics approach, we investigated the hypothesis of a possible correlation between the previously described transcriptomic signature of hepatoma cell lines treated with hypercholesterolaemic sera and the metabolomic signatures of the same sera [4]. In particular, we investigated the hypothesis that the increase in HMGCS2 mRNA levels [6] could affect the activity of its protein product. As a result, our metabolomics data revealed that the hypercholesterolaemic blood sera show a metabolomic profile that is significantly different from that of the normocholesterolaemic sera, where acetate, acetone, 2-hydroxybutyrate, cysteine, valine, and glutamine are the metabolites discriminating the two groups.
The concentrations of 2-hydroxybutyrate are higher in patients with hypercholesterolaemia than in normocholesterolaemic patients.
Dysmetabolism of 2-hydroxybutyrate reflects dysmetabolism of the propanoate pathway. This pathway is one of the most significant pathways identified by the enrichment analysis (Figs 4 and 5), together with the citrate cycle pathway. The propanoate and citrate cycle pathways are both energy-related pathways, and in particular, propanoate is involved in the regulation of the citrate cycle pathway [24].
The concentrations of acetone and acetate are higher in the sera of patients with hypercholesterolaemia. These metabolites are part of the ketone body pathways. Analysis conducted by Reactome confirms the relevance of this pathway in the dysmetabolic framework of subjects with hypercholesterolaemia. Interestingly, this pathway is regulated by HMGCS2, the enzyme whose mRNA we found to be overexpressed in the same hypercholesterolaemia blood sera.
Therefore, our present data support the hypothesis that serum samples previously found to be able to increase HMGCS2 mRNA levels in cultured cells also contain higher amounts of metabolites of its encoded enzyme protein product. The intrinsic enzymatic activity of HMGCS2, which is important within the metabolic pathway to produce ketone bodies, could then be part of the pathogenic mechanisms. These data confirm numerous pieces of evidence from the literature, indicating an important role of HMGCS2 in pathogenic mechanisms. Inhibition of HMGCS2 expression was reported to reduce endothelial damage in a diabetes mellitus model [5]. HMGCS2 deficiencies due to inborn errors of metabolism were associated with dyslipidaemia [7], while HMGCS2 activity was considered to potentially be involved in high cardiovascular risk [8]. Other evidence indicates that the HMGCS2 protein product is a PPARα target [25, 26] since it interacts with PPARα and up-regulates transcription of its gene [27]. HMGCS2 may be a PPARα co-activator [28], while modulating its expression in the cultured HepG2 cell line has complex metabolic effects [29]. Taken together, these data strongly indicate that HMGCS2 expression might have a relevant role within the pathological metabolic condition, which is consequent to inappropriate nutrition and configures an increased cardiovascular risk. The excessive activity of this enzyme could be a consequence of the effect of nutrients and endogenous metabolites acting at the gene regulation level.
Metabolomic analysis indicated increased concentrations of some amino acids, such as cysteine, serine, histidine, and phenylalanine. Previous scientific studies have shown a fundamental role of histidine in the induction of hypercholesterolaemia [24, 30]. Similarly, elevated cysteine levels appear to be related to cardiovascular diseases [31]. Conversely, tryptophan, and leucine have lower concentrations in subjects with hypercholesterolaemia. Tryptophan inhibits gluconeogenesis [32], therefore influencing pyruvate concentrations. The pyruvate pathway is one of the most affected by dyslipidaemic conditions (Fig 4). Many adipose tissues synthesize ketone bodies from leucine, which would explain the reduction in leucine concentration and the increase in fatty acids [33].
According to enrichment pathway analysis, metabolites discriminating the two groups of sera reflect an alteration in the metabolic pathways of pantothenate and CoA biosynthesis, pyruvate, glycolysis/gluconeogenesis, and citrate cycle. While it is not possible to specifically relate these metabolic changes to the pathogenetic mechanisms of clinical conditions associated with hypercholesterolaemia and dyslipidaemia, it is still possible to make some hypotheses. Hypercholesterolaemic and dyslipidaemic conditions leading to cardiovascular conditions are most commonly consequent to a nutritional status with excessive energy and lipid intake. Pantothenate/CoA biosynthesis, pyruvate metabolism, glycolysis/gluconeogenesis, and the citrate cycle are all energy-related pathways. Correspondingly, ketone body pathways are typically increased when excessive energy is derived from lipids. This is consistent with the observed reduction in citrate in hypercholesterolaemic samples, also indicating a decrease in the Krebs cycle, which is the typical metabolic change leading to an increase in ketone body production to process excessive acetyl CoA, which cannot be catabolized [34]. Additionally, observed variations in hypoxanthine and taurine/hypotaurine metabolism are likely part of these disease mechanisms. In particular, hypoxanthine levels are related to the condition of hypercholesterolaemia [35].
Conclusions
Administration of human hepatoma cells with hypercholestaerolaemic blood sera previously induced an increase in the mRNA expression of HMGCS2, an enzyme involved in the ketone body pathway. In the present work, the sera previously used to treat hepatoma cells have been the object of NMR metabolomics analysis. The data thus obtained show concentration abnormalities of metabolites involved in energy related pathways. Serum samples previously found to be able to increase HMGCS2 mRNA levels in cultured cells also contain higher amounts of acetate and acetoacetate, metabolites of its encoded enzyme protein product.
The data presently reported, integrated by those previously published, define a multi-omics analytical approach to prove that the transcriptional regulation of the gene HMGCS2 has an effect on the synthesis of numerous metabolites related to mitochondrial energy processes.
Supporting information
The explained variance of each PC is shown in the corresponding diagonal cell.
(DOC)
The green line on top shows the accumulated variance explained; the blue line underneath shows the variance explained by individual PC.
(DOC)
The red circles represent features above the threshold. The values are on a log scale so that both up-regulated and down- regulated features can be plotted symmetrically.
(DOC)
The red circles represent features above the threshold. P-values are transformed by -log10 so that the more significant features (with smaller p-values) will be plotted higher on the graph.
(DOC)
The red star indicates the best classifier.
(DOC)
Pathway viewer: Light blue boxes indicate metabolites (identified by KEGG ID) that are not measured in our data, but are used as background for enrichment analysis; yellow to red colors indicate the metabolites included in our dataset with different levels of significance: a) Pantothenate and CoA biosynthesis. C00183 = L-Valine, C0049 = L-Aspartate, C0097 = L-Cysteine. b) Pyruvate metabolism. C0022 = Pyruvate, C0033 = Acetate. c) Glycolysis / Gluconeogenesis C0033 = Acetate, C00022 = Pyruvate d) Citrate cycle (TCA). C00022 = Pyruvate, C00158 = Citrate; Citric acid; 2-Hydroxy-1,2,3-propanetricarboxylic acid; 2-Hydroxytricarballylic acid. e) Ketone bodies degradation and synthesis. C01089 = (R)-3-Hydroxybutanoate, C00164 = Acetoacetate.
(DOC)
(DOC)
(DOC)
(DOC)
(DOC)
(DOC)
The pathway was classified according to: total number of compounds found in KEGG database involved in the pathway (total Cmpd), analysed compounds involved in pathway (Hits), p-value calculated on the hits (Raw p), logarithmic p-value (-log (p)), p-value adjusted by Holm-Bonferroni (Holm adjust) p-value adjusted using False Discovery Rate (FDR), the pathway impact value calculated from pathway topology analysis (Impact).
(DOC)
Data Availability
We submitted our data to MetaboLights database with ID code: MTBLS1416.
Funding Statement
The author(s) received no specific funding for this work.
References
- 1.Boren J, Williams KJ. The central role of arterial retention of cholesterol-rich apolipoprotein-B-containing lipoproteins in the pathogenesis of atherosclerosis: a triumph of simplicity. Curr Opin Lipidol. 2016;27(5):473–83. 10.1097/MOL.0000000000000330 . [DOI] [PubMed] [Google Scholar]
- 2.Navarese EP, Andreotti F, Raggi P, Kolodziejczak M, Buffon A, Bliden K, et al. Baseline low-density lipoprotein cholesterol to predict the extent of cardiovascular benefit from lipid-lowering therapies: a review. Eur Heart J Cardiovasc Pharmacother. 2019;5(1):47–54. 10.1093/ehjcvp/pvy038 . [DOI] [PubMed] [Google Scholar]
- 3.Simons LA. An updated review of lipid-modifying therapy. Med J Aust. 2019;211(2):87–92. 10.5694/mja2.50142 . [DOI] [PubMed] [Google Scholar]
- 4.De Rosa MC, Caputo M, Zirpoli H, Rescigno T, Tarallo R, Giurato G, et al. Identification of genes selectively regulated in human hepatoma cells by treatment with dyslipidemic sera and PUFAs. J Cell Physiol. 2015;230(9):2059–66. 10.1002/jcp.24932 [DOI] [PubMed] [Google Scholar]
- 5.Zhang Z, Zhang H-Y, Zhang Y, Li H. Inactivation of the Ras/MAPK/PPARγ signaling axis alleviates diabetic mellitus-induced erectile dysfunction through suppression of corpus cavernosal endothelial cell apoptosis by inhibiting HMGCS2 expression. Endocrine. 2019;63(3):615–31. 10.1007/s12020-018-1810-2 [DOI] [PubMed] [Google Scholar]
- 6.Rescigno T, Capasso A, Tecce MF. Involvement of nutrients and nutritional mediators in mitochondrial 3-hydroxy-3-methylglutaryl-CoA synthase gene expression. J Cell Physiol. 2018;233(4):3306–14. 10.1002/jcp.26177 [DOI] [PubMed] [Google Scholar]
- 7.Conboy E, Vairo F, Schultz M, Agre K, Ridsdale R, Deyle D, et al. Mitochondrial 3-Hydroxy-3-Methylglutaryl-CoA synthase deficiency: Unique presenting laboratory values and a review of biochemical and clinical features. JIMD Rep 2017. p. 63–9. [DOI] [PMC free article] [PubMed] [Google Scholar]
- 8.Shukla SK, Liu W, Sikder K, Addya S, Sarkar A, Wei Y, et al. HMGCS2 is a key ketogenic enzyme potentially involved in type 1 diabetes with high cardiovascular risk. Sci Rep. 2017;7(1):4590 10.1038/s41598-017-04469-z [DOI] [PMC free article] [PubMed] [Google Scholar]
- 9.Beckonert O, Keun HC, Ebbels TM, Bundy J, Holmes E, Lindon JC, et al. Metabolic profiling, metabolomic and metabonomic procedures for NMR spectroscopy of urine, plasma, serum and tissue extracts. Nat Protoc. 2007;2(11):2692–703. 10.1038/nprot.2007.376 . [DOI] [PubMed] [Google Scholar]
- 10.Dumas ME, Maibaum EC, Teague C, Ueshima H, Zhou BF, Lindon JC, et al. Assessment of analytical reproducibility of H-1 NMR spectroscopy based metabonomics for large-scale epidemiological research: the INTERMAP study. Anal Chem. 2006;78(7):2199–208. 10.1021/ac0517085 [DOI] [PMC free article] [PubMed] [Google Scholar]
- 11.Zirpoli H, Caputo M, Carraturo A, Torino G, Fazio A, Attya M, et al. Selective action of human sera differing in fatty acids and cholesterol content on in vitro gene expression. J Cell Biochem. 2012;113(3):815–23. 10.1002/jcb.23409 . [DOI] [PubMed] [Google Scholar]
- 12.Palisi A, Grimaldi M, Sabatini P, Montoro P, Scrima M, Rodriquez M, et al. A serum nuclear magnetic resonance-based metabolomic signature of antiphospholipid syndrome. 2017;133:90–5. [DOI] [PubMed] [Google Scholar]
- 13.Nicholson JK, Foxall PJ, Spraul M, Farrant RD, Lindon JC. 750 MHz 1H and 1H-13C NMR spectroscopy of human blood plasma. Analytical chemistry. 1995;67(5):793–811. 10.1021/ac00101a004 [DOI] [PubMed] [Google Scholar]
- 14.Mckay RT. How the 1D-NOESY suppresses solvent signal in metabonomics NMR spectroscopy: An examination of the pulse sequence components and evolution. Concepts in Magnetic Resonance Part A. 2011;38(5):197–220. [Google Scholar]
- 15.Mo H, Raftery D. Pre-SAT180, a simple and effective method for residual water suppression. J Magn Reson. 2008;190(1):1–6. 10.1016/j.jmr.2007.09.016 . [DOI] [PMC free article] [PubMed] [Google Scholar]
- 16.Aranibar N, Borys M, Mackin NA, Ly V, Abu-Absi N, Abu-Absi S, et al. NMR-based metabolomics of mammalian cell and tissue cultures. J Biomol NMR. 2011;49(3–4):195–206. 10.1007/s10858-011-9490-8 . [DOI] [PubMed] [Google Scholar]
- 17.Jupin M, Michiels PJ, Girard FC, Spraul M, Wijmenga SS. NMR metabolomics profiling of blood plasma mimics shows that medium- and long-chain fatty acids differently release metabolites from human serum albumin. J Magn Reson. 2014;239:34–43. 10.1016/j.jmr.2013.11.019 . [DOI] [PubMed] [Google Scholar]
- 18.Haug K, Salek RM, Conesa P, Hastings J, de Matos P, Rijnbeek M, et al. MetaboLights—an open-access general-purpose repository for metabolomics studies and associated meta-data. Nucleic Acids Res. 2013;41(Database issue):D781–6. 10.1093/nar/gks1004 . [DOI] [PMC free article] [PubMed] [Google Scholar]
- 19.Chong J, Wishart DS, Xia J. Using metaboanalyst 4.0 for comprehensive and integrative metabolomics data analysis. Current Protocols in Bioinformatics. 2019;68(1):e86 10.1002/cpbi.86 [DOI] [PubMed] [Google Scholar]
- 20.Psychogios N, Hau DD, Peng J, Guo AC, Mandal R, Bouatra S, et al. The human serum metabolome. PloS one. 2011;6(2):e16957 10.1371/journal.pone.0016957 . [DOI] [PMC free article] [PubMed] [Google Scholar]
- 21.Kanehisa M, editor Organizing and computing metabolic pathway data in terms of binary relations. Pac Symp Biocomput; 1997: Citeseer. [PubMed]
- 22.Croft D, Mundo AF, Haw R, Milacic M, Weiser J, Wu G, et al. The Reactome pathway knowledgebase. Nucleic acids research. 2014;42(D1):D472–D7. [DOI] [PMC free article] [PubMed] [Google Scholar]
- 23.Hall WL. The future for long chain n-3 PUFA in the prevention of coronary heart disease: do we need to target non-fish-eaters? Proc Nutr Soc. 2017;76(3):408–18. 10.1017/S0029665117000428 . [DOI] [PubMed] [Google Scholar]
- 24.Chen H-H, Tseng YJ, Wang S-Y, Tsai Y-S, Chang C-S, Kuo T-C, et al. The metabolome profiling and pathway analysis in metabolic healthy and abnormal obesity. International journal of obesity. 2015;39(8):1241–8. 10.1038/ijo.2015.65 [DOI] [PubMed] [Google Scholar]
- 25.Liu MH, Li J, Shen P, Husna B, Tai ES, Yong EL. A natural polymorphism in peroxisome proliferator-activated receptor-alpha hinge region attenuates transcription due to defective release of nuclear receptor corepressor from chromatin. Mol Endocrinol. 2008;22(5):1078–92. 10.1210/me.2007-0547 . [DOI] [PMC free article] [PubMed] [Google Scholar]
- 26.Rakhshandehroo M, Hooiveld G, Muller M, Kersten S. Comparative analysis of gene regulation by the transcription factor PPARalpha between mouse and human. PloS one. 2009;4(8):e6796 10.1371/journal.pone.0006796 . [DOI] [PMC free article] [PubMed] [Google Scholar]
- 27.Kostiuk MA, Keller BO, Berthiaume LG. Palmitoylation of ketogenic enzyme HMGCS2 enhances its interaction with PPARalpha and transcription at the Hmgcs2 PPRE. FASEB J. 2010;24(6):1914–24. 10.1096/fj.09-149765 . [DOI] [PMC free article] [PubMed] [Google Scholar]
- 28.Meertens LM, Miyata KS, Cechetto JD, Rachubinski RA, Capone JP. A mitochondrial ketogenic enzyme regulates its gene expression by association with the nuclear hormone receptor PPARalpha. EMBO J. 1998;17(23):6972–8. 10.1093/emboj/17.23.6972 . [DOI] [PMC free article] [PubMed] [Google Scholar]
- 29.Vila-Brau A, De Sousa-Coelho AL, Mayordomo C, Haro D, Marrero PF. Human HMGCS2 regulates mitochondrial fatty acid oxidation and FGF21 expression in HepG2 cell line. J Biol Chem. 2011;286(23):20423–30. 10.1074/jbc.M111.235044 . [DOI] [PMC free article] [PubMed] [Google Scholar]
- 30.Harvey PW, Hunsaker HA, Allen KG. Dietary L-histidine-induced hypercholesterolemia and hypocupremia in the rat. The Journal of nutrition. 1981;111(4):639–47. 10.1093/jn/111.4.639 [DOI] [PubMed] [Google Scholar]
- 31.Jacob N, Bruckert E, Giral P, Foglietti M, Turpin G. Cysteine is a cardiovascular risk factor in hyperlipidemic patients. Atherosclerosis. 1999;146(1):53–9. 10.1016/s0021-9150(99)00128-8 [DOI] [PubMed] [Google Scholar]
- 32.Smith SA, Elliott KR, Pogson CI. Differential effects of tryptophan on glucose synthesis in rats and guinea pigs. Biochemical Journal. 1978;176(3):817–25. 10.1042/bj1760817 [DOI] [PMC free article] [PubMed] [Google Scholar]
- 33.Yeh Y-Y. Ketone body synthesis from leucine by adipose tissue from different sites in the rat. Archives of biochemistry and biophysics. 1984;233(1):10–8. 10.1016/0003-9861(84)90596-4 [DOI] [PubMed] [Google Scholar]
- 34.Wishart DS, Feunang YD, Marcu A, Guo AC, Liang K, Vázquez-Fresno R, et al. HMDB 4.0: the human metabolome database for 2018. Nucleic acids research. 2017;46(D1):D608–D17. [DOI] [PMC free article] [PubMed] [Google Scholar]
- 35.Kim Y, Park Y-J, Yang S-O, Kim S-H, Hyun S-H, Cho S, et al. Hypoxanthine levels in human urine serve as a screening indicator for the plasma total cholesterol and low-density lipoprotein modulation activities of fermented red pepper paste. Nutrition research. 2010;30(7):455–61. 10.1016/j.nutres.2010.06.014 [DOI] [PubMed] [Google Scholar]
Associated Data
This section collects any data citations, data availability statements, or supplementary materials included in this article.
Supplementary Materials
The explained variance of each PC is shown in the corresponding diagonal cell.
(DOC)
The green line on top shows the accumulated variance explained; the blue line underneath shows the variance explained by individual PC.
(DOC)
The red circles represent features above the threshold. The values are on a log scale so that both up-regulated and down- regulated features can be plotted symmetrically.
(DOC)
The red circles represent features above the threshold. P-values are transformed by -log10 so that the more significant features (with smaller p-values) will be plotted higher on the graph.
(DOC)
The red star indicates the best classifier.
(DOC)
Pathway viewer: Light blue boxes indicate metabolites (identified by KEGG ID) that are not measured in our data, but are used as background for enrichment analysis; yellow to red colors indicate the metabolites included in our dataset with different levels of significance: a) Pantothenate and CoA biosynthesis. C00183 = L-Valine, C0049 = L-Aspartate, C0097 = L-Cysteine. b) Pyruvate metabolism. C0022 = Pyruvate, C0033 = Acetate. c) Glycolysis / Gluconeogenesis C0033 = Acetate, C00022 = Pyruvate d) Citrate cycle (TCA). C00022 = Pyruvate, C00158 = Citrate; Citric acid; 2-Hydroxy-1,2,3-propanetricarboxylic acid; 2-Hydroxytricarballylic acid. e) Ketone bodies degradation and synthesis. C01089 = (R)-3-Hydroxybutanoate, C00164 = Acetoacetate.
(DOC)
(DOC)
(DOC)
(DOC)
(DOC)
(DOC)
The pathway was classified according to: total number of compounds found in KEGG database involved in the pathway (total Cmpd), analysed compounds involved in pathway (Hits), p-value calculated on the hits (Raw p), logarithmic p-value (-log (p)), p-value adjusted by Holm-Bonferroni (Holm adjust) p-value adjusted using False Discovery Rate (FDR), the pathway impact value calculated from pathway topology analysis (Impact).
(DOC)
Data Availability Statement
We submitted our data to MetaboLights database with ID code: MTBLS1416.


