Abstract
Advanced glycation end-products (AGEs) have been suggested to contribute to bone fragility in type 2 diabetes (T2D). AGEs can be induced through in vitro sugar incubations but there is limited data on the effect of total fluorescent AGEs on mechanical properties of human cortical bone, which may have altered characteristics in T2D. Thus, to examine the effect of AGEs on bone directly in T2D patients with uncontrolled sugar levels, it is essential to first understand fundamental mechanisms by studying the effects of controlled in vitro induced AGEs on cortical bone mechanical behavior. Here, human cortical bone specimens from female cadaveric tibias (ages 57-87) were incubated in an in vitro 0.6 M ribose or vehicle solution (n=20/group) for 10 days at 37°C, their mechanical properties were assessed by microindentation and fracture toughness tests, and induced AGE levels were quantified through a fluorometric assay. Results indicated that ribose-incubated bone had significantly more AGEs (+81%, p≤0.005), lower elastic modulus assessed by traditional microindentation, and lower fracture toughness compared to vehicle controls. Furthermore, based on pooled data, increased AGEs were significantly correlated with deteriorated mechanical properties. The findings presented here show that the accumulation of AGEs allows for lower stiffness and increased ability to initiate a crack in human cortical bone.
Keywords: Advanced glycation end-products, non-enzymatic glycation, microindentation, fracture toughness, bone
Introduction
Bone strength and its ability to resist fractures depends on many factors including bone mass, geometry, and intrinsic factors of the bone itself known as bone quality. Although the contribution of bone mineral on bone’s mechanical properties are well studied, the role of tissue properties attributed to collagen and collagen crosslinks on bone’s mechanical properties has not been investigated thoroughly. Some crosslinks are formed by a biochemical process known as non-enzymatic glycation (NEG) in which extracellular sugars spontaneously bind with amino acid residues on collagen. This process gives rise to by-products called Advanced Glycation End-Products (AGEs) 1. Accelerated formation of AGEs is associated with aging and is proposed to be involved in clinical conditions such as type 2 diabetes (T2D) where patients have a higher risk of fracture compared to non-diabetics within a given bone mineral density 2. Several studies show AGEs affect bone mechanical properties, but some findings are inconsistent, making it difficult to understand the exact effect AGEs have on bone strength.
For instance, several studies show increased AGEs are associated with reduced post-yield properties and bone toughness, which has been suggested to occur due to microcrack accumulation 3-7. However, other reports show no correlation between AGEs and bone toughness 1; 8; 9. These discrepancies illustrate the need for an improved understanding of the effect of AGEs on crack initiation and propagation. Moreover, studies using diabetic animals suggest increased AGEs are associated with lower bone stiffness and are more susceptible to microcrack propagation compared to non-diabetic controls, but there is little information regarding crack initiation and propagation due to AGEs in human bone 6; 7; 10. Further, about 12 studies in human bone focused on studying the effect of non-enzymatic glycation on cancellous bone mechanical behavior 11-22, but only 6 studies report findings on cortical bone, 2 of which utilize bovine bone 1; 7; 23-26. There is some indication that in diabetes (where AGEs are particularly relevant) cortical bone is the primary bone type affected with reduced quality 27. However, recent studies indicate these deteriorations may occur in only certain groups such as reduced cortical thickness in those with previous fractures and increased cortical porosity in those without prior fractures 28 or that there is deteriorated bone material strength index that counterintuitively corresponds with improved cortical microarchitecture 29.
Despite these mixed results reported in the literature, there is a case to investigate cortical bone as it appears to have unique qualities in T2D patients. Among the 6 reports on AGEs in cortical bone specimens, an early study indicated there was greater yield stress and strain but no change in post-yield strain energy in in vitro sugar-incubated bovine cortical bone 1 while a later study indicated that in vitro sugar-incubated bovine specimens had lower post-yield strain and flexural toughness 25. The remaining 4 studies utilized human cortical bone. One study showed that the amount of resorption pits was positively correlated with AGEs, illustrating an important relationship between remodeling of cortical bone and its organic components but without focusing on directly measured mechanical properties 38. One study indicated there was no difference in fracture initiation toughness assessed by compact tension specimen testing between in vitro sugar incubated and vehicle groups, and this finding was reported in a mix of males and females of a wide age range 7. Another study illustrated an increase in AGEs in human bone was associated with deteriorated reference point indentation properties but not with mechanical properties assessed by 3-point bending tests 26. The last study illustrated that certain drug targets can be used to decrease AGEs in human bone with a consequent improvement in cyclic reference point indentation properties 23. Additionally, there are drastic differences in AGE levels across these studies, which makes it even more difficult to compare findings. Due to the limited studies done regarding AGEs and human cortical bone, it is necessary to augment the datasets in literature by providing additional information regarding the effects of AGEs on bone mechanical properties using traditional mechanical testing methods. These traditional testing methods conducted on cortical bone specimens of standardized geometry is important for assessment of intrinsic tissue properties of the bone material—bone is a hierarchical structure and any changes at smaller scales (e.g., bone tissue level) contribute to its overall behavior at a larger scale (e.g., whole bone).
Moreover, before investigating the effects of AGEs on cortical bone in diabetic patients where there are numerous confounding health issues, it is important to first clarify their effects on mechanical properties of cortical bone in a controlled manner. Due to the contradictory findings in literature and limited information on mechanical properties in cortical bone, the goal of this project was to simulate accumulation of AGEs in cortical bone in vitro to study the effect of AGEs in bone independent of changes that might occur in vivo.
In this study, human cadaveric cortical bone specimens from tibias were incubated in a vehicle or ribose solution in vitro. Despite some of the contradictions and the limited information in the literature, it is generally suggested that AGEs deteriorate mechanical properties in bone. Thus, our overall hypothesis was that ribose-incubated bone would have deteriorated mechanical properties compared to vehicle-incubated specimens as assessed by traditional microindentation, cyclic reference point indentation, and fracture toughness testing. An additional hypothesis was that increased AGE levels would correlate with deteriorated mechanical properties.
Methods
Specimen Collection
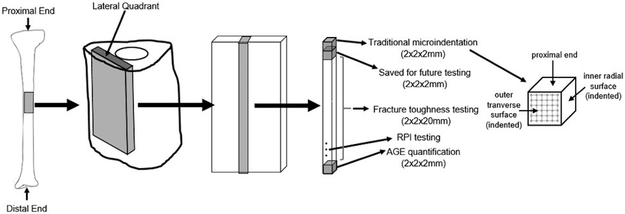
One tibia each from ten female human donors (age 73.1±10.9 years) with no history of bone metabolic disorders were acquired from a donor bank (Anatomy Gifts Registry, Hanover, MD). All donor specimens were free of fixatives, shipped frozen on dry ice, and stored at −20°C until use. Cortical beams were cut from the proximal midshaft using an Isomet 1000 low-speed diamond blade saw (Buehler, Lake Bluff, IL) and polished to exact dimensions (2×2×26mm) using a Model 900 polishing machine (South Bay Technology, San Clemente, CA) (Figure 1). Four beams were extracted per donor (n=40). Two beams were randomly assigned to each group: vehicle (VEH, n=20) or ribose (R, n=20). From each beam, 3 cubed specimens (2×2×2mm) were cut after incubations for various testing measures (Figure 1). All specimens were wrapped in saline-soaked gauze and stored at −20°C when not in use.
Figure 1.
Overview of human cortical bone specimens used in the study design.
In Vitro Incubations of Bone Specimens
A buffer solution was created with 25mM amino-n-caproic acid, 5mM benzamidine, 10mM n-ethylmaleimide, and 30mM HEPES in Hanks’ Balanced Salt Solution as done in previous studies 14; 30. The solution for the ribose group had the addition of 0.6M D-ribose. Specimens were submerged in corresponding solutions for 10 days at 37°C (pH maintained between 7.2–7.6).
Measurement of Cortical Tissue Mineral Density and Porosity
104 slices at the beam mid-sections were imaged by microcomputed tomography (microCT) (microCT40, Scanco Medical AG, Switzerland) while hydrated in saline. Specimens were scanned at 12μm voxel size, 70kVp peak x-ray tube potential, 114uA x-ray intensity, and 200ms integration time. Images were threshholded at 700mgHA/cm 3, and data regarding cortical tissue mineral density (Ct.TMD) and cortical porosity (Ct. Po) were obtained.
Quantification of AGEs
The distal-most cubed specimens were quantified for AGEs (Vehicle n=10, Ribose n=10). Specimens were defatted, lyophilized for 8hrs, and hydrolyzed in 6N HCl (10μL/mg bone) for 20hrs at 110°C 31. The hydrolysates were centrifuged at 13,000RPM at 4°C for removal of unwanted debris. Centrifuged hydrolysates were stored in −80°C in complete darkness prior until use.
Total fluorescent AGEs (fAGEs) were quantified based on published methods 30. Fluorescence for quinine standards and 150x diluted hydrolysates were measured at 360/460nm excitation/emission using a Synergy HTX Multi-Mode Reader (BioTek, Winooski, VT). A chloramine-T solution was added to hydroxyproline standards and diluted hydrolysates and incubated at room temperature for oxidation of hydroxyproline. Perchloric acid (3.15M) was added and incubated at room temperature to quench residual chloramine-T. A p-dimethylaminobenzaldehyde solution was added and incubated at 60°C. After cooling at room temperature in darkness, absorbance was measured at 570nm. Collagen content was calculated based on hydroxyproline quantity . fAGEs were quantified in terms of ng quinine/mg collagen.
Assessment of Indentation Properties by Cyclic Reference Point Indentation
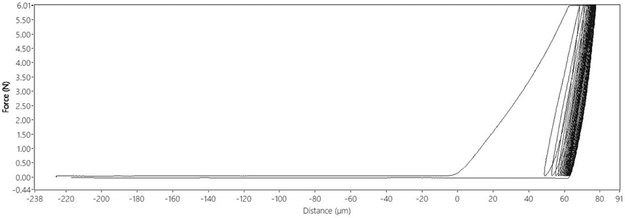
Cyclic Reference Point Indentation (cRPI) tests were performed using a BioDent Hfc (Active Life Scientific, Santa Barbara, CA) for 20 cycles at 2Hz with a force of 6N during each cycle (returning to 0N load after each cycle) using BP2 probes (Figure 2). Indentations were made on the periosteal surface of the distal end of beams after incubation. Three indentations were performed per beam ~1mm apart. Only three indentations were made to avoid the mid-section of the beam, which is necessary for subsequent fracture toughness experiments. Data obtained from cRPI testing included: indentation distance (ID, μm), creep indentation distance (CID, μm), total indentation distance (TID, μm), indentation distance increase (IDI, μm), average energy dissipation (avg ED, μJ), average loading slope (avg LS, N/μm), and average unloading slope (avg US, N/μm) .
Figure 2.
Typical load-displacement diagram of one cRPI indentation in cortical bone.
Assessment of Elastic Modulus by Traditional Microindentation
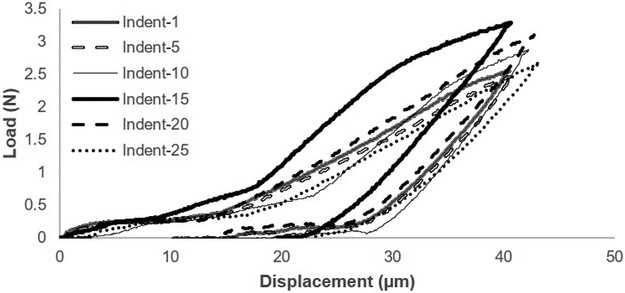
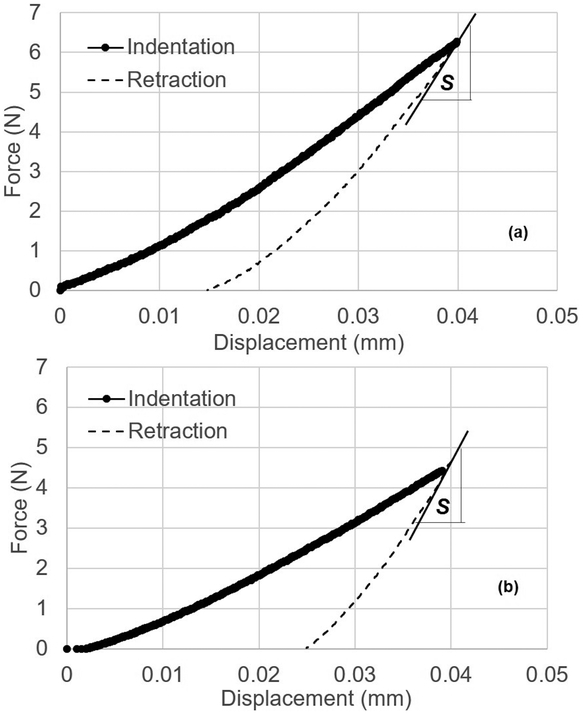
Microindentation in displacement-control was performed on the outer lateral transverse (OLT) surface and inner radial (IR) surface of each cubed bone specimen with a custom-built microindenter used previously 32. The microindenter is composed of a precision linear PZT actuator, load cell, pyramid diamond tip indenter (with angles of 136°) head, and XY precision stage. Specimens were tested immediately after thawing and removal from saline-soaked gauze. Specimens were placed in a custom-made sample holder to perform 25 indents in a grid-like fashion on each surface with indents spaced 250μm apart (Figure 1) at a rate of 0.001mm/s to a pre-set depth of 40μm (spacing was determined after calculation of Vicker maximum dimension and confirmation using SEM imaging to ensure there was no damage from one indent to another). For less than 10% of the samples, <25 indentations were performed due to the specimen being less than the desired 2×2×2mm dimensions. Using load-displacement information collected through LabView data acquisition system (Figures 3-4), maximum force (Fmax), initial slope of the unloading curve (S), and maximum indentation depth (h) were determined from each indentation to calculate elastic modulus for indentations (Equation 1) 33. Measurements across each surface were averaged.
Figure 3.
Typical force-displacement diagram of traditional microindentation illustrating every 5th indentation.
Figure 4.
Typical load-displacement diagrams of (a) vehicle and (b) ribose bone specimens. The line drawn at the beginning at the beginning of retraction curve is used for determining the slope, S.
| (Equation 1) |
S is initial slope of the initial part of the unloading curve in N/m, h is indentation depth, Fmax is maximum force, and C is another constant predetermined through indentation of materials with known elastic moduli 33.
Assessment of Fracture Toughness by Notched 4-Point Bending
Fracture toughness tests were performed using four-point bending on beam specimens (2×2×26mm) after incubations were completed. Beams were thawed and tested immediately after removal from saline. A diamond saw blade (150μm thickness) was used to notch beams to a depth of 250μm. A razor blade was inserted into the notch and a 5-pound weight was dropped from 50mm height onto the blade to create an initial natural crack consistently across all beams. The predetermined weight and drop height created an average total initial crack depth of 750μm. Initial cracks were made on the OLT surface of each beam, and beams were tested with the OLT surface in tension. Beams were loaded at a rate of 0.005mm/s until failure with upper and lower spans set to 8mm and 16mm, respectively (load cell capacity 110N). This displacement rate was chosen to capture images of the crack initiation period, and the selected parameters produce quasi-static testing conditions 34.
A black dot was placed on beams before testing to use as a scale indicator in images. An Allied Vision Prosilica CCD camera (Stadtroda, Germany) allowing for a view field of ~2×2mm was used to observe the fracture process around the initial crack and determine the instant of crack initiation. This timing of crack initiation was used with corresponding load data to calculate the critical mode-I stress intensity factor, KIC, or fracture toughness (Equations 2-3).
| (Equation 2) |
| (Equation 3) |
P is applied load, c is distance between the upper and lower supports divided by 2, a is initial crack depth, w is width of the sample, and h is height of the sample 35. f(a/h) is a geometric correction factor for finite geometry for 4-point bending cracked specimen configuration 35.
Scanning Electron Microscopy Imaging
For visualization of fracture surfaces after fracture toughness testing, the broken portion of beams near the crack tip were cut using a diamond blade saw (Buehler, Lake Bluff, IL) to fit onto the platform for Scanning Electron Microscopy (SEM) imaging. Sectioned specimens were rinsed with saline solution and frozen for a minimum of 6 hours at −80°C. Specimens were then freeze dried for 24 hours using a FreeZone 2.5 Liter freeze dry system (Labconco, Kansas City, MO). The fracture surface was then coated with a thin layer of gold speckle and then imaged by SEM at 50x magnification (10kV) to observe the whole fracture surface. For visualization of traditional microindentations, cube specimens were processed similarly as described above, but without gold coating. Images were taken at 400x magnification (0.5kV) to observe individual indents.
Statistical Analyses
All data were plotted as histograms to determine distributions and identify outliers. Outliers were defined as any datapoint beyond 2 standard deviations of the mean and were not included in analyses. Data were compared between groups by analysis of covariance (ANCOVA) tests in which donor age was considered as a confounding variable (α=0.05). Pearson correlations were run to identify correlations between AGEs and other key variables. Replicate specimens from the same donors were averaged and used in statistical analyses. All analyses were conducted using SPSS (Version 24).
Results
Sample Size
One specimen was identified as an outlier for fAGEs and one for most cRPI variables resulting in n=10 vehicle and n=9 ribose for fAGEs and n=10 vehicle and n=9 ribose for cRPI data. We were unable to collect reliable microindentation data from 5 specimens due to surface imperfections, resulting in n=17 vehicle and n=18 ribose. Several beams broke during the notching process for fracture toughness testing, resulting in n=18 per group.
Differences in Microarchitecture, Mechanical Properties, and AGEs between Groups
There was no difference in cortical tissue mineral density (Ct.TMD) or porosity (Ct.Po) between groups (Table 1). AGEs were significantly higher in ribose-treated versus vehicle specimens (+81%, p≤0.005) (Table 1) with donor age taken into consideration.
Table 1.
Mean and standard deviation of microCT, fracture toughness, microindentation, cRPI, and AGE data for vehicle-treated and ribose-treated specimens.
| Vehicle | Ribose | P-value for Variable |
P-value for Effect of Age |
|
|---|---|---|---|---|
| MicroCT | ||||
| Cortical Tissue Mineral Density (mgHA/cm3) | 1122.4 ± 14.8 | 1128.27 ± 11.9 | NSt | NS |
| Cortical Porosity (%) | 4.62 ± 1.98 | 4.47 ± 1.63 | NSa | ≤0.005 |
| Fracture Toughness | ||||
| Stress Intensity Factor, K (MPa) | 4.98 ± 0.56 | 2.20 ± 0.47 | ≤0.001t | NS |
| Initiation Load (N) | 55.6 ± 7.68 | 26.0 ± 6.64 | ≤0.001a | ≤0.001 |
| Initiation Time (Sec) | 117.8 ± 12.2 | 76.8 ± 7.93 | ≤0.001t | NS |
| Microindentation | ||||
| Elastic Modulus, OLT Surface (MPa) | 9.77 ± 1.23 | 4.39 ± 0.59 | ≤0.001t | NS |
| Elastic Modulus, IR Surface (MPa) | 10.5 ± 0.94 | 4.65 ± 0.78 | ≤0.001t | NS |
| Slope of Initial Unloading Curve, OLT Surface (N/m) | 6.01E+5 ± 8.28E+4 | 1.99E+05 ± 5.72E+04 | ≤0.001a | ≤0.01 |
| Slope of Initial Unloading Curve, IR Surface (N/m) | 6.30E+5 ± 9.03E+4 | 1.93E+05 ± 5.11E+04 | ≤0.001a | ≤0.05 |
| Maximum Force, OLT Surface (N) | 3.91 ± 1.26 | 2.80 ± 1.20 | ≤0.05a | ≤0.05 |
| Maximum Force, IR Surface (N) | 4.90 ± 0.89 | 3.63 ± 1.58 | ≤0.05a | ≤0.05 |
| Cyclic Reference Point Indentation | ||||
| Indentation Distance (μm) | 70.9 ± 9.06 | 75.54 ± 16.8 | NSt | NS |
| Creep Indentation Distance (μm) | 5.27 ± 1.03 | 5.27 ± 0.89 | NSt | NS |
| Total Indentation Distance (μm) | 78.0 ± 9.17 | 82.2 ± 16.7 | NSt | NS |
| Indentation Distance Increase (μm) | 11.5 ± 2.38 | 11.04 ± 1.53 | NSt | NS |
| Average Energy Dissipation (μJ) | 19.7 ± 3.04 | 19.5 ± 2.00 | NSt | NS |
| Average Loading Slope (N/μm) | 0.34 ± 0.024 | 0.34 ± 0.018 | NSt | NS |
| Average Unloading Slope (N/μm) | 0.42 ± 0.037 | 0.42 ± 0.030 | NSt | NS |
| Advanced Glycation End-Products (AGEs) | ||||
| Cortical AGEs (ng quinine/mg collagen) | 240.8 ± 181.8 | 569.4 ± 186.00 | ≤0.0014t | NS |
NS=not significant
=p-value evaluated by t-test
=p-value evaluated by ANCOVA
cRPI variables showed no differences between groups (p>0.05 for all variables). Microindentation force-indentation depth curves indicated all specimens indeed had a maximum displacement of 0.04mm as set in testing configurations, but the slope of the initial unloading curve (OLT: −101%, p≤0.001; IR: −106%, p≤0.001), maximum force (OLT: −28.8%, p≤0.05; IR: −32%, p≤0.05), and elastic modulus (OLT: −75%, p≤0.001; IR: −77%, p≤0.001) on both surfaces were lower for the ribose-treated group compared to vehicles (Table 1, Figure 5).
Figure 5.
Microindentation of the (A) outer transverse lateral surface and (B) inner radial surface of the cortical bone specimens show that ribose-treated specimens had lower elastic modulus than vehicle specimens. Replicate specimens were averaged and represented as a single point. Data obtained from specimens acquired from the same donors are indicated by matching letters.
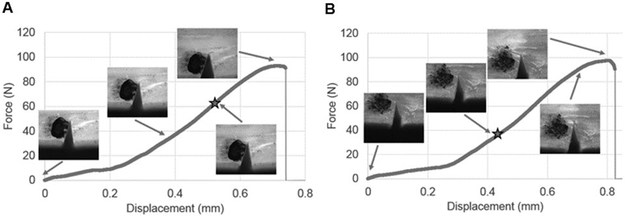
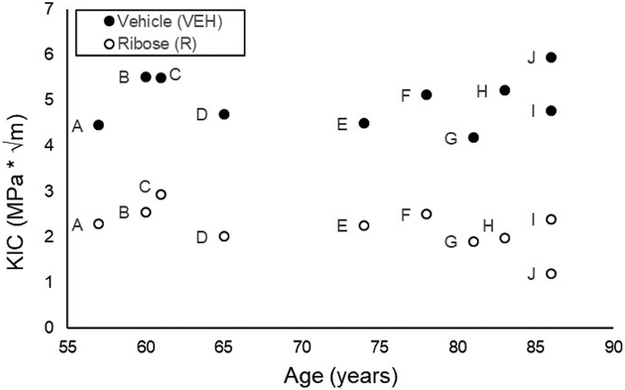
Fracture toughness data indicated the initiation load was lower (−71%, p≤0.001) and occurred at an earlier time (−41%, p≤0.001) for the ribose-treated group compared to vehicles (Figure 6). The fracture toughness, KIC, was significantly lower for the ribose-treated group compared to vehicles (−75%, p≤0.001, Figure 7), with donor age taken into consideration.
Figure 6.
Illustration of typical force-displacement curves and corresponding crack growth for four-point bending tests for (A) vehicle-incubated and (B) ribose-incubated specimens. Initiation load is indicated by the star on each graph.
Figure 7.
Ribose-incubated specimens had lower fracture toughness than vehicle-treated cortical bone specimens. Replicate specimens were averaged and represented as a single point. Data obtained from specimens acquired from the same donors are indicated by matching letters.
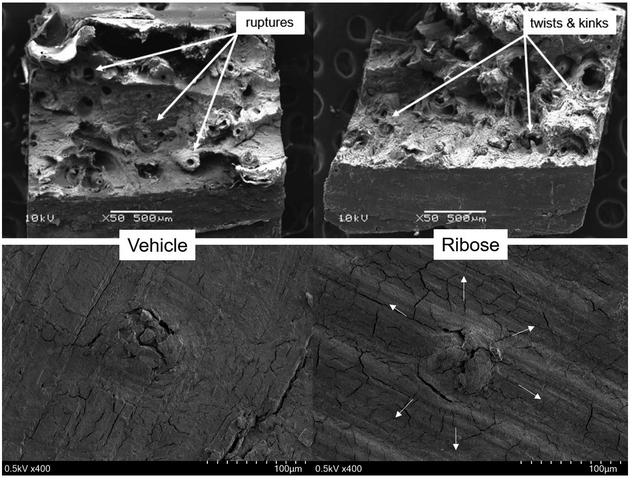
Observations from SEM imaging (Figure 8) indicated that surface features known as ruptures (i.e. clean breaks of osteons) were present on the vehicle fracture surface. In contrast, ribose-treated specimens had surface features known as twists and kinks that are present when bone collagen fibers break and delaminate from each other 36. SEM images of individual microindentations (Figure 8) indicated that the indentations produced a radial pattern of microdamage protruding from the indent in ribose-treated samples compared to minimal microdamage produced by indents on vehicle specimens.
Figure 8.
SEM images of fracture surface for (top left) vehicle- and (top right) ribose-treated cortical bone after fracture toughness testing, and for a single indent for (bottom left) vehicle- and (bottom right) ribose-treated cortical bone after traditional microindentation testing. White arrows indicate direction of microcracks.
Relationships between Microarchitecture, Mechanical Properties, and AGEs
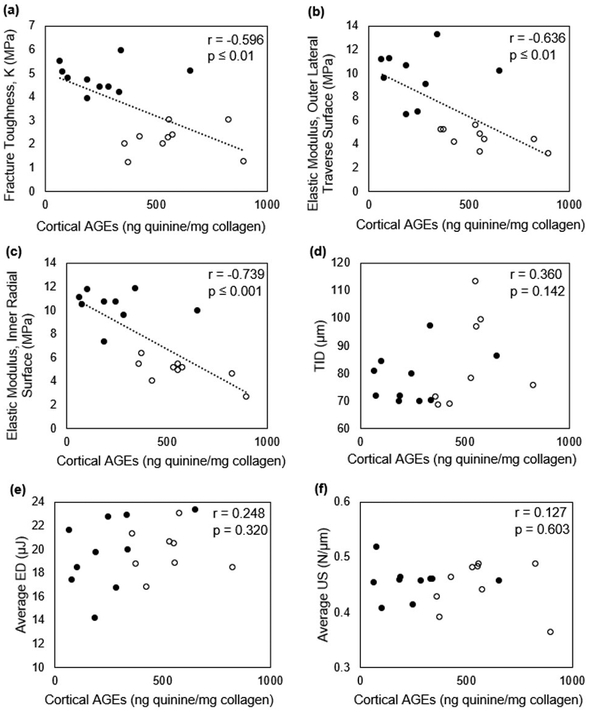
Ct.TMD and Ct.Po were not correlated with fAGEs in pooled or un-pooled datasets (Table 2). fAGEs and cRPI variables were not correlated. However, there was a trend for a relationship between fAGEs and total indentation distance (r=+0.360, p=0.14) in pooled datasets (Table 2, Figure 9). There was a trend for correlation between fAGEs and average loading slope (r=+0.671, p=0.07) in the ribose group alone (Table 2). There was a significant negative correlation between elastic modulus and fAGEs on both OLT (r=−0.636, p≤0.01) and IR surfaces (r=−0.739, p≤0.01) (Table 2, Figure 9). Traditional microindentation measures and cRPI variables were not correlated on either OLT or IR surfaces. KIC had a significant negative correlation with fAGEs when data were pooled for vehicle and ribose groups (Table 2, Figure 9).
Table 2.
Pearson correlation coefficients between AGEs and all other measured variables.
| R-value (Pooled) | R-value (Un-pooled) | ||
|---|---|---|---|
| Vehicle | Ribose | ||
| MicroCT | |||
| Cortical Tissue Mineral Density (mgHA/cm3) | 0.201 (NS) | 0.091 (NS) | 0.566 (NS) |
| Cortical Porosity (%) | 0.149 (NS) | 0.251 (NS) | −0.120 (NS) |
| Fracture Toughness | |||
| Stress Intensity Factor, K (MPa) | −0.596 (≤0.01) | 0.053 (NS) | 0.115 (NS) |
| Microindentation | |||
| Elastic Modulus, OLT Surface (MPa) | −0.636 (≤0.01) | 0.064 (NS) | −0.597 (=0.09) |
| Elastic Modulus, IR Surface (MPa) | −0.739 (≤0.001) | −0.123 (NS) | −0.705 (≤0.05) |
| Cyclic Reference Point Indentation | |||
| Indentation Distance (μm) | 0.380 (NS) | 0.352 (NS) | 0.290 (NS) |
| Creep Indentation Distance (μm) | 0.302 (NS) | 0.376 (NS) | 0.348 (NS) |
| Total Indentation Distance (μm) | 0.360 (NS) | 0.309 (NS) | 0.302 (NS) |
| Indentation Distance Increase (μm) | 0.008 (NS) | 0.089 (NS) | 0.146 (NS) |
| Average Energy Dissipation (μJ) | 0.248 (NS) | 0.465 (NS) | −0.022 (NS) |
| Average Loading Slope (N/μm) | 0.044 (NS) | 0.261 (NS) | 0.671 (=0.07) |
| Average Unloading Slope (N/μm) | 0.127 (NS) | 0.040 (NS) | 0.094 (NS) |
NS=not significant
Figure 9.
Negative correlations were detected for cortical AGEs vs fracture toughness, K (a) and vs elastic modulus on both tested surfaces (b-c). However, no significant correlations were detected between cortical AGEs and cRPI variables (d-f). Correlations were conducted for pooled groups (●=Vehicle, ○=Ribose).
Discussion
It is generally accepted that increased AGEs play a role in deteriorating bone’s mechanical properties, but studies regarding AGEs in bone report contradictory results or information that is difficult to compare across studies. Hence, it is important to bolster datasets available in the literature to have a better understanding of how high sugar environments affect bone. Thus, in this study human cadaveric cortical bone from tibias were incubated in vehicle or ribose-sugar solutions to induce the formation of AGEs and their mechanical properties were assessed by microindentation and fracture toughness tests. The hypotheses were that ribose-incubated specimens would have weaker mechanical properties, and the mechanical properties would be negatively correlated with fAGEs. The presented findings add to the limited dataset by providing new data regarding fAGEs in human cortical bone and how they relate to direct measures of fracture resistance.
As AGEs were induced in vitro and not in vivo, there was no expectation to observe any effects of AGEs on tissue mineral density or microarchitecture. The microCT results indicated there were no differences in these variables between groups, confirming that specimens were randomly distributed across groups with respect to microarchitecture and that there would be no effect of microarchitectural differences between groups on AGE accumulation. fAGEs were indeed increased by ~81% in ribose-treated specimens compared to vehicles. AGE levels in vehicles were like that reported in human cortical bone in vivo in 2 studies 30; 37 but was higher than that reported by another study 38 (Table 3). It is difficult to ascertain why the 3rd study reports much lower AGE values as that study also used human female tibias from a similar age range. Further, our in vitro induced AGE level for the ribose group was like that reported in the ribose groups in a previous in vitro study 7 (Table 3). However, our ribose AGE levels were different from previous in vitro studies in cortical bone, possibly due to those studies being conducted in a bovine model, for a much longer incubation period, using glucose, and/or using an incubation temperature beyond physiological temperature 1; 23; 25 (Table 3).
Table 3.
Comparison of AGE levels from our study to those reported in previous reports on cortical bone specimens. Our current study is italicized.
| Model | Sex | Age | Non- incubated bone |
Vehicle- incubated |
Sugar- incubated |
In vitro incubation details |
Ref. |
|---|---|---|---|---|---|---|---|
| Bovine/femur, tibia | ? | 18 mos | 75.9 ± 14.8 | 1274 ± 141.3 | 38 days incubation at 37°C, used ribose | 1 | |
| Bovine, metatarsal | ? | 18-24 mos | *69.3 ± 9.6 | *138 ± 25 | 14 days incubation at 37°C, used ribose | 25 | |
| Human, tibia | F, M | 34-85 yrs | 314 ± 37 | 640 ± 88 | 7 days incubation at 37°C, used ribose | 7 | |
| Human, tibia | F | 57-97 yrs | ~13 ± 1 | ~19 ± 2 | 7 days incubation at 50°C, used glucose | 23 | |
| Human, tibia | F, M | 19-97 yrs | range ~75-475 | 37 | |||
| Human, tibia | F | 57-97 yrs | range ~5-25 | 38 | |||
| Human, tibia | F | 57-86 yrs | 240.8 ± 181.8 | 569.4 ± 186.0 | 10 days incubation at 37°C, used ribose |
AGE data units reported as mg quinine/mmol collagen, while all other studies are reported as ng quinine/mg collagen.
To our knowledge, this study is the first to assess mechanical properties using both cRPI and traditional microindentation as well as fracture toughness tests in ribose-incubated cortical bone from humans. cRPI has been suggested to be clinically useful due to its ability to make distinctions between various groups of individuals 39. Although not significant, there were trends for increased indentation distances measured by cRPI in bone with higher fAGEs. However, overwhelmingly these variables were not different between groups. This suggests cRPI is not sensitive to changes in the protein network due to accumulation of AGEs alone but may be dependent on a combination of factors at the tissue-level. These results are discordant with those from a previous study that found an increase in cRPI-derived indentation distance increase and reduced crack growth toughness despite samples having similar bone mineral density 23. However, the previous study used glucose to incubate specimens at a temperature beyond physiological temperature compared to the use of ribose at physiological temperature in our study. The AGE content in specimens from the previous study were also 10-fold less than AGEs within our study 23. This drastic difference in AGEs may be attributed to the use of glucose incubation in the prior study, as in vitro incubation using glucose compared to ribose results in the formation of fewer AGEs 40.
Traditional microindentation was additionally used to test our specimens. This is an established method to investigate elastic deformation properties of bone at the microscale 41-45. Results indicated ribose-treated specimens had lower maximum force and stiffness, contributing to the observed 75% and 77% lower elastic modulus on the OLT and IR surfaces, respectively, compared to vehicles. Correlation analyses supported this further by confirming bone specimens with higher fAGEs levels had lower elastic modulus. Our SEM results also indicated that specimens with increased fAGEs displayed microcracks radiating outward from the microindentation sites compared to the minimal microdamage created by the microindentation in vehicle specimens. It is generally accepted that materials with lower elastic modulus (i.e., more brittle) have increased microcracking. These findings suggest that accumulation of AGEs do indeed result in deterioration of human cortical bone’s ability to resist elastic deformation under applied stresses. In contrast, a previous report showed cortical bone stiffness was not affected by accumulation of AGEs 1. However, these differences may be due to the former study being conducted in bovine bone. Findings presented here are also different from another report that the AGE pentosidine did not correlate with bone mechanical properties 5. The previous study measured pentosidine, which composes a small percentage of fAGEs in cortical bone (less than 5%) 30; 40, and was conducted in bovine bone. In contrast, our study provides more comprehensive information regarding AGEs as fAGEs were measured rather than a single AGE. Further, our study also contributed new data acquired from traditional microindentation, which has not been previously reported in in vitro glycated human bone.
Furthermore, it is important to note that bone fractures depend not only on the external stresses applied to bone, but also on the extent of inherent defects (i.e. microdamage) within bone and bone’s ability to resist initiation and propagation of cracks into a large-scale fracture. To simulate this, 4-point bending tests with a controlled notch to mimic pre-existing microdamage were conducted to assess fracture toughness. Typical values of fracture toughness of bone range from 2-8 MPa m1/2 46; 47 and results in this study fall within this range. Ribose-treated bone required less initiation load in less time and had 75% lower fracture toughness than vehicles, and fAGEs were negatively correlated with fracture toughness. These results illustrate that AGEs alter bone such that they require less force to initiate a crack and are less resistant to the initiation of a fracture. Specifically, accumulation of AGEs that form within and between collagen fibers can stiffen the collagen matrix 48, which in turn can result in delamination of the interfaces between collagen and mineral to reduce bone’s fracture toughness 49. Our findings confirm results from a study that determined by finite element analyses that AGEs decrease bone’s crack initiation toughness 49. This finding is also consistent with previous work indicating that accumulation of AGEs reduces bone fracture resistance 1; 4; 6; 49. In contrast, a recent comprehensive study conducted by Poundarik, et al, indicated there is no difference in fracture initiation toughness in in vitro glycated vs vehicle human cortical bone 7. Some possibilities for these differences may be due to the difference in age range used. The former study used donors within ages 34-85 years whereas our study utilized donors from ages 57-87, which is indicative of the age range more prone to bone fractures. This may impact the data due to the relationship between AGEs and age. Further, the previous study used a mix of male and female while this study used only female bone. Some features of bone may be different between genders such as rates of increasing fracture risk in diabetic men and women, and diabetes may also have differing impact in cortical porosity between genders 50. Further, the previous study utilized longitudinal compact tension testing while our study used 4-point fracture toughness tests.
The presented results should be considered with respect to several limitations. The age range of donors from which specimens were extracted ranged from ages 57-87, and so conclusions drawn are only applicable to this age group. All statistical analyses were conducted with donor age considered as a confounding variable to account for any influence of age, but future work should additionally include bone specimens from younger donors to have a more comprehensive age range. This study used ribose as the reducing sugar instead of its physiological counterpart glucose in the incubations. Ribose incubation was selected as this method is an established protocol that would allow for comparison of collected data to previous studies regarding in vitro sugar incubation of bone and would allow for the ability to fill gaps in current knowledge regarding effects of in vitro induced AGEs on bone’s mechanical properties. Future work should incorporate induction of AGEs by glucose and studying its effect at atomistic and molecular levels to understand the underlying mechanisms. With a better understanding of the effects of AGEs on bone mechanical properties, future work should also include assessment of AGEs directly in patients to clarify mechanisms through which AGEs affect mechanical properties.
In conclusion, the increase of fAGEs is associated with decreases in human cortical bone’s elastic modulus and fracture initiation toughness. A new and important dataset is presented here regarding the effect of AGEs on mechanical properties in human cortical bone as previous studies: 1) present findings primarily in trabecular bone, 2) report pentosidine measurements that are not wholly representative of fAGEs, and/or 3) report mechanical testing variables such as energy dissipation or toughness while very few report direct measurements of fracture resistance.
Supplementary Material
Statement of Clinical Significance: High sugar levels as in type 2 diabetes results in deteriorated bone quality via AGE accumulation with a consequent weakening in bone’s mechanical integrity.
Acknowledgements
This work was supported by the Multidisciplinary Seed Funding program from the Office of the Provost at the University of Massachusetts Dartmouth. The electron microscopy images in this work were obtained using a scanning electron microscope supported by the National Science Foundation under Grant No. 1726239. We would like to thank Mr. Daniel Brooks for assistance with microCT imaging, and Mr. Daniel Ducharme for assistance with designing and creating the four-point loading fixture. Dr. Karim is supported by the National Institute of Arthritis and Musculoskeletal and Skin Diseases of the National Institutes of Health under award number K01AR069685 and by the American Society for Bone and Mineral Research Rising Star Award. The content is solely the responsibility of the authors and does not necessarily represent the official views of the funding agencies.
References
- 1.Vashishth D, Gibson GJ, Khoury JI, et al. 2001. Influence of nonenzymatic glycation on biomechanical properties of cortical bone. Bone 28:195–201. [DOI] [PubMed] [Google Scholar]
- 2.McCabe L, Zhang J, Raehtz S JCRiEGE. 2011. Understanding the skeletal pathology of type 1 and 2 diabetes mellitus. 21. [DOI] [PubMed] [Google Scholar]
- 3.Nyman JS, Roy A, Tyler JH, et al. 2007. Age-related factors affecting the postyield energy dissipation of human cortical bone. Journal of orthopaedic research : official publication of the Orthopaedic Research Society 25:646–655. [DOI] [PMC free article] [PubMed] [Google Scholar]
- 4.Wang X, Shen X, Li X, et al. 2002. Age-related changes in the collagen network and toughness of bone. Bone 31:1–7. [DOI] [PubMed] [Google Scholar]
- 5.Viguet-Carrin S, Farlay D, Bala Y, et al. 2008. An in vitro model to test the contribution of advanced glycation end products to bone biomechanical properties. Bone 42:139–149. [DOI] [PubMed] [Google Scholar]
- 6.Tang SY, Allen MR, Phipps R, et al. 2009. Changes in non-enzymatic glycation and its association with altered mechanical properties following 1-year treatment with risedronate or alendronate. Osteoporosis international : a journal established as result of cooperation between the European Foundation for Osteoporosis and the National Osteoporosis Foundation of the USA 20:887–894. [DOI] [PMC free article] [PubMed] [Google Scholar]
- 7.Poundarik AA, Wu PC, Evis Z, et al. 2015. A direct role of collagen glycation in bone fracture. Journal of the mechanical behavior of biomedical materials 52:120–130. [DOI] [PMC free article] [PubMed] [Google Scholar]
- 8.Reddy GK. 2003. Glucose-mediated in vitro glycation modulates biomechanical integrity of the soft tissues but not hard tissues. Journal of orthopaedic research : official publication of the Orthopaedic Research Society 21:738–743. [DOI] [PubMed] [Google Scholar]
- 9.Gauthier R, Follet H, Langer M, et al. 2018. Relationships between human cortical bone toughness and collagen cross-links on paired anatomical locations. 112:202–211. [DOI] [PubMed] [Google Scholar]
- 10.Saito M, Fujii K, Mori Y, et al. 2006. Role of collagen enzymatic and glycation induced cross-links as a determinant of bone quality in spontaneously diabetic WBN/Kob rats. Osteoporos Int 17:1514–1523. [DOI] [PubMed] [Google Scholar]
- 11.Saito M, Fujii K, Soshi S, et al. 2006. Reductions in degree of mineralization and enzymatic collagen cross-links and increases in glycation-induced pentosidine in the femoral neck cortex in cases of femoral neck fracture. 17:986–995. [DOI] [PubMed] [Google Scholar]
- 12.Saito M, Fujii K, Marumo K JCti. 2006. Degree of mineralization-related collagen crosslinking in the femoral neck cancellous bone in cases of hip fracture and controls. 79:160–168. [DOI] [PubMed] [Google Scholar]
- 13.Tang S, Vashishth DJB. 2010. Non-enzymatic glycation alters microdamage formation in human cancellous bone. 46:148–154. [DOI] [PMC free article] [PubMed] [Google Scholar]
- 14.Tang SY, Zeenath U, Vashishth D. 2007. Effects of non-enzymatic glycation on cancellous bone fragility. Bone 40:1144–1151. [DOI] [PMC free article] [PubMed] [Google Scholar]
- 15.Follet H, Viguet-Carrin S, Burt-Pichat B, et al. 2011. Effects of preexisting microdamage, collagen cross-links, degree of mineralization, age, and architecture on compressive mechanical properties of elderly human vertebral trabecular bone. 29:481–488. [DOI] [PubMed] [Google Scholar]
- 16.Karim L, Vashishth D JPO. 2012. Heterogeneous glycation of cancellous bone and its association with bone quality and fragility. 7:e35047. [DOI] [PMC free article] [PubMed] [Google Scholar]
- 17.Hernandez CJ, Tang SY, Baumbach BM, et al. 2005. Trabecular microfracture and the influence of pyridinium and non-enzymatic glycation-mediated collagen cross-links. Bone 37:825–832. [DOI] [PMC free article] [PubMed] [Google Scholar]
- 18.Willems NM, Langenbach GE, Stoop R, et al. 2014. Higher number of pentosidine cross-links induced by ribose does not alter tissue stiffness of cancellous bone. 42:15–21. [DOI] [PubMed] [Google Scholar]
- 19.Yamamoto M, Yamaguchi T, Yamauchi M, et al. 2008. Serum pentosidine levels are positively associated with the presence of vertebral fractures in postmenopausal women with type 2 diabetes. 93:1013–1019. [DOI] [PubMed] [Google Scholar]
- 20.Banse X, Devogelaer J-P, Lafosse A, et al. 2002. Cross-link profile of bone collagen correlates with structural organization of trabeculae. 31:70–76. [DOI] [PubMed] [Google Scholar]
- 21.Banse X, Sims T, Bailey AJ JoB, et al. 2002. Mechanical properties of adult vertebral cancellous bone: correlation with collagen intermolecular cross-links. 17:1621–1628. [DOI] [PubMed] [Google Scholar]
- 22.Viguet-Carrin S, Roux J, Arlot M, et al. 2006. Contribution of the advanced glycation end product pentosidine and of maturation of type I collagen to compressive biomechanical properties of human lumbar vertebrae. 39:1073–1079. [DOI] [PubMed] [Google Scholar]
- 23.Abar O, Dharmar S, Tang SY. 2018. The effect of aminoguanidine (AG) and pyridoxamine (PM) on ageing human cortical bone. Bone Joint Res 7:105–110. [DOI] [PMC free article] [PubMed] [Google Scholar]
- 24.Ural A, Janeiro C, Karim L, et al. 2015. Association between non-enzymatic glycation, resorption, and microdamage in human tibial cortices. 26:865–873. [DOI] [PMC free article] [PubMed] [Google Scholar]
- 25.Willett TL, Sutty S, Gaspar A, et al. 2013. In vitro non-enzymatic ribation reduces post-yield strain accommodation in cortical bone. 52:611–622. [DOI] [PubMed] [Google Scholar]
- 26.Abraham AC, Agarwalla A, Yadavalli A, et al. 2016. Microstructural and compositional contributions towards the mechanical behavior of aging human bone measured by cyclic and impact reference point indentation. Bone 87:37–43. [DOI] [PMC free article] [PubMed] [Google Scholar]
- 27.Leslie WD, Rubin MR, Schwartz AV, et al. 2012. Type 2 diabetes and bone. Journal of bone and mineral research : the official journal of the American Society for Bone and Mineral Research 27:2231–2237. [DOI] [PubMed] [Google Scholar]
- 28.Samelson EJ, Demissie S, Cupples LA, et al. 2018. Diabetes and Deficits in Cortical Bone Density, Microarchitecture, and Bone Size: Framingham HR-pQCT Study. Journal of bone and mineral research : the official journal of the American Society for Bone and Mineral Research 33:54–62. [DOI] [PMC free article] [PubMed] [Google Scholar]
- 29.Nilsson AG, Sundh D, Johansson L, et al. 2017. Type 2 Diabetes Mellitus Is Associated With Better Bone Microarchitecture But Lower Bone Material Strength and Poorer Physical Function in Elderly Women: A Population-Based Study. Journal of bone and mineral research : the official journal of the American Society for Bone and Mineral Research 32:1062–1071. [DOI] [PubMed] [Google Scholar]
- 30.Karim L, Tang SY, Sroga GE, et al. 2013. Differences in non-enzymatic glycation and collagen cross-links between human cortical and cancellous bone. Osteoporosis international : a journal established as result of cooperation between the European Foundation for Osteoporosis and the National Osteoporosis Foundation of the USA 24:2441–2447. [DOI] [PMC free article] [PubMed] [Google Scholar]
- 31.Sroga GE, Vashishth D. 2011. UPLC methodology for identification and quantitation of naturally fluorescent crosslinks in proteins: a study of bone collagen. Journal of chromatography B, Analytical technologies in the biomedical and life sciences 879:379–385. [DOI] [PMC free article] [PubMed] [Google Scholar]
- 32.Kehail A, Boominathan V, Fodor K, et al. 2017. In Vivo and In Vitro Degradation Studies for Poly(3-hydroxybutyrate-co-3-hydroxyhexanoate) Biopolymer. Journal of Polymers and the Environment 25:296–307. [Google Scholar]
- 33.Reynaud C, Sommer F, Quet C, et al. 2000. Quantitative determination of Young’s modulus on a biphase polymer system using atomic force microscopy. Surface and Interface Analysis 30:185–189. [Google Scholar]
- 34.Ritchie RO, Koester KJ, Ionova S, et al. 2008. Measurement of the toughness of bone: a tutorial with special reference to small animal studies. Bone 43:798–812. [DOI] [PMC free article] [PubMed] [Google Scholar]
- 35.Munz D, Fett T. 1999. Ceramics : mechanical properties, failure behaviour, materials selection. Berlin ; New York: Springer; x, 298 p. p. [Google Scholar]
- 36.Li S, Wang M, Gao X, et al. 2015. Fracture processes in cortical bone: effect of microstructure. Proceedings of XLIII International Summer School Conference Advanced Problems in Mechanics Russia, St. Petersburg: IPME; pp. 188–210. [Google Scholar]
- 37.Ural A, Janeiro C, Karim L, et al. 2015. Association between non-enzymatic glycation, resorption, and microdamage in human tibial cortices. Osteoporosis international : a journal established as result of cooperation between the European Foundation for Osteoporosis and the National Osteoporosis Foundation of the USA 26:865–873. [DOI] [PMC free article] [PubMed] [Google Scholar]
- 38.Abraham AC, Agarwalla A, Yadavalli A, et al. 2015. Multiscale Predictors of Femoral Neck In Situ Strength in Aging Women: Contributions of BMD, Cortical Porosity, Reference Point Indentation, and Nonenzymatic Glycation. J Bone Miner Res 30:2207–2214. [DOI] [PMC free article] [PubMed] [Google Scholar]
- 39.Güerri-Fernández RC, Nogués X, Quesada Gómez JM, et al. 2013. Microindentation for in vivo measurement of bone tissue material properties in atypical femoral fracture patients and controls. 28:162–168. [DOI] [PubMed] [Google Scholar]
- 40.Sroga GE, Siddula A, Vashishth D. 2015. Glycation of human cortical and cancellous bone captures differences in the formation of Maillard reaction products between glucose and ribose. PloS one 10:e0117240. [DOI] [PMC free article] [PubMed] [Google Scholar]
- 41.Findikoglu G, Evis Z. 2015. Microhardness evaluation of non enzymatically glycated bovine femur cortical bone. Journal of Musculoskeletal Research 18. [Google Scholar]
- 42.Zhang J, Niebur GL, Ovaert TC. 2008. Mechanical property determination of bone through nano- and micro-indentation testing and finite element simulation. Journal of biomechanics 41:267–275. [DOI] [PMC free article] [PubMed] [Google Scholar]
- 43.Yin L, Venkatesan S, Webb D, et al. 2009. Effect of cryo-induced microcracks on microindentation of hydrated cortical bone tissue. Materials Characterization 60:783–791. [Google Scholar]
- 44.Mirzaali MJ, Schwiedrzik JJ, Thaiwichai S, et al. 2016. Mechanical properties of cortical bone and their relationships with age, gender, composition and microindentation properties in the elderly. Bone 93:196–211. [DOI] [PubMed] [Google Scholar]
- 45.Uppuganti S, Granke M, Manhard MK, et al. 2017. Differences in sensitivity to microstructure between cyclic- and impact-based microindentation of human cortical bone. Journal of orthopaedic research : official publication of the Orthopaedic Research Society 35:1442–1452. [DOI] [PMC free article] [PubMed] [Google Scholar]
- 46.Nalla RK, Kinney JH, Ritchie RO. 2003. Mechanistic fracture criteria for the failure of human cortical bone. Nat Mater 2:164–168. [DOI] [PubMed] [Google Scholar]
- 47.Zioupos P, Currey JD. 1998. Changes in the stiffness, strength, and toughness of human cortical bone with age. Bone 22:57–66. [DOI] [PubMed] [Google Scholar]
- 48.Acevedo C, Sylvia M, Schaible E, et al. 2018. Contributions of Material Properties and Structure to Increased Bone Fragility for a Given Bone Mass in the UCD-T2DM Rat Model of Type 2 Diabetes. Journal of bone and mineral research : the official journal of the American Society for Bone and Mineral Research. [DOI] [PMC free article] [PubMed] [Google Scholar]
- 49.Tang SY, Vashishth D. 2011. The relative contributions of non-enzymatic glycation and cortical porosity on the fracture toughness of aging bone. Journal of biomechanics 44:330–336. [DOI] [PMC free article] [PubMed] [Google Scholar]
- 50.Paccou J, Ward KA, Jameson KA, et al. 2016. Bone microarchitecture in men and women with diabetes: the importance of cortical porosity. 98:465–473. [DOI] [PubMed] [Google Scholar]
Associated Data
This section collects any data citations, data availability statements, or supplementary materials included in this article.


