Abstract
C1q/TNF-related protein 3 (CTRP3) is a cytokine known to regulate a variety of metabolic processes. Though previously undescribed in the context of bone regeneration, high throughput gene expression experiments in mice identified CTRP3 as one of the most highly upregulated genes in fracture callus tissue. Hypothesizing a positive regulatory role for CTRP3 in bone regeneration, we phenotyped skeletal development and fracture healing in CTRP3 knockout (KO) and CTRP3 overexpressing transgenic (TG) mice relative to wild-type (WT) control animals. CTRP3 KO mice experienced delayed endochondral fracture healing, resulting in abnormal mineral distribution, the presence of periosteal marrow compartments, and a nonunion-like state. Decreased osteoclast number was also observed in CTRP3 KO mice, whereas CTRP3 TG mice underwent accelerated callus remodeling. Gene expression profiling revealed a broad impact on osteoblast/osteoclast lineage commitment and metabolism, including arrested progression toward mature skeletal lineages in the KO group. A single systemic injection of CTRP3 protein at time of fracture was insufficient to phenocopy the chronic TG healing response in WT mice. By associating CTRP3 levels with fracture healing progression, these data identify a novel protein family with potential therapeutic and diagnostic value.
Keywords: Bone, CTRP3, Fracture Healing, Nonunion, Regeneration
Introduction
There are approximately 10 million bone fractures in the United States each year1. Long bone fractures heal by intramembranous and/or endochondral ossification: complex regenerative responses that in many ways recapitulate bone development. The majority of long bone fractures undergo a combination of both processes, with a centralized endochondral zone that promotes cortical reduction and mechanical stability2. Adjacent to the trauma site and within a fibrovascular envelope known as the callus, mesenchymal progenitor cells differentiate into a cartilage intermediate that is replaced by bone (osteoblasts) and is remodeled by osteoclasts3. Approximately 12% of the time, this process fails, resulting in high cost and morbidity4, yet there is a paucity of clinical options to address fracture nonunion5. Furthermore, screening methods to detect patients that may be at risk of nonunion are lacking. A more comprehensive understanding of fracture healing cell biology is required to detect early risk of nonunion, and to develop new bone-anabolic therapies.
C1q tumor necrosis factor (TNF)-related proteins (CTRPs) are a family of secretory cytokines with diverse metabolic and immunomodulatory functions6. First identified in C3H10T1/2 mouse embryonic stem cells undergoing TGFβ1-induced chondrogenesis and associated with early cartilage condensations in developing mice7, CTRP3 (alternately known as CORS26, cartducin or cartonectin), a paralog of adiponectin8; 9, has been implicated in a wide variety of physiological processes10 ranging from obesity9 to reproductive function11. Though its association with and function in growth plate cartilages have been acknowledged since its discovery, CTRP3 was not classically believed to function in bone tissue proper12. Recently, however, circulating CTRP3 levels have been positively correlated with bone mineral density13 and negatively correlated with osteoporosis in humans14, which may be related to its recently identified inhibitory role in osteoclast differentiation15. CTRP3 has also been associated with cranial suture patency16, thus functioning as a putative osteoprogenitor niche factor in an intramembranous context.
Our interest in CTRP3 was prompted by recent high throughout gene expression data from a mouse model of stabilized tibia fracture. Specifically, CTRP3 was the single most highly upregulated gene at 10 days post-fracture (dpf) relative to matched unfractured control tissue in 5 month old C57BL/6 mice, upregulated 5.77±0.69-fold (NCBI GEO accession GSE99388, probe 10423080)17. In older, 25 month old, animals in the same dataset, CTRP3 was the 3rd most highly upregulated gene at 10dpf, upregulated 6.37±0.43-fold. A complementary study revealed that CTRP3 was the 30th most upregulated gene in sorted αSMA-Cre:tdTomato osteochondral progenitor cells derived from 6dpf callus tissue: upregulated 5.38±0.32-fold (NCBI GEO accession GSE45156, probe ILMN_2863849)18. Thus, elevated CTRP3 levels are characteristic of the fracture callus environment in general, and osteochondral progenitor cells in particular, and we hypothesized that CTRP3 has a positive regulatory function in endochondral bone healing.
We have completed a comprehensive analysis of the role of CTRP3 in bone; herein we describe alterations in bone morphology and fracture healing in CTRP3 knockout and transgenic overexpressing mice. CTRP3 impacts bone regeneration by altering callus maturation and remodeling.
Methods
Animal Models
Mice of three genotypes were used for this study: CTRP3 knockout19 (KO), wild-type (WT) and CTRP3 ubiquitous overexpressing transgenic20 (TG). All of these animals were bred on a C57BL/6J background and have grossly normal basal phenotypes. Mice in the adult bone phenotyping study were produced in heterozygous crosses, whereas mice in the fracture study were bred by subsequent within-strain crosses. Animals of both sexes were used whenever available, sex was treated as an independent variable, and procedure order was randomized. All experiments were approved by the institutional animal care and use committees of the University of Michigan and Johns Hopkins University.
Surgeries were performed under isoflurane anesthesia, and subcutaneous 0.1mg/kg buprenorphine was given in 12-hour intervals for peri-/post-operative pain management. Animals were returned to standard laboratory group housing following surgery and were provided with ad libitum food/water plus environmental enrichment, monitored daily. Euthanasia was performed by CO2 asphyxiation followed by cervical dislocation. Investigators were blinded from genotype/treatment during surgeries and analyses. The acronym “dpf” stands for “days post fracture”, and “dpd” for “days post defect”. At time of dissection, limbs were sorted into two groups: samples destined for qPCR were processed immediately, and samples destined for μCT and histology were fixed in 10% buffered formalin. At 20dpf, both limbs of males were fixed and sent through the μCT/histology pipeline, thus qPCR was not performed.
Bilateral transverse mid-diaphysial fractures, stabilized by intramedullary pins, were induced in mice aged 20±1 weeks using the Zondervan apparatus21. Samples were harvested at 5, 10 or 20dpf. The fracture procedure was then repeated in WT mice aged 34±3 weeks to test a systemic protein delivery strategy; animals in this cohort received either phosphate buffered saline (PBS) vehicle (Vh) or 5.0μg recombinant human CTRP3 (rhCTRP3) (R&D Systems, produced in mouse NS0 cells) in PBS and harvested at 21dpf. For both studies, samples exhibiting severe comminution as determined by x-ray or μCT were excluded from all outcomes.
Calvarial defects were induced in mice aged 23±2 weeks using a piezoelectric drill (Mectron) fitted with an OT11 osteotomy insert in accordance with our previous work22. Defects were then plugged with 4mm diameter, 1mm thick absorbable gelatin sponges (Pfizer Gelfoam) laden with PBS vehicle (Vh) or 1.75μg of rhCTRP3 in PBS and closed using surgical glue. Samples were harvested at 43dpd.
Micro-computed Tomography (μCT)
Samples were scanned in a GE Healthcare eXplore Locus SP in PBS at 80kV with 18μm voxel size. Images were reconstructed and analyzed in MicroView (Parallax Innovations). For fracture samples, the callus was manually contoured every 10 slices to select the entire callus volume while excluding cortical bone and intramedullary volume. For tibiae, trabecular bone was analyzed in a 60-slice ROI contoured every 3 slices, beginning 6 slices distal to the end of the proximal growth plate, and mid-diaphyseal cortical bone was analyzed in a 33-slice auto-contoured ROI beginning 33 slices distal to the tibia/fibula junction. For calvarial defects, 3.33×3.33×1.66mm cylindrical ROIs were centered over each defect for analysis. All bone analyses were conducted at a threshold of 1650 Hounsfield Units (calibrated via daily air, water and hydroxyapatite phantom scans); isosurface renderings for figures were produced at this threshold. Fracture μCT isosurfaces in figures were produced for the entire sample, not just the contoured callus ROI.
For adult bone phenotyping, samples were scanned in a Bruker Skyscan 1272 at 65kV with an isotropic voxel size of 10μm. Images were reconstructed with NRecon and analyzed in CtAn. In the femur, trabecular bone parameters were assessed in a 2mm (200 slices) ROI 500μm proximal to the growth plate. The ROI was manually contoured every 10–15 slices. Cortical bone parameters were assessed in a 500μm ROI centered on the femoral mid-diaphysis. In the spine, trabecular bone parameters were assessed between the cranial and caudal growth plates.
Histology
The proteoglycan-rich extracellular matrix characteristic of cartilage was stained by routine Safranin O histology. Full-length sections were imaged and stitched using a Nikon Eclipse Ni upright microscope equipped with a motorized stage. Callus areas were manually contoured in Adobe Photoshop, and cartilage was segmented by color thresholding and analyzed in Fiji (ImageJ). The number of cortices (out of a possible 4) with adjacent cartilage condensations (determined morphologically) were also manually counted at 5dpf.
Osteoclasts were stained for tartrate-resistant acid phosphatase (TRAP) using a commercial staining kit (Sigma 387A). For quantitation, within 24 hours of staining, 7 random 480×720μm fields of view residing inside the callus boundaries were imaged and analyzed in TrapHisto23. Datapoints represent mean values across these 7 images for each animal. Figures were produced using full-length stitched images.
Quantitative PCR (qPCR)
Two types of bone samples were processed for qPCR. For femoral fracture gene expression analysis, each femur was dissected, the stabilizing pin was removed, cortical bone proximal and distal to the callus was clipped, and the isolated callus was frozen in 1mL of TRIzol Reagent (Invitrogen). For tibia gene expression analysis, each tibia was dissected and frozen whole in TRIzol. All samples were then homogenized in a Bertin Precellys bead mill using 2mL MK28-R hard tissue lysis tubes. Total RNA was isolated by standard acid guanidinium thiocyanate-phenol-chloroform extraction and purified using spin columns (Qiagen RNeasy Midi) with on-column DNase digestion. RNA was reverse-transcribed using a high-capacity RNA-to-cDNA kit (Applied Biosystems) and 80ng of cDNA per reaction was run in duplicate in an Applied Biosystems real-time PCR instrument with SYBR Select reagents, with ACTB as a housekeeping gene. Relative gene expression is reported as 2−dCt, which facilitates reference sample-free interpretation of transcript levels across multiple timepoints, and statistics were computed using dCt values.
Enzyme-linked Immunosorbent Assay (ELISA)
Serum concentrations of mouse CTRP3 were measured using a commercial sandwich ELISA kit (LifeSpan Biosciences F39096). Among the cohort of mice receiving subcutaneous Vh or 5.0μg rhCTRP3 at time of fracture, 15–25μL of whole blood was collected from the lateral tail vain at time of surgery (0dpf) and at 7dpf immediately before euthanasia. Serum was isolated by centrifugation and analyzed at 1:500 dilution. Optical densities were recorded at 450nm in a Molecular Devices SpectraMax M5 plate reader and normalized using a standard curve. Values reported represent protein concentrations in serum.
Human Cell Culture
Two human primary bone marrow-derived stromal cell (MSC) lines were commercially obtained and subcultured for 4–6 passages in media containing 16.5% FBS in a 37°C CO2 incubator using standard tissue culture methods. 50,000 cells per well were plated in 24-well format and transfected under serum-free conditions supplemented with insulin-transferrin-selenium (Gibco). Transcriptional knockdown was induced using 1.25μL DharmaFECT 1 transfection reagent (Dharmacon) and 2μL of siRNA mix (Santa Cruz). Experimental groups were: no treatment, scrambled siRNA, siRNA targeting TNAP, or siRNA targeting CTRP3. 4 days into an osteogenesis assay, plates were stained using a colorimetric alkaline phosphatase staining kit (Sigma 86C), imaged using a flatbed scanner and interpreted qualitatively.
Statistical Analysis
Statistical significance was determined by ordinary two-way ANOVA (genotype/treatment and sex as independent variables) with Tukey’s multiple comparisons test, single pooled variance. Multiplicity adjusted p-values are reported for each genotype/treatment comparison, with significance set at p<0.05. When sex was found to be a significant source of variation, it is noted in the text. When applicable, bilateral samples from single animals were treated as independent samples. Datasets containing only two experimental groups and/or lacking inclusion of both sexes were analyzed by one-way ANOVA and/or without multiple comparisons. In figures, p<0.05 is graphically annotated by horizontal solid lines. Individual scatterplot datapoints are shape/color coded by sex: maroon up-triangles represent samples derived from females and navy down-triangles represent samples derived from males. Datapoints are overlaid with mean and standard deviation bars.
Results
CTRP3 Levels Associate with Accelerated Fracture Healing
μCT imaging revealed structural alterations in the fracture healing timeline resulting from genomic manipulation of endogenous CTRP3 levels (Figures 1 and S1). At 5dpf the KO group had 70% lower callus bone volume/total volume (BV/TV) (p<0.001) and 27% lower bone mineral density (BMD) (p=0.040) versus the WT group, whereas the TG group had 15% lower tissue mineral density (TMD) (p=0.020). At 10dpf and 20dpf, the only points of significance were between the KO and TG groups. At 10dpf the TG group had 27% greater callus TV (p=0.032), 24% greater bone mineral content (BMC) (p=0.016) and 25% greater tissue mineral content (TMC) (p=0.026) than the KO group. At 20dpf the TG group had 38% lower callus TV (p=0.004), 48% greater BV/TV (p=0.002) and 9% greater TMD (p=0.039). Qualitatively, these changes in callus mineral distribution are predominantly localized to the mid-callus region, adjacent to the site of cortical disruption (Figure 1A). Sex was a significant source of variation at 5dpf for TMD (p=0.004) and at 20dpf for BV (p=0.024) and TMC (p=0.008). We observed a nonunion-like phenotype in the KO group at 20dpf (Figure 2).
Figure 1. CTRP3 levels associate with callus remodeling.
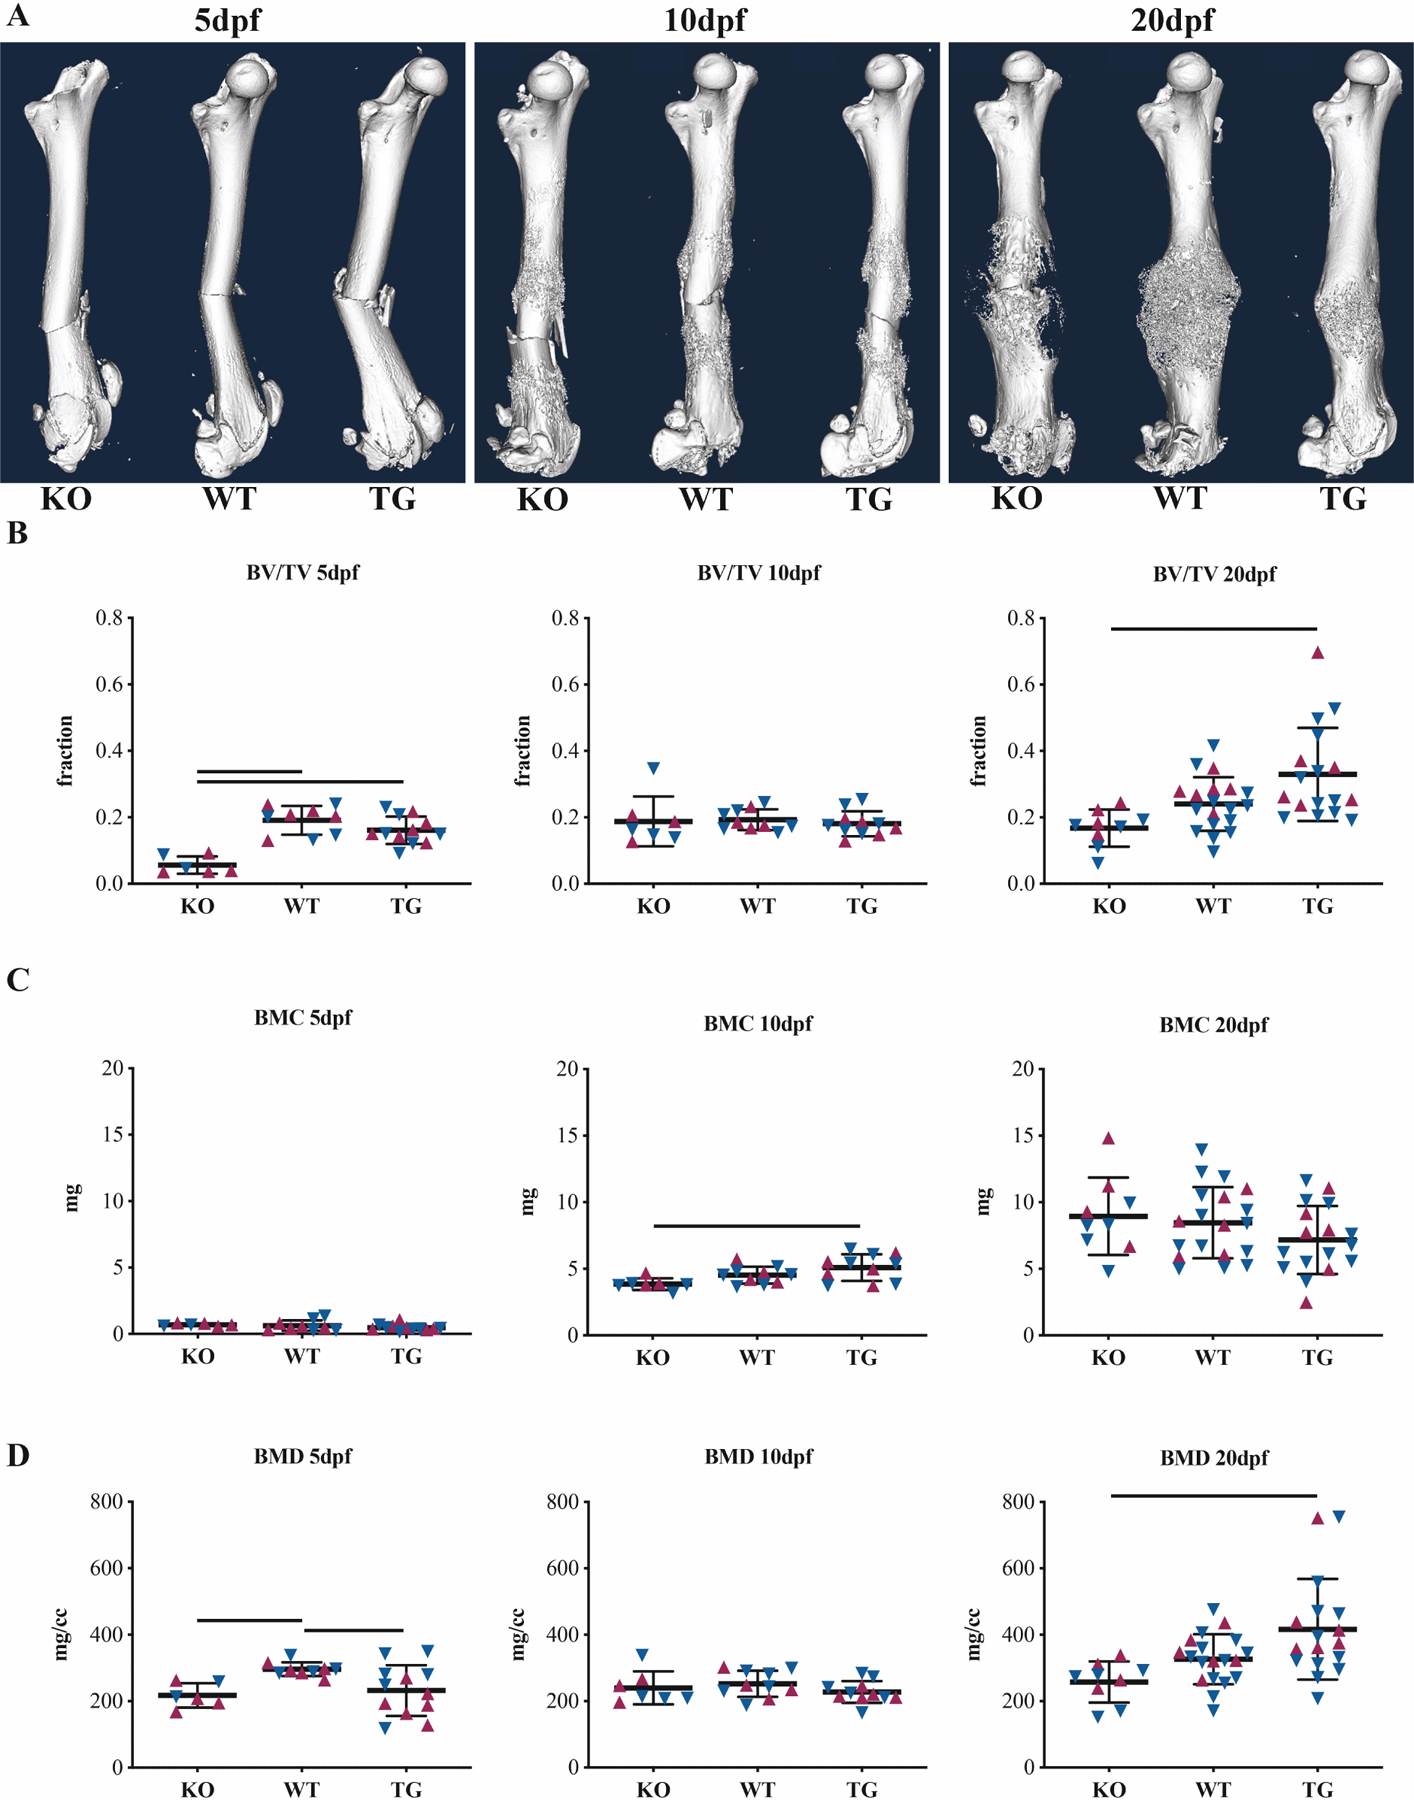
(A) Representative whole-femur μCT isosurface renderings at 5, 10 and 20dpf for CTRP3 KO, WT and TG mice. Femurs were scanned after removal of intramedullary pins. Apparent bends in 5dpf bones are artifacts of this removal: fractures are straight in vivo. Quantitative callus μCT data for (B) bone volume fraction (BV/TV), (C) bone mineral content (BMC) and (D) bone mineral density (BMD). Solid lines represent p<0.05 by genotype. Maroon up-arrows represent female mice and navy down-arrows represent male mice. For additional quantitative measures of calluses, see Fig S1.
Figure 2. CTRP3 KO mice exhibit a nonunion-like fracture phenotype.
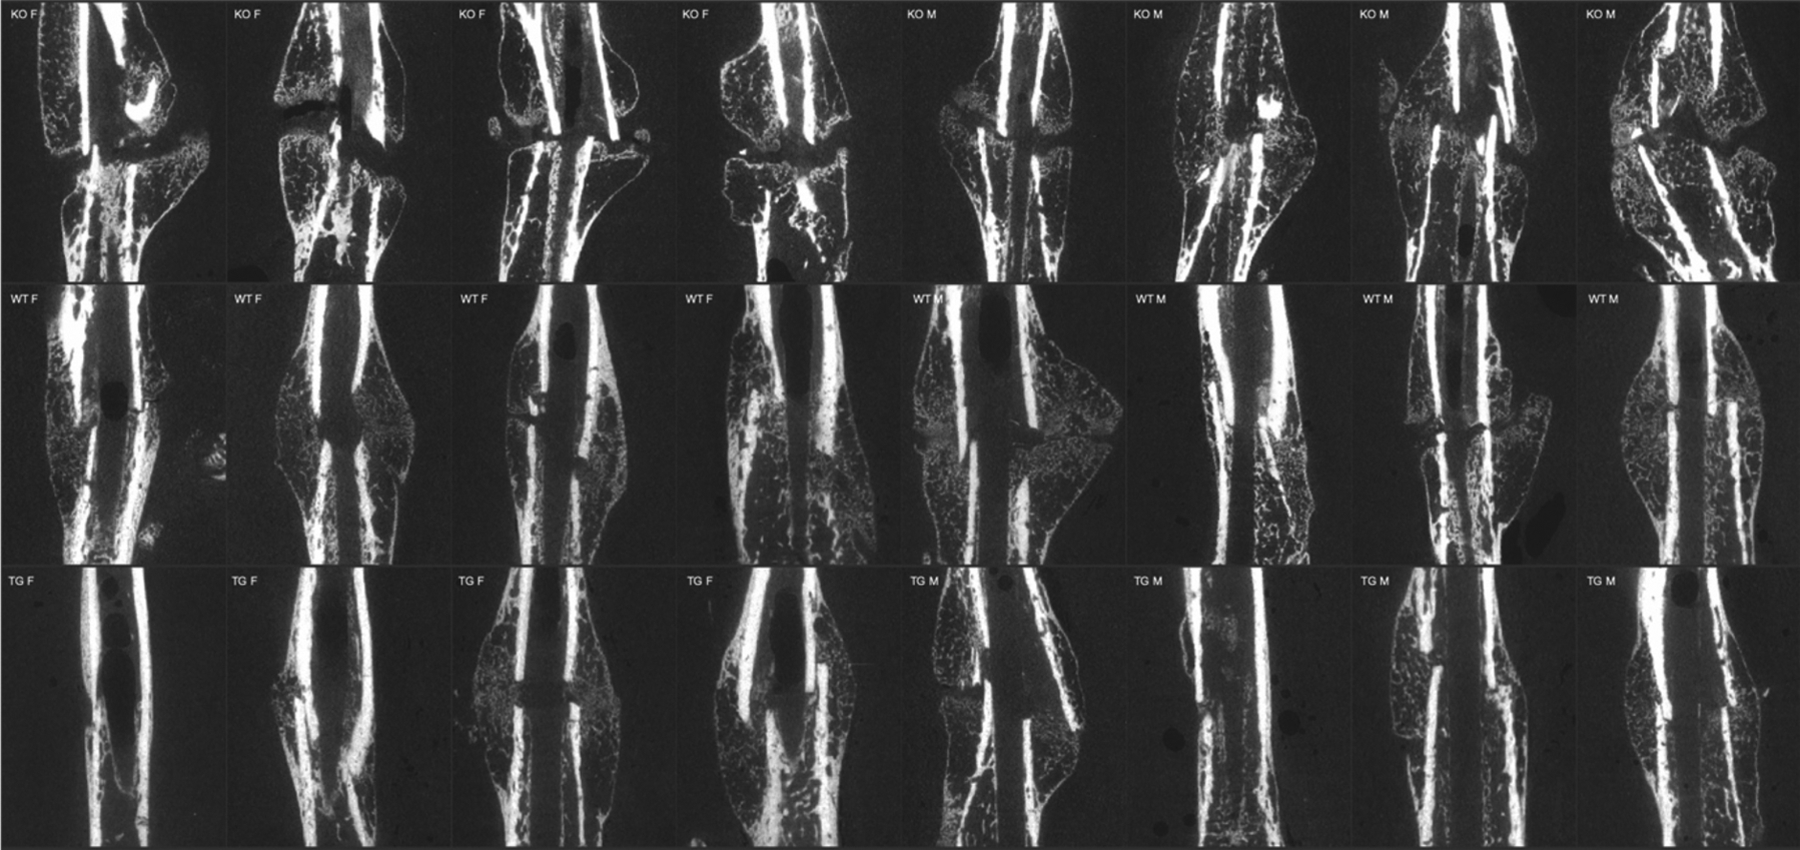
Representative 2-D virtual cross-sections from μCT demonstrate impaired mid-callus endochondral ossification at 20dpf, resulting in callus mineral discontinuity. 4 females and 4 males are shown per genotype.
Samples within the KO group prematurely developed cartilage condensations that weakly stained by Safranin O histology (Figures 3 and S2). As a result, cartilage area (CA) and CA/total area (TA) were significantly increased in the KO group at 5dpf (p=0.005 and p=0.037, respectively, versus WT). These condensations, on average, bordered 3/4 of the cortices in the KO group, versus 1/4 in the WT group and 0.5/4 in the TG group. This difference in cartilage composition did not persist at later timepoints, with a rich bloom of cartilage (nearly 40% by volume) visible in all groups at 10dpf. Callus TA was 31% lower in the TG group versus the KO group at 20dpf (p=0.043). Sex was not a significant source of variation. Voids containing periosteal marrow were histologically observed within the callus capsule at 20dpf in the KO group.
Figure 3. CTRP3 regulates callus cartilage formation and resorption.
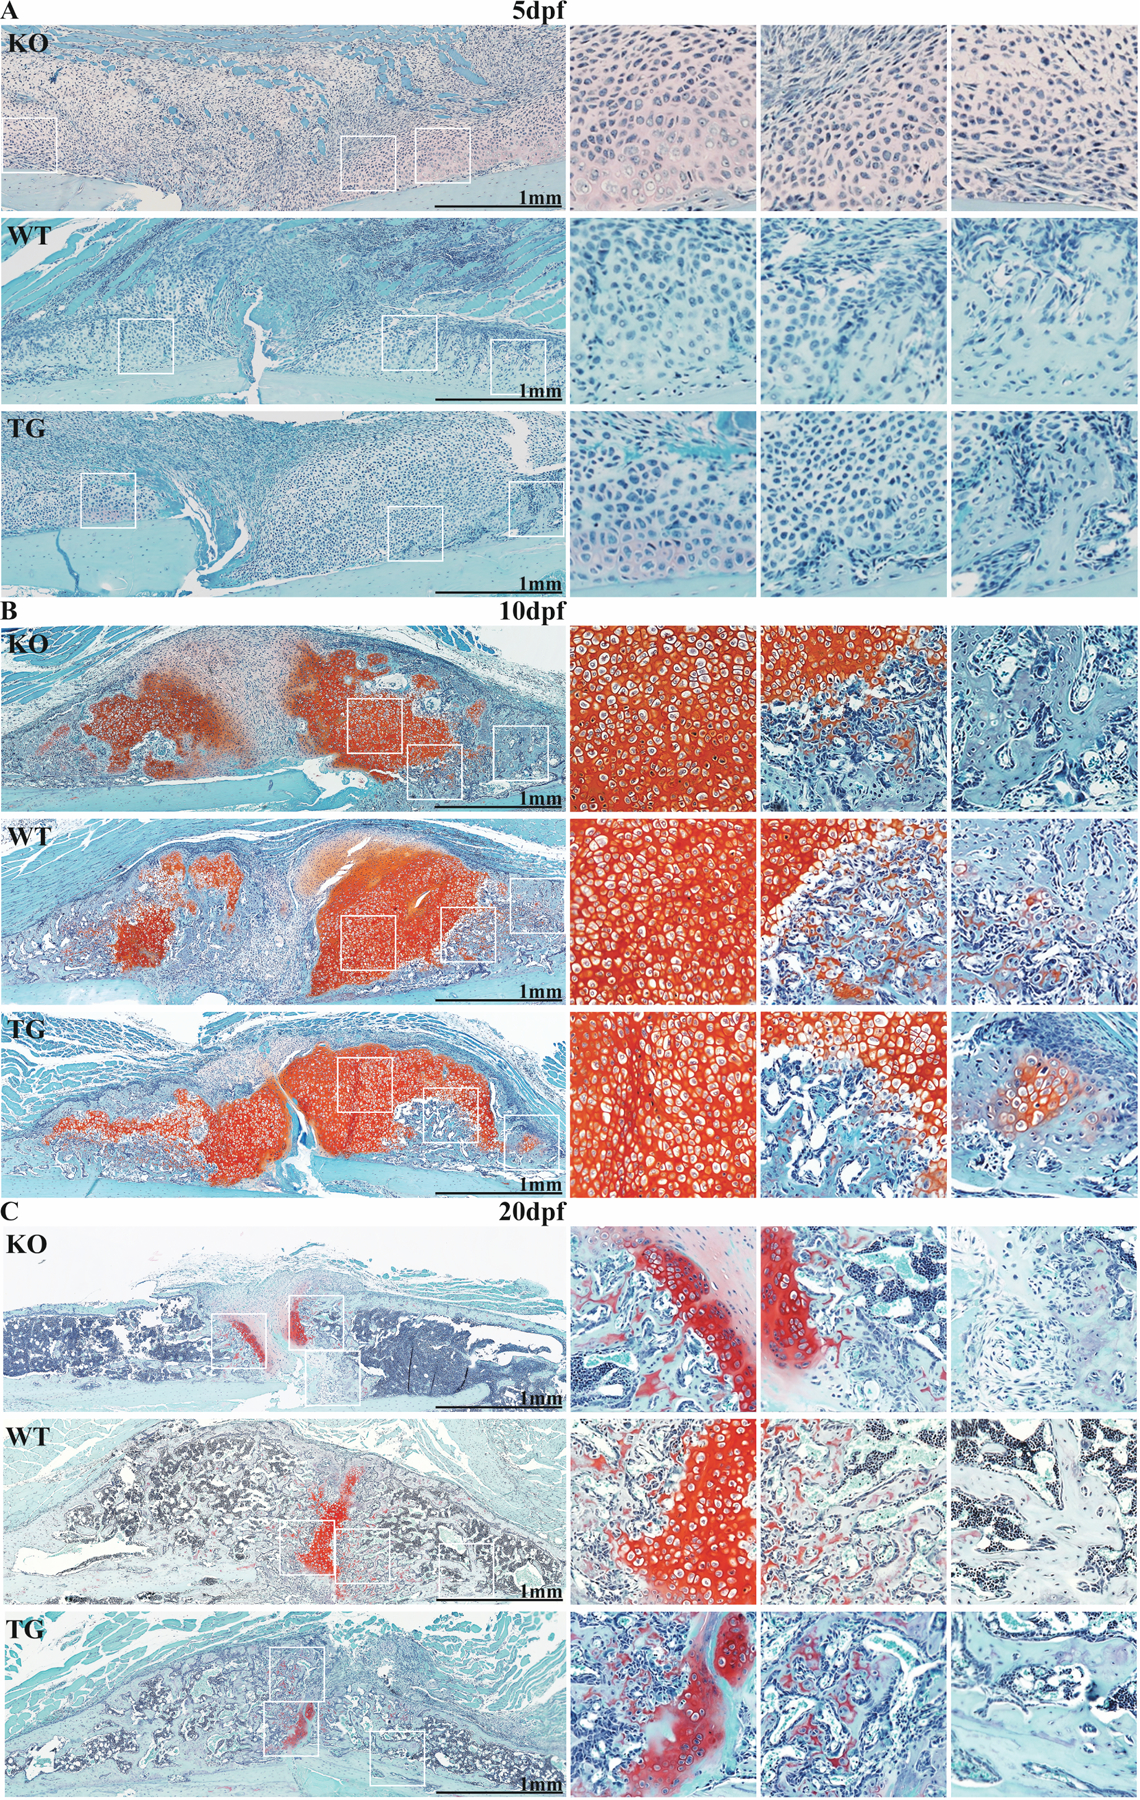
Safranin-O micrographs from CTRP3 KO, WT and TG mice at (A) 5dpf, (B) 10dpf and (C) 20dpf. Images are oriented to show one side of the callus in longitudinal section with cortical bone at the bottom (light blue staining). Three selected areas of callus (white squares) are magnified on the right of each panel. For associated histomorphometry, see Fig S2.
Expression changes were detected in marker genes representing various phases of the fracture healing response (Figure 4). Versus the WT group, the TG group expressed 4.8x more CTRP3 at 5dpf, 7.7x more CTRP3 at 10dpf, and 160x more CTRP3 at 20dpf (all with p<0.001). The KO group presented with dCt values at the edge of the detection range, confirming the genetic model. ACTA2 expression was 2.5x higher in the KO group versus WT at 10dpf (p<0.001), a trend that reversed by 20dpf when the typical expression pattern of ACTA2 had resolved (p=0.001). SP7 expression began earlier in the KO group and was 3.1x higher versus the WT group at 10dpf, but due to variable expression only achieved statistical difference in relation to the TG group (p<0.001). COL2A1 expression trended higher at 5dpf in the TG group, 1.8x higher than the KO group (p=0.049). VEGF expression at 10dpf was reduced by 78% in the KO group versus WT (p=0.005) (Figure S3). At 10dpf, sex was a significant source of variation for ACTA2 (p=0.004), SP7 (p=0.044) and VEGF (p=0.024).
Figure 4. CTRP3 alters gene expression profiles during healing.
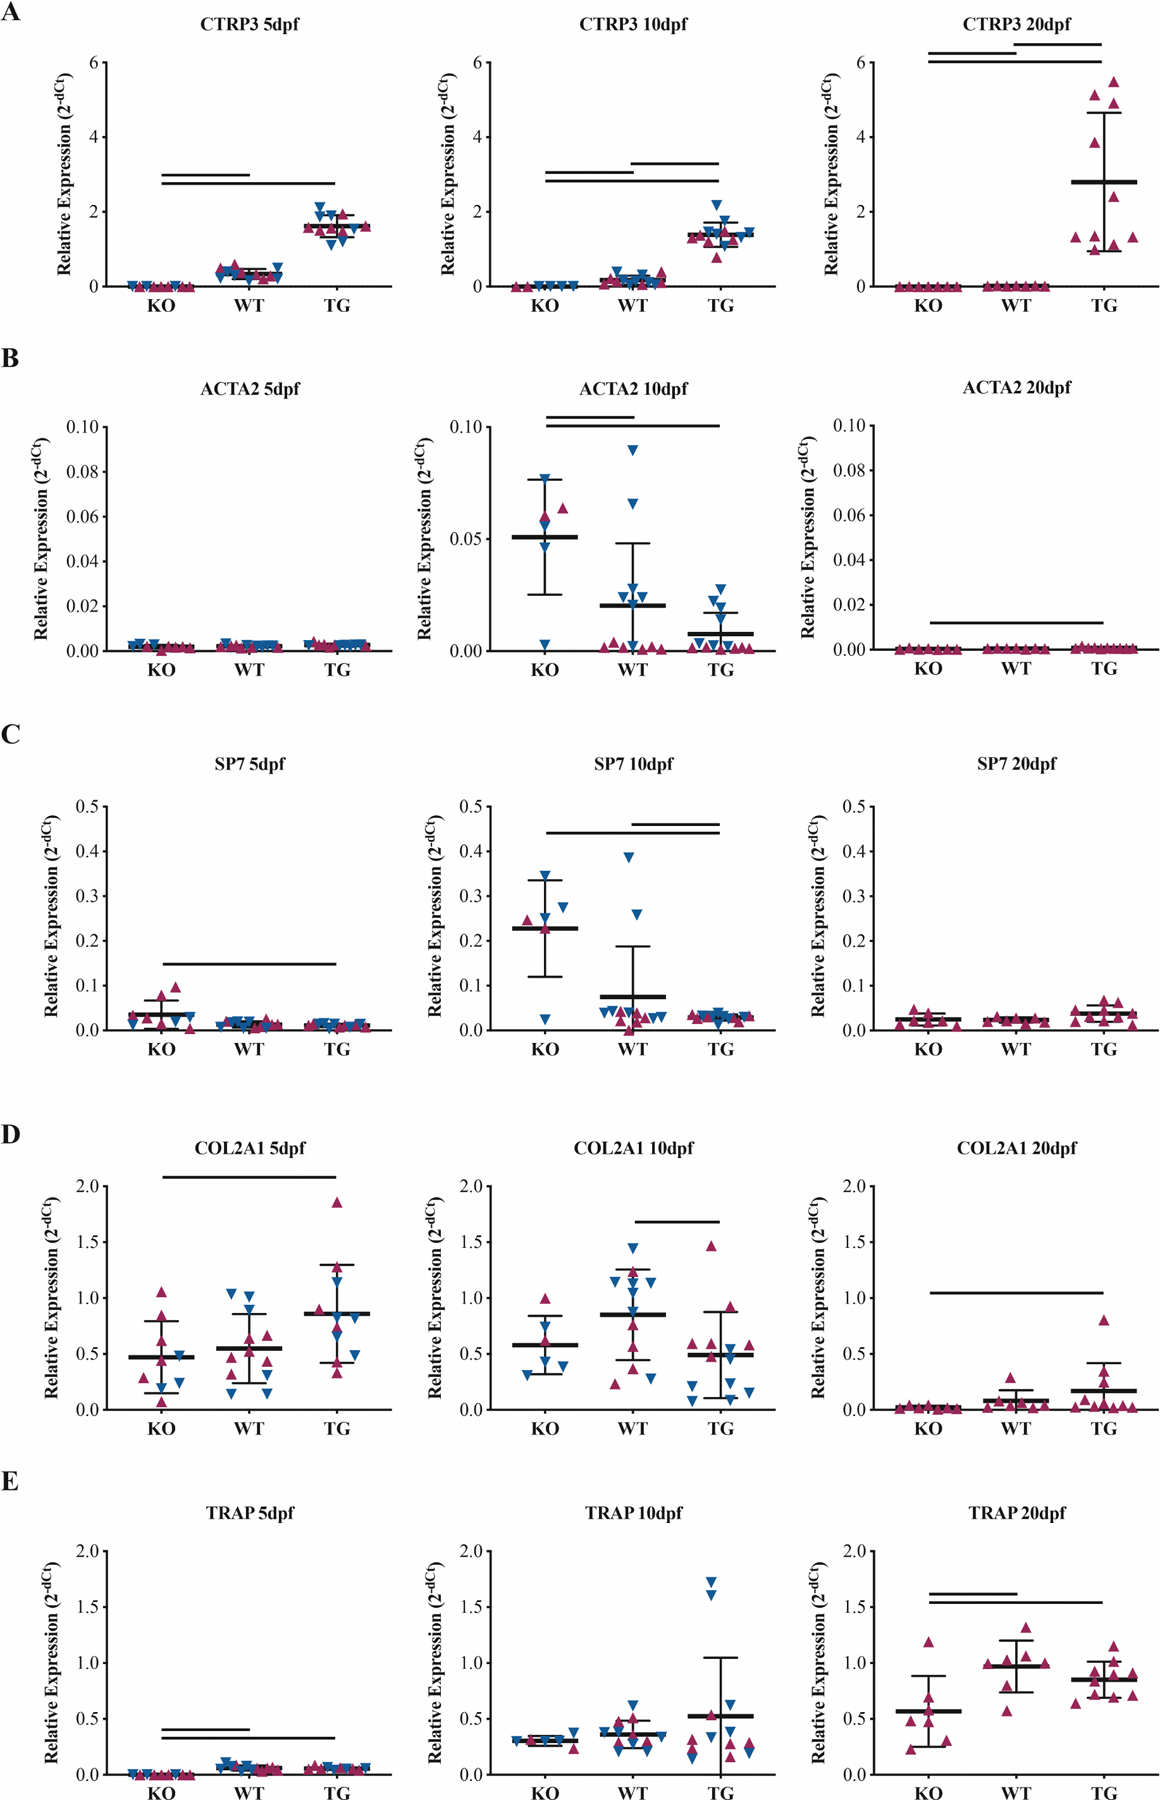
Whole-callus mRNA expression of (A) CTRP3, (B) α-actin-2 (ACTA2), (C) osterix (SP7), (D) collagen-II (COL2A1) and (E) tartrate-resistant acid phosphatase (TRAP) vary based on CTRP3 genotype. Relative expression is presented at 2−dCt with ACTB as a housekeeping gene. Statistics were run on dCt values. Solid lines represent p<0.05 by genotype. Maroon up-arrows represent female mice and navy down-arrows represent male mice.
Samples within the KO group also experienced impaired osteoclastic remodeling, observed by TRAP staining at 20dpf (Figure 5). The KO group had 47% fewer osteoclasts (N.Oc) (p=0.002), 71% decreased osteoclast perimeter (Oc.Pm) (p<0.001), 68% decreased osteoclast surface/bone surface Oc.S/BS (p<0.001) and 41% fewer N.Oc/BS (p<0.001) versus the WT group. While the TG group had greater bone area (B.Ar) than either the WT or KO groups (p=0.005, versus WT), TG sample osteoclast number and distribution did not differ from that of WT. Sex was a significant source of variation for B.Ar (p=0.015).
Figure 5. CTRP3 KO results in reduced osteoclast number.
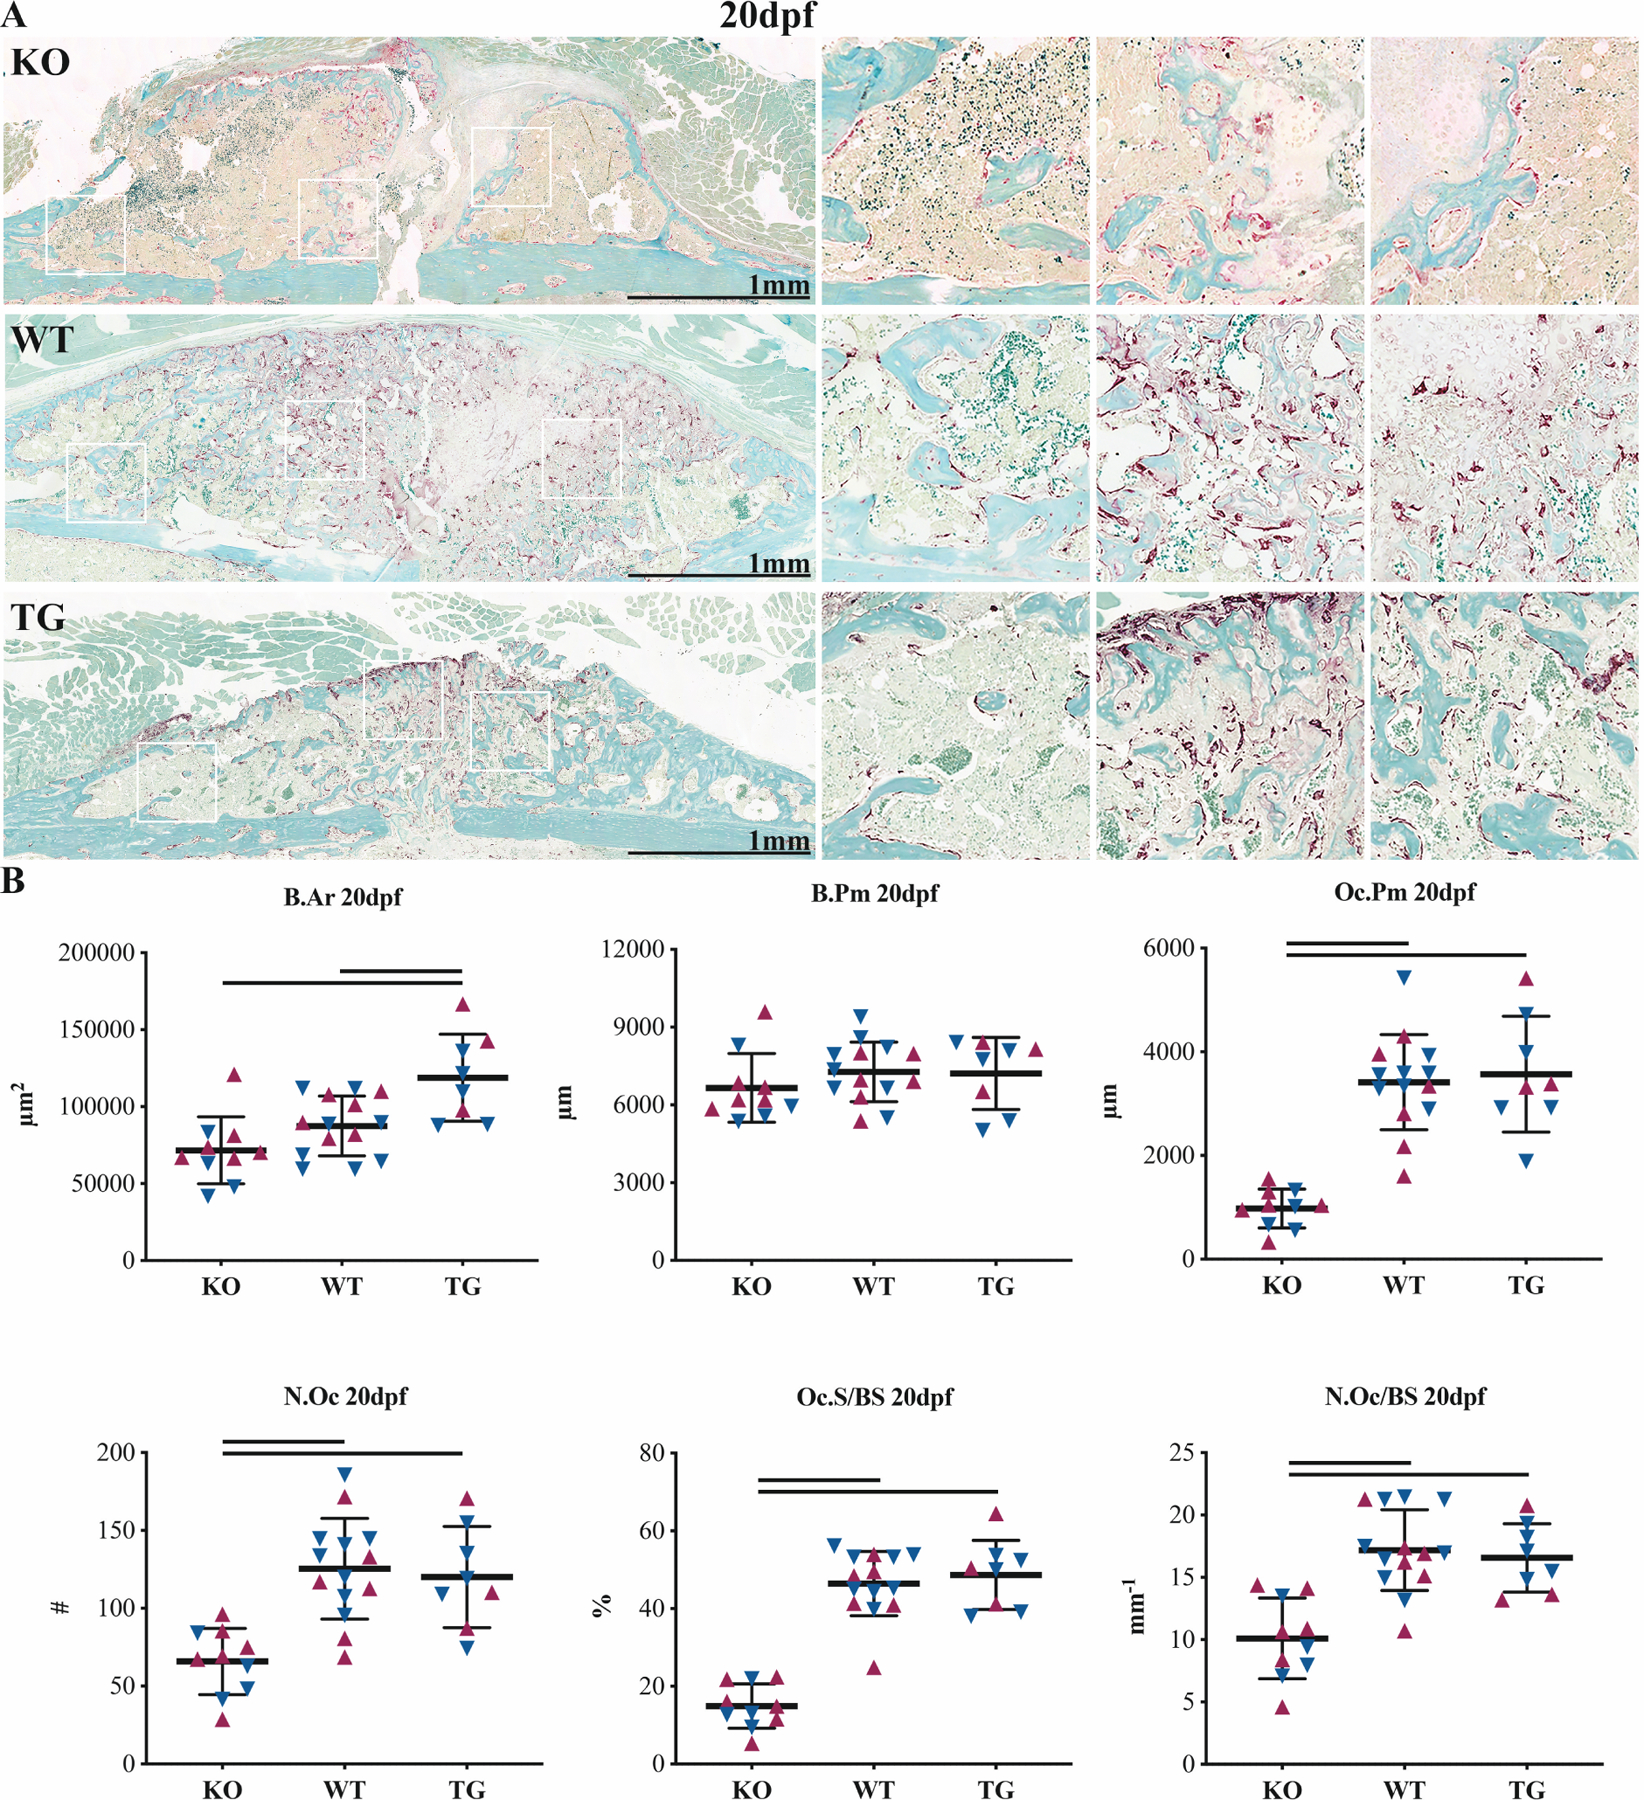
TRAP staining (A) micrographs and (B) histomorphometry at 20dpf. Outputs include bone area (B.Ar), bone perimeter (B.Pm), osteoclast perimeter (Oc.Pm), osteoclast number (N.Oc), osteoclast surface coverage (Oc.S/BS) and osteoclast number per linear surface (N.Oc/BS). Solid lines represent p<0.05 by genotype. Maroon up-arrows represent female mice and navy down-arrows represent male mice.
Single-Dose Exogenous CTRP3 Protein Does Not Improve Bone Healing
A single subcutaneous injection of 5μg rhCTRP3 at time of fracture did not induce structural changes in femoral callus bone composition at 21dpf by μCT analysis (Figure 6). Sex was a significant source of variation for TV (p=0.003), BV (p<0.001), BMC (p<0.001), BMC (p=0.016), TMC (p=0.001) and TMD (p=0.040). Tibiae from these animals tended to have higher trabecular BV/TV (Tb.BV/TV), but this did not reach statistical significance (p=0.088) (Figure S4). Sex was a significant source of variation for all outcomes except trabecular thickness (Tb.Th) and cortical area/total area (Ct.Ar/Tt.Ar). Gene expression profiles of tibiae showed 2.1x greater expression of CTRP1 in the 5μg rhCTRP3 group at 21dpf (p=0.023). Expression of CTSK trended higher in the rhCTRP3 group (p=0.053) (Figures S5–6). Sex was a significant source of variation for CTRP3 gene expression only (p=0.047).
Figure 6. Single injection of CTRP3 protein does not phenocopy TG.
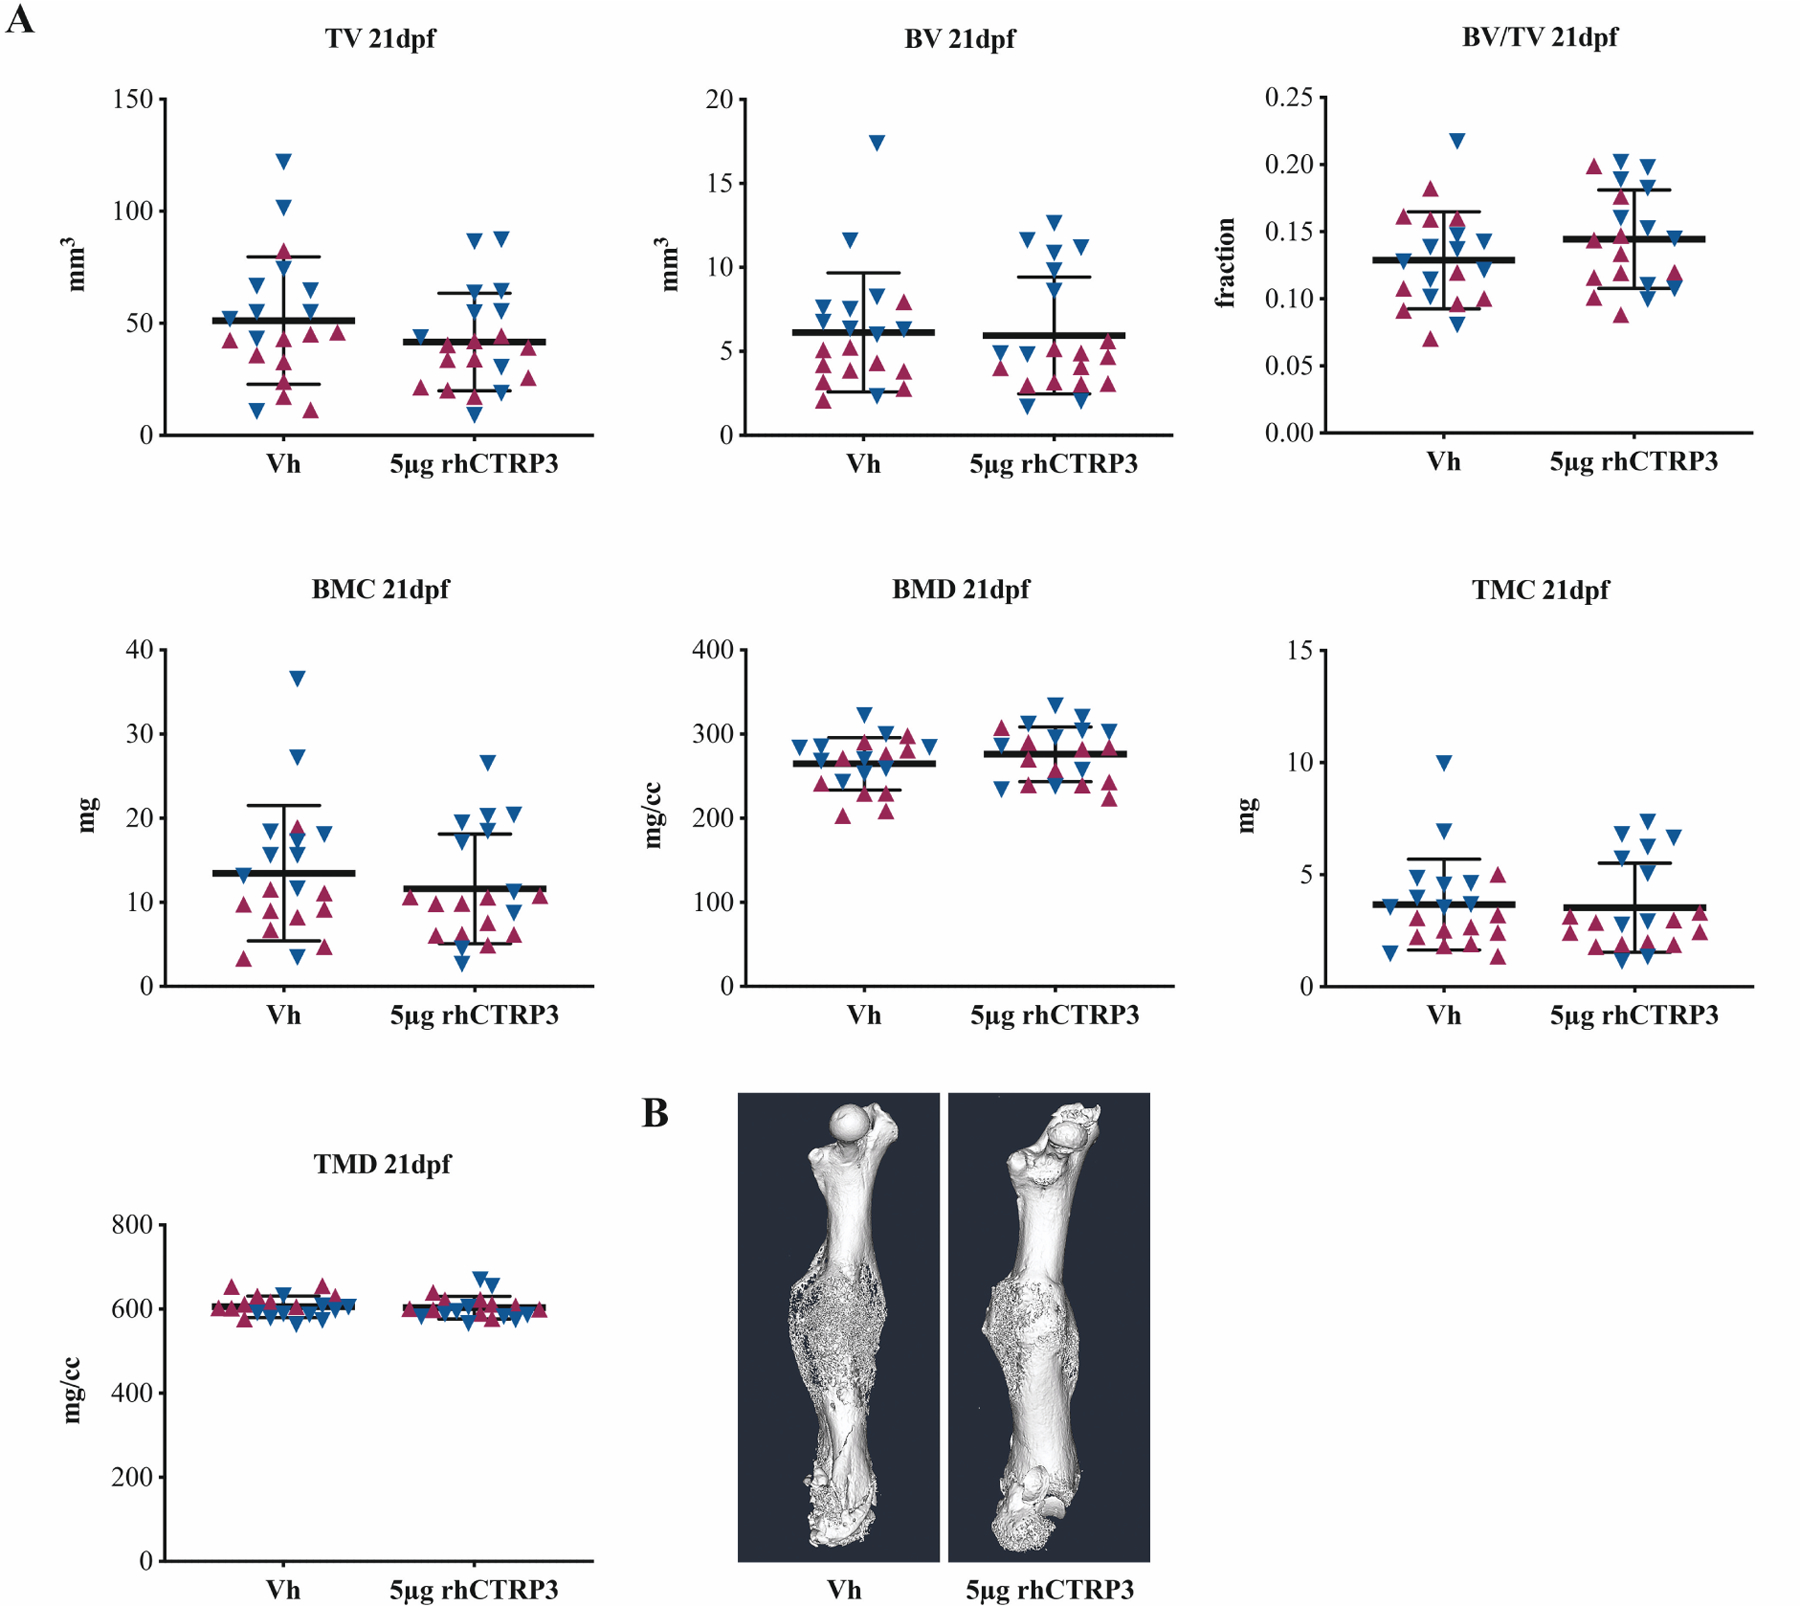
μCT (A) quantitation and (B) isosurface renderings at 21dpf in mice that received either subcutaneous Vh or 5μg rhCTRP3 protein at time of surgery. Outputs include total volume (TV), bone volume (BV), bone volume fraction (BV/TV), bone mineral content (BMC), bone mineral density (BMD), tissue mineral content (TMC) and tissue mineral density (TMD). Maroon up-arrows represent female mice and navy down-arrows represent male mice.
Serum protein levels of CTRP3 tend to rise post-fracture, but significant inter-subject variation precluded statistical significance (Figure S7). In the Vh group, serum CTRP3 at 7dpf was 2.8x the concentration at 0dpf. We were unable to detect variations in serum protein between the Vh and rhCTRP3 groups at 7dpf.
Intraoperative delivery of 1.75μg rhCTRP3 to calvarial defects did not induce changes in defect healing at 43dpd by μCT analysis (Figure S8). Sex was a significant source of variation for BV (p=0.033), BMC (p=0.016), BMD (p=0.022) and BV/TV (p=0.039).
CTRP3 KO and TG Mice Present with Minor Adult Skeletal Phenotypes
Relative to WT littermates, the KO group developed 7.2% lower BV/TV (p=0.037) and 4.9% lower trabecular number (Tb.N) (p=0.024) at the distal femur at 12wks (Figure S9). There was no apparent phenotype in cortical bone (Figure S10). Sex was a significant source of variation for all trabecular and cortical outcomes.
Relative to WT littermates, the TG group developed 13% lower BV/TV (p<0.001) and 12% lower Tb.N at the distal femur at 12wks (Figure S11). These differences were resolved at 12wks and 24wks. Sex was a significant source of variation for all trabecular measures except trabecular spacing (Tb.Sp) at 5.5wks and Tb.Th at 12wks. In cortical bone, the TG group developed 5.7% lower TA (p=0.006), 5.6% lower marrow area (MA) (p=0.034), 5.9% lower Ct.A (p=0.001) and 2.6% lower Ct.Th (p=0.019) at 5.5wks, resulting in a 12% decrease in polar moment of inertia (pMOI) (p=0.001) (Figure S12). At 24wks, the TG group developed 4.7% lower Ct.Th (p=0.007) and 2.5% lower Ct.A/TA (p=0.002). Sex was a significant source of variation of all cortical measures except Ct.A/TA and MA at 5.5wks, Ct.Th and Ct.A/TA at 12wks, and Ct.Th at 24wks. The spine was also phenotyped in the TG group at 24wks, with sex but not genotype reaching statistical significance for all measures (Figure S13).
CTRP3 siRNA Knockdown Does Not Impair Early MSC Osteoblastogenesis
In stable primary human MSC lines, knockdown of CTRP3 gene expression using siRNA did not alter staining versus negative controls in a standard colorimetric alkaline phosphatase assay (Figure S14). The positive control, siRNA knockdown of TNAP, exhibited reduced staining.
Discussion
CTRP3 levels are associated with accelerated fracture healing. While the total quantity of bone as assessed by μCT was not different across the KO, WT and TG groups at 20dpf, the callus sizes, mineral distribution and osteoclast coverage were markedly different. The hallmark of the CTRP3 TG phenotype is accelerated remodeling. μCT and histomorphometry demonstrated decreased callus volume in the TG group, which was accompanied by increases in BV/TV as well as both BMD (overall density of mineral within the whole callus) and TMD (density of mineral within the bone tissue itself). The bone surface coverage of osteoclasts in the TG group was not different from the WT group.
The KO group experienced delayed bone healing resembling nonunion. Although Safranin-O histomorphometry revealed normal cartilage soft callus formation at 10dpf, we observed defects in mineralization within the classically endochondral zone in the KO group at 20dpf. Marrow tissue voids were consistently seen within central regions of the hard callus, where the cartilage template had resorbed but was not replaced by bone. This suggests that CTRP3 KO causes deficiencies in the recruitment and maturation of osteoblast progenitor cells and/or chondroblast transdifferentiation. Gene expression profiling showed concurrent increases in the ACTA2 and SP7 in the KO group at 10dpf, suggesting immaturity of osteoblast progenitors and osteoblasts. In future studies, it will be important to assess functional outcomes at timepoints later than 20dpf, including the mechanical repercussions of delayed/non-union in the CTRP3 KO group.
This study was unable to determine whether the reduction in osteoclast number in the KO group is a hematopoietic phenotype in its own right, or is caused by failure of the overall callus to progress into the remodeling stage; if bone fails to form in the central part of the callus, then osteoclast recruitment would be unnecessary. CTRP3 regulates macrophage phenotype commitment and transformation24, and future investigation of osteoclastogenesis in the context of CTRP3 deficiency would aid in the interpretation of this study. It is also possible that modification of the initial inflammatory milieu in CTRP3 KO mice could contribute to delay of the entire healing trajectory, though the lack of a phenotype in the rhCTRP3 delivery experiment suggests immunomodulation may not be the primary cause of the fracture healing phenotype.
Somewhat surprisingly, the KO and TG groups lack significant adult bone phenotypes. We interpret this divergence between development/homeostasis and healing as a product of the differing microenvironment of injury. The healing response is both inflammatory and hypoxic. CTRP3 levels may interfere with the metabolic ability of osteoblast lineage cells to adapt to changes in oxygen tension and nutrient availability.
In the microarray that prompted this study17, CTRP6 and CTRP1 were the second- and third-most highly expressed CTRP family genes, and we hypothesized that CTRP1 and CTRP6 might compensate for abnormal CTRP3 expression in our genetic fracture model. We rejected this hypothesis when both genes were found to be expressed commensurate with decreased CTRP3 in KO mice, and CTRP1 expression was upregulated in the tibiae of animals treated with rhCTRP3 protein relative to Vh controls. While the functional relationships between the various members of the CTRP family remain to be elucidated, our data suggest there may be a minor positive feedback loop or regulatory activity of CTRP1 and CTRP6 downstream of CTRP3. One might predict more extreme phenotypes resulting from compound targeting of multiple CTRP family members.
Administration of rhCTRP3 did not improve healing outcomes in either of two mouse bone injury models. A protein alignment, performed in NCBI BLASTP, revealed 93% sequence identity between human and mouse CTRP3. However, we cannot rule out changes in efficacy or signaling induced by administration of human CTRP3 to mice. In the future, it would be useful to determine the in vivo half-life of systemically delivered CTRP3 protein in order to derive a dosing schedule that might mimic overexpression in the TG group. We also note that, due to circumstance, the animals in the rhCTRP3 delivery experiment were older than those in the initial genetic phenotyping experiment, though all mice are still considered young adult and in a period of stable bone mass25.
In some ways, the CTRP3 KO phenotype is reminiscent of anti-resorptive treatment26. However, despite the abnormally high callus volume at 20dpf, the lack of cartilage persistence at that time contradicts such a simple model. There are numerous points of statistical significance in the qPCR data that may or may not be of discrete biological significance in determining the cellular basis of this phenotype. Broadly, the KO group was characterized by early onset of an osteoblastic gene expression profile: a mild head-start which was ultimately surpassed by the WT and TG groups concurrent with failure to express normal levels of TRAP and VEGF during the endochondral phase in the KO group. Associating these data with spatial information obtained via μCT and histology, as well as normal alkaline phosphatase staining of CTRP3 knockdown MSCs, we speculate that CTRP3 regulates osteoblast maturation in the endochondral compartment but not the intramembranous compartment during long bone fracture healing. Thus, the aspects of the callus that form through intramembranous bone appear to be relatively normal (the periosteal reaction), but those that form through endochondral ossification are highly abnormal. We also revisited cDNA banked from a recently published marrow ablation experiment22 and observed substantial upregulation of CTRP3 gene expression during pure intramembranous bone formation (Figure S15). The discrepant functions of CTRP3 within endochondral versus intramembranous ossification could be a topic of future investigation.
Our observation of defects in cartilage physiology during fracture healing corroborate what little is known about CTRP3 function in the musculoskeletal system. CTRP3 is upregulated in mouse models of rheumatoid arthritis, and CTRP3 KO mice experience accelerated joint deterioration, linking CTRP3 to cartilage resilience27. Though its molecular mechanism is unknown, CTRP3 is believed to regulate proliferation and differentiation of chondroprogenitor cells through MAP kinase signaling28. CTRP3 accelerates mitochondrial metabolism in part through modulation of oxidative stress29, which plays a role in calcification of vascular smooth muscle cells via downstream activation of ERK1/2 and RUNX230. CTRP3-mediated ERK1/2 phosphorylation is also increased in osteosarcoma cell lines relative to osteoblast cell lines31. Elucidation of the molecular mechanisms of CTRP3 function will greatly add to our understanding of the diversity of phenotypes observed in response to CTRP3 perturbation.
In conclusion, CTRP3 levels are positively associated with accelerated fracture healing. An absence of CTRP3 results in abnormal endochondral ossification and deficits in osteoclast-mediated remodeling. Systemic overexpression of CTRP3 results in accelerated callus resolution and higher BMD, but a single injection of recombinant CTRP3 protein was insufficient to improve outcomes in genetically normal mice. Considering the established relationship between circulating CTRP3 and other metabolic phenotypes, low systemic CTRP3 may be a risk factor for poor fracture healing in humans.
Supplementary Material
Acknowledgements
Carol R. Whitinger, Michele M. Lowe, Anne J. Ryan, Troy L. Mitchell and Sunny A. Patel provided technical assistance. Financial support was provided in part by the National Institutes of Health: F32 DE026346 (DWY), F30 AR071201 (RLZ), R01 DK084171 (GWW), R01 AR066028 (KDH) and P30 AR069620 (Michigan Integrative Musculoskeletal Health Core Center), and the American Diabetes Association: 1-18-PMF-022 (SR). Portions of this manuscript have been published in abstract form at the 2020 Annual Meeting of the ORS.
Footnotes
Publisher's Disclaimer: This article has been accepted for publication and undergone full peer review but has not been through the copyediting, typesetting, pagination and proofreading process, which may lead to differences between this version and the Version of Record. Please cite this article as doi: 10.1002/jor.24553.
References
- 1.United States Bone and Joint Initiative: The Burden of Musculoskeletal Diseases in the United States (BMUS), Third Edition ed. 2014. Rosemont, IL [Google Scholar]
- 2.Marsell R, Einhorn TA. 2011. The biology of fracture healing. Injury 42:551–555. [DOI] [PMC free article] [PubMed] [Google Scholar]
- 3.Bahney CS, Zondervan RL, Allison P, et al. 2019. Cellular biology of fracture healing. J Orthop Res 37:35–50. [DOI] [PMC free article] [PubMed] [Google Scholar]
- 4.Antonova E, Le TK, Burge R, et al. 2013. Tibia shaft fractures: costly burden of nonunions. BMC Musculoskelet Disord 14:42. [DOI] [PMC free article] [PubMed] [Google Scholar]
- 5.Einhorn TA, Gerstenfeld LC. 2015. Fracture healing: mechanisms and interventions. Nat Rev Rheumatol 11:45–54. [DOI] [PMC free article] [PubMed] [Google Scholar]
- 6.Schaffler A, Buechler C. 2012. CTRP family: linking immunity to metabolism. Trends Endocrinol Metab 23:194–204. [DOI] [PubMed] [Google Scholar]
- 7.Maeda T, Abe M, Kurisu K, et al. 2001. Molecular cloning and characterization of a novel gene, CORS26, encoding a putative secretory protein and its possible involvement in skeletal development. J Biol Chem 276:3628–3634. [DOI] [PubMed] [Google Scholar]
- 8.Wong GW, Wang J, Hug C, et al. 2004. A family of Acrp30/adiponectin structural and functional paralogs. Proc Natl Acad Sci U S A 101:10302–10307. [DOI] [PMC free article] [PubMed] [Google Scholar]
- 9.Wolf RM, Steele KE, Peterson LA, et al. 2015. Lower Circulating C1q/TNF-Related Protein-3 (CTRP3) Levels Are Associated with Obesity: A Cross-Sectional Study. PLoS One 10:e0133955. [DOI] [PMC free article] [PubMed] [Google Scholar]
- 10.Li Y, Wright GL, Peterson JM. 2011. C1q/TNF-related protein 3 (CTRP3) function and regulation. Compr Physiol 7:863–878. [DOI] [PMC free article] [PubMed] [Google Scholar]
- 11.Otani M, Kogo M, Furukawa S, et al. 2012. The adiponectin paralog C1q/TNF-related protein 3 (CTRP3) stimulates testosterone production through the cAMP/PKA signaling pathway. Cytokine 58:238–244. [DOI] [PubMed] [Google Scholar]
- 12.Maeda T, Jikko A, Abe M, et al. 2006. Cartducin, a paralog of Acrp30/adiponectin, is induced during chondrogenic differentiation and promotes proliferation of chondrogenic precursors and chondrocytes. J Cell Physiol 206:537–544. [DOI] [PubMed] [Google Scholar]
- 13.Xu ZH, Zhang X, Xie H, et al. 2018. Serum CTRP3 level is associated with osteoporosis in postmenopausal women. Exp Clin Endocrinol Diabetes 126:559–563. [DOI] [PubMed] [Google Scholar]
- 14.Demirtas D, Acıbucu F, Baylan FA, et al. 2019. CTRP3 is significantly decreased in patients with primary hyperparathyroidism and closely related with osteoporosis. Exp Clin Endocrinol Diabetes. [DOI] [PubMed] [Google Scholar]
- 15.Kim JY, Min JY, Baek JM, et al. 2015. CTRP3 acts as a negative regulator of osteoclastogenesis through AMPK-c-Fos-NFATc1 signaling in vitro and RANKL-induced calvarial bone destruction in vivo. Bone 79:242–251. [DOI] [PubMed] [Google Scholar]
- 16.Coussens AK, Wilkinson CR, Hughes IP, et al. 2007. Unravelling the molecular control of calvarial suture fusion in children with craniosynostosis. BMC genomics 8:458. [DOI] [PMC free article] [PubMed] [Google Scholar]
- 17.Hebb JH, Ashley JW, McDaniel L, et al. 2018. Bone healing in an aged murine fracture model is characterized by sustained callus inflammation and decreased cell proliferation. J Orthop Res 36:149–158. [DOI] [PMC free article] [PubMed] [Google Scholar]
- 18.Matthews BG, Grcevic D, Wang L, et al. 2014. Analysis of alphaSMA-labeled progenitor cell commitment identifies notch signaling as an important pathway in fracture healing. J Bone Miner Res 29:1283–1294. [DOI] [PMC free article] [PubMed] [Google Scholar]
- 19.Wolf RM, Lei X, Yang ZC, et al. 2016. CTRP3 deficiency reduces liver size and alters IL-6 and TGFbeta levels in obese mice. Am J Physiol Endocrinol Metab 310:E332–345. [DOI] [PMC free article] [PubMed] [Google Scholar]
- 20.Peterson JM, Seldin MM, Wei Z, et al. 2013. CTRP3 attenuates diet-induced hepatic steatosis by regulating triglyceride metabolism. Am J Physiol Gastrointest Liver Physiol 305:G214–224. [DOI] [PMC free article] [PubMed] [Google Scholar]
- 21.Zondervan RL, Vorce M, Servadio N, et al. 2018. Fracture Apparatus Design and Protocol Optimization for Closed-stabilized Fractures in Rodents. J Vis Exp:e58186. [DOI] [PMC free article] [PubMed] [Google Scholar]
- 22.Youngstrom DW, Senos R, Zondervan RL, et al. 2017. Intraoperative delivery of the Notch ligand Jagged-1 regenerates appendicular and craniofacial bone defects. NPJ Regen Med 2:32. [DOI] [PMC free article] [PubMed] [Google Scholar]
- 23.van ‘t Hof RJ, Rose L, Bassonga E, et al. 2017. Open source software for semi-automated histomorphometry of bone resorption and formation parameters. Bone 99:69–79. [DOI] [PubMed] [Google Scholar]
- 24.Lin J, Liu Q, Zhang H, et al. 2017. C1q/Tumor necrosis factor-related protein-3 protects macrophages against LPS-induced lipid accumulation, inflammation and phenotype transition via PPARgamma and TLR4-mediated pathways. Oncotarget 8:82541–82557. [DOI] [PMC free article] [PubMed] [Google Scholar]
- 25.Ferguson VL, Ayers RA, Bateman TA, et al. 2003. Bone development and age-related bone loss in male C57BL/6J mice. Bone 33:387–398. [DOI] [PubMed] [Google Scholar]
- 26.Gerstenfeld LC, Sacks DJ, Pelis M, et al. 2009. Comparison of effects of the bisphosphonate alendronate versus the RANKL inhibitor denosumab on murine fracture healing. J Bone Miner Res 24:196–208. [DOI] [PMC free article] [PubMed] [Google Scholar]
- 27.Murayama MA, Kakuta S, Maruhashi T, et al. 2014. CTRP3 plays an important role in the development of collagen-induced arthritis in mice. Biochem Biophys Res Commun 443:42–48. [DOI] [PubMed] [Google Scholar]
- 28.Akiyama H, Furukawa S, Wakisaka S, et al. 2006. Cartducin stimulates mesenchymal chondroprogenitor cell proliferation through both extracellular signal regulated kinase and phosphatidylinositol 3-kinase/Akt pathways. Febs j 273:2257–2263. [DOI] [PubMed] [Google Scholar]
- 29.Feng H, Wang JY, Zheng M, et al. 2016. CTRP3 promotes energy production by inducing mitochondrial ROS and up-expression of PGC-1alpha in vascular smooth muscle cells. Exp Cell Res 341:177–186. [DOI] [PubMed] [Google Scholar]
- 30.Zhou Y, Wang JY, Feng H, et al. 2014. Overexpression of C1q/tumor necrosis factor–related protein-3 promotes phosphate-induced vascular smooth muscle cell calcification both in vivo and in vitro. Arterioscler Thromb Vasc Biol 34:1002–1010. [DOI] [PubMed] [Google Scholar]
- 31.Akiyama H, Furukawa S, Wakisaka S, et al. 2009. Elevated expression of CTRP3/cartducin contributes to promotion of osteosarcoma cell proliferation. Oncol Rep 21:1477–1481. [DOI] [PubMed] [Google Scholar]
Associated Data
This section collects any data citations, data availability statements, or supplementary materials included in this article.


