Abstract
Hypoglycemia deprives the brain of its primary energy source glucose. Reductions in whole-brain amino acid energy substrate levels suggest that these non-glucose fuels may be metabolized during glucose shortage. Recurring hypoglycemia can cause mal-adaptive impairment of glucose counter-regulation; yet, it is unclear if amplified reliance upon alternative metabolic substrates impedes detection of continuing neuro-glucopenia. This research aimed to develop high-sensitivity UHPLC-electrospray ionization mass spectrometric (LC-ESI-MS) methodology, for complementary use with high-neuroanatomical resolution microdissection tools, for measurement of glucogenic amino acid, e.g. glutamine (Gln), glutamate (Glu), and aspartate (Asp) content in the characterized glucose-sensing ventromedial hypothalamic nucleus (VMN) during acute versus chronic hypoglycemia. Results show that VMN tissue Gln, Glu, and Asp levels were significantly decreased during a single hypoglycemic episode, and that Gln and Asp measures were correspondingly normalized or further diminished during renewed hypoglycemia. Results provide proof-of-principle that LC-ESI-MS has requisite sensitivity for amino acid energy substrate quantification in distinctive brain gluco-regulatory structures under conditions of euversus hypoglycemia. This novel combinatore methodology will support ongoing efforts to determine how amino acid energy yield may impact VMN metabolic sensory function during persistent hypoglycemia.
Keywords: Insulin-induced hypoglycemia, Glutamine, Aspartate, 9-fluorenylmethyl, Chloroformate, Ventromedial hypothalamic nucleus
1. Introduction
The brain requires a constant supply of its primary energy substrate glucose to sustain vital, high energy-demand nerve cell functions. Insufficient glucose stream due to insulin-induced hypoglycemia (IIH) can cause neurological impairment and brain injury. IIH is a persistent complication of rigorous glycemic control required of type I diabetes mellitus patients [1,2]. In those patients, recurring insulin-induced hypoglycemia (RIIH) can lead to hypoglycemia-associated autonomic failure (HAAF), a pathophysiological mal-adaptation that manifests as diminis hypoglycemic awareness and glucose counter-regulatory colla [3]. Laboratory models for persistent IIH that simulate insulin de ery route, frequency of administration, and duration of actioi the clinical setting reveal dampened neuron genomic activat in brain gluco-regulatory loci, inferring neural accommodatio hypoglycemia [4,5]. The molecular and cellular mechanisms t cause this dangerous demise of systemic defenses against hy glycemic brain injury remain unclear.
Nerve cell reliance upon non-glucose metabolic fuels dui hypoglycemia may impede detection and/or signaling of rec ring episodes of neuro-glucopenia. The pyruvate recycling pathw supplies the tricarboxylic acid (TCA) cycle with pyruvate molect derived from non-glucose substrates, including glutamine (G and glutamate (Glu) [6]. Complete glutamine oxidation in TCA cycle involves entrance and exit of glutamate in the form alpha-ketoglutarate and malate, respectively, followed by proci ing of pyruvate to acetyl-CoA. Glucose deficiency is reportec up-regulate pyruvate recycling activity [7]. During IIH, Gln and may be potential brain energy substrates as whole brain Glu le are reportedly diminished [8].The amino acid aspartate (Asp) is implicated in pyruvate production [9]. It is unclear how IIH may influence utilization of these amino acids for energy production in discrete brain structures, including loci that regulate systemic glucostasis. The ventromedial hypothalamic nucleus (VMN) is a key element of the brain glucostatic network, where nutrient, endocrine, and neurochemical signals conveying cellular and systemic metabolic status are processed to direct counter-regulatory autonomic, neuroendocrine, and behavioral responses to IIH [10]. Detection of neuro-energetic deficiency within the mediobasal hypothalamus, which contains the VMN as well as arcuate and tuberal hypothalamic nuclei, is obligatory for optimal counter-regulatory hormone and hepatic gluconeogenic responses to IIH [11]. Mediobasal hypothalamic γ-aminobutyric acid (GABA) signaling inhibits counter-regulatory hormone secretion, and antecedent hypoglycemic augmentation of local GABAergic tone is implicated in impaired counter-regulation [12,13]. At present, discriminative methods for analysis of GABA activity within the VMN are unavailable, thus impeding understanding of how hypoglycemic effects on glucogenic amino acid profiles correlate with this gluco-inhibitory neurotransmitter signal. The amino acid creatine (CR) contributes importantly to maintenance of intracellular ATP levels by virtue of its ability to rapidly bind or release a phosphate group. There are no reports of methodology for assessment of acute versus chronic IIH effects on this energy reserve within the VMN.
Current research aimed to validate a high-sensitivity analytical approach for quantification of Gln, Glu, Asp, and GABA in small volume brain tissue samples that correspond to discrete neural structures, specifically, here, the VMN. Quantification of various amino acids in brain tissue has been carried out using HPLC, magnetic resonance spectroscopy (MRS), mass spectrometric, and imaging techniques [14–22], but current applications of these techniques lack requisite sensitivity for small-volume brain tissue sample analysis. Moreover, outcomes obtained using HPLC are negatively affected by matrix interference and long chromatographic runs [22]. Likewise, drawbacks concerning use of MRS such incomplete peak resolution and lack of signal symmetry impede quantification. Also, high percentage of tissue water impairs amino acid detection [23]. Here, high-resolution micropunch dissection tools for discriminative isolation of VMN tissue were used in conjunction with optimized UHPLC-electrospray ionization mass spectrometric (LC-ESI-MS) analytical and pre-column 9-fluorenylmethyl chloroformate (FMOC) derivatization methods, strategic choice of internal standard, and advantageous low concentrate alkaline buffer selection [24] to investigate whether VMN tissue concentrations of these amino acids are impacted differentially by acute versus recurring IIH.
2. Materials and methods
2.1. Reagents and supplies
LC-MS grade-acetonitrile, high-purity formic acid, and chloroform HPLC grade were obtained from VWR Intl. (Radnor, PA). Ammonium acetate was purchased from J.T. Baker-Avantor (Radnor, PA). Sodium bicarbonate was procured from Spectrum Chemicals Mfg. Corp. (New Brunswick, NJ). L-Asp was obtained from TCI America (Portland, OR). 1-Adamantanamine hydrochloride (AD; 99 %), L-Glu-5-benzyl ester (99.0 %), GABA (99 %), 9-fluorenylmethyl chloroformate (FMOC; 98 %), anhydrous CR (98 %), L-Gln (99 %), and L-Glu (99+%) were purchased from Alfa Aesar (Haverhill, MA). Small volume (350 μL) flat bottom borosilicate glass inserts (6 × 31 mm; AQBrand) were obtained from Microsolv Technology Corp. (Leland, NC).
2.2. Pre-column derivatization ofglutamine (Gln) with fluorenylmethyloxycarbonyl chloride (FMOC) as derivatizing agent and optimization ofmass spectrometry parameters
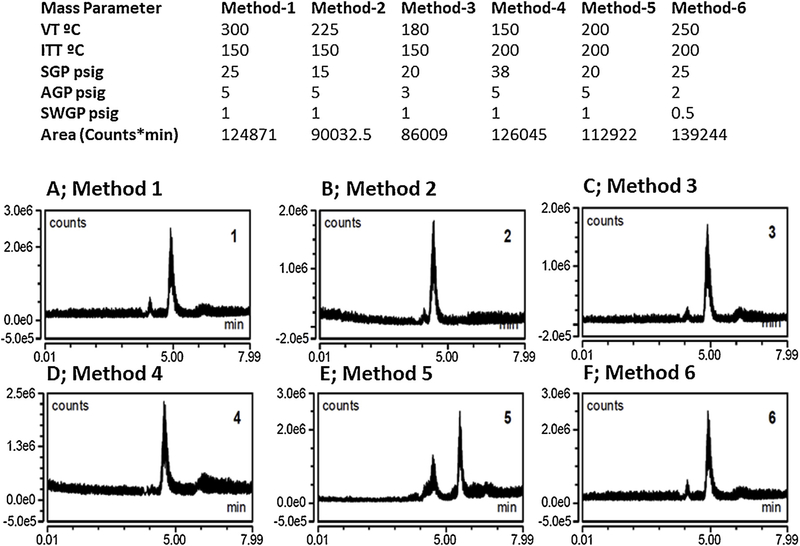
Derivatization procedures were adapted with modification from Rebane et al. [25]. Briefly, a Gln stock solution (1 mg/mL) was prepared with ultrapure water in 1.5 mL plastic microcentrifuge tubes. In a separate tube, 1.5 mg FMOC was dissolved in 1.0 mL acetonitrile, then vortexed to yield a clear solution; in a second separate tube, 1 mg AD was dissolved in 1.0 mL 50 % acetonitrile. Accurately-weighed 10 mg sodium carbonate was transferred to a beaker containing 200 mL ultrapure water, and stirred to produce a clear solution; sodium bicarbonate solid was then added, under magnetic stirring, to attain pH 9.0. Gln stock (100 μL) was added to carbonate buffer, pH 9.0 (100 μL) and FMOC (100 μL), vortexed (30 s), and kept at 25 °C. After 40 min., the solution was supplemented with 50 μL AD, vortexed (30 s), maintained at 25 °C (5 min.), then centrifuged. Clear supernatant was transferred to 350 μL inserts in 2 mL Surestop vials positioned in an auto-sampler tray. An assembled chromatography system [UHPLC Vanquish binary pump (prod. no. VFP10A01/121345), Vanquish auto-sampler (prod. no. VFA10A02/121345), and temperature-controlled Vanquish UHPLC + column compartment (prod. no. VHC10A02/121345)] was coupled to single quad ISQ EC mass spectrometer (prod. no. ISQECLC/121345) (ThermoFisherScientific, Waltham, MA). An Acclaim™ 120 C18 (4.6 mm ID X 100 mm L, 5 μm, 120À; prod. no. 059147, ThermoFisherSci.) column was used to optimize mass spectrometric parameters for detection of Gln, Glu, Asp, CR, and GABA. Column and autosampler temperatures were 30°C and 15°C, respectively. The auto-sampler needle was washed with 10 % (v/v) methanol (10 s). ThermoScientific™ Dionex™ Chromeleon™ 7 Chromatography Data System software (prod. no. 7200.0300/121345) was used for mass spectrometric analysis. Mobile phases A and B consisted of 10 mM ammonium acetate and acetonitrile, respectively. During linear gradient mobile phase flow, acetonitrile was increased from 50 % to 80 % over the initial 4 min., followed by a decline to 50 % between 4 and 8–15 min (Figs. 1 and 2). Based on mass optimization parameters, vaporizer temperature (VT; 250 °C), ion transfer tube temperature (ITT; 200 °C), sheath gas pressure (SGP; 25psig), auxiliary gas pressure (AGP; 2 psig), sweep gas pressure (SWGP; 0.5 psig), and negative mode were selected for analysis of various amino acids. The Acclaim™ 120 C18 column was used with a flow rate of 0.25 mL/min. and injection volume of 1 μL. A calibration curve was developed for FMOC-Gln, -GABA, and -CR. Stock solutions of Gln (250 μg/mL), GABA (300 μg/mL), and CR (1 mg/mL) were prepared. A structural analog as internal standard (IS; 50 μLL-Glu-5-benzyl ester) was prepared by dissolving 190 μg in 1 mL 50 % acetonitrile), and showed a very stable mass spectrometric response in standard and brain samples. Amino acids were derivatized by transfer of 100 μL of each calibration concentration to a 1.5 mL microcentrifuge tube, to which was added 100 μL carbonate buffer pH 9.0, 50 μL IS, and 100 μL FMOC. Samples were vortexed (30 s.) kept at 25 °C (40 min.), then supplemented with 50 μL AD, vortexed (30 s.), kept at 25 C (5 min.), then centrifuged. Clear supernatants were transferred to 350 μL inserts for analysis. Mass chromatograms are shown in Figs. 3–5. Separate Glu and Asp mass spectrometric analyses were performed in positive mode using Gln parameters as described above, with the exception of mobile phase composition. Here, mobile phase A was prepared by addition of 60 μL formic acid to 900 mL ultrapure water, whereas phase B consisted of acetonitrile. An Accucore Vanquish C18+ column Dim. (mm) 50 × 2.1 (prod. 27101–052130; ThermoFis herSci.) was used with a flow rate of 0.2 mL/min in linear gradient composition, acetonitrile changes from 50 % to 80 % over initial 4 min., then reduction of acetonitrile by 50 % at 8 or 15 min. The injection volume was 1 μL. A calibration curve was developed for Glu and Asp using the 1 mg/mL stock solution, under conditions described above. Mass chromatograms are shown in Figs. 6 and 7. Details of calibration equations are given in Table 1.
Fig. 1.
Optimization of mass spectrometric parameters for Gln-FMOC at m/z [M-H] 367.1. Optimized parameters for Gln-FMOC standard, 1 mg/mL, injection volume 0.5 μL, were established using Methods 1–6 (corresponding total ion current chromatograms are depicted in Panels A-F), with Method 6 TIC (Panel F) showing most abundant area. Analyses were performed at a flow rate of 0.25 mL/min, with a mobile acetonitrile and 10 mM ammonium acetate mobile phase. Acetonitrile was increased from 50 % to 80 % until 4 min, then decreased to 50 % at either 8 or 15 min.
Fig. 2.
Extracted chromatograms of Gln-FMOC, at [M-H] m/z 367.1. Chromatograms from Methods 1–6 are correspondingly depicted in Panels. A-F.
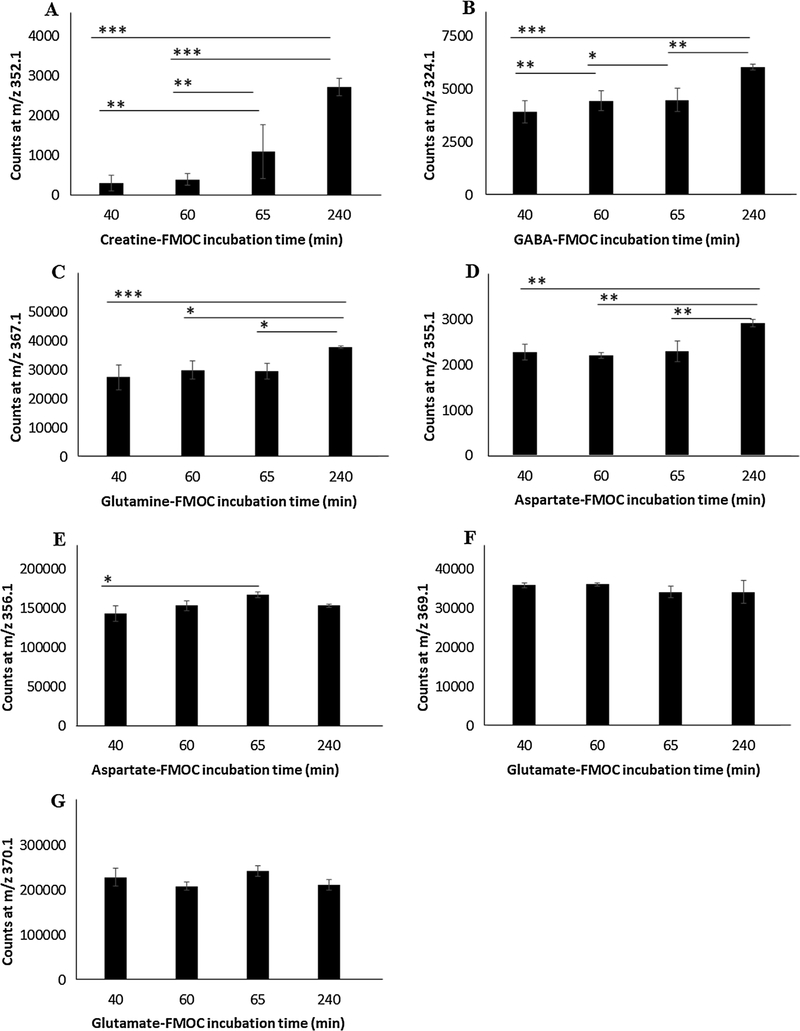
Fig. 3.
Effects of room temperature incubation time on amino acid-FMOC derivative mass spectrometric response. Panel A: Creatine-FMOC. Panel B: GABA-FMOC. Panel C: Glutamine-FMOC. Panel D: Aspartate-FMOC at m/z 355.1. Panel E: Aspartate-FMOC at m/z 356.1. Panel F: Glutamate-FMOC at m/z 369.1. Panel G: Glutamate-FMOC at m/z 370.1.
Fig. 5.
TIC and extracted ([M-H] m/z 352.1) chromatograms of standard 1 mg/mLCR-FMOC, and extracted ([M-H] m/z 458.2) IS-FMOC chromatogram. Retentiontimes for CR- and IS-FMOC was 4.6 and 7 min, respectively.
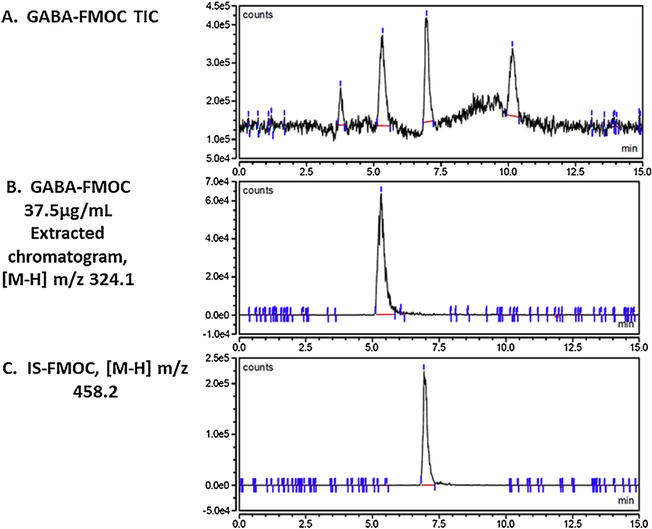
Fig. 6.
TIC and extracted ([M-H] m/z 324.1) chromatograms of standard 37.5 μg/mLGABA-FMOC, and extracted ([M-H] m/z 458.2) IS-FMOC chromatogram. Retention times for GABA- and IS-FMOC were 5.25 and 7 min, respectively.
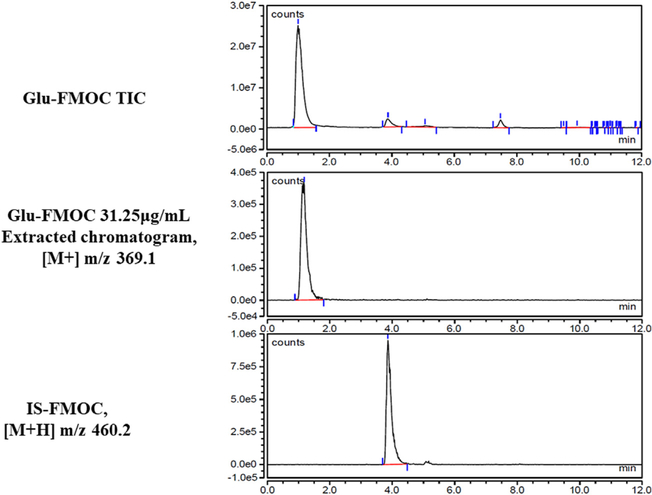
Fig. 7.
TIC and extracted([M+] m/z 369.1) chromatograms of standard 31.25 μg/mLGlu-FMOC, and extracted ([M+H] m/z 460.2) chromatogram of IS-FMOC. Glu- and IS-FMOC were resolved at retention time 1.2 and 4 min, respectively.
Table 1.
Calibration parameters.
| Compound | Linear Equation | Range(μg/g) | R2 |
|---|---|---|---|
| Gln-FMOC | y = 0.3482x+0.0088 | 0.48–250 | 0.9912 |
| GABA-FMOC | y=2.0909x+0.0413 | 0.07–37.5 | 0.9683 |
| CR-FMOC | y=0.0216x+0.0023 | 31.25–1000 | 0.9969 |
| Glu-FMOC | y=2.539x+0.01511 | 0.48–250 | 0.9958 |
| Asp-FMOC | y = 0.0073x-0.0043 | 250–1000 | 0.9768 |
Calibration of each analyte was performed (n = 6) at different range of concentratioi after extraction at selected m/z from TIC.
FMOC derivatives of Gln, GABA, and CR were analyzed in negative mode; Glu ai Asp were analyzed in positive mode.
2.3. Animal model of recurrent IIH
Adult male Sprague-Dawley rats (3–4 months of age) were handled in accordance with NIH guidelines for care and use of laboratory animals, under ULM Institutional Animal Care and Use Committee approval. Groups of animals (n = 5/group) were injected subcutaneously (sc) at 10.00 h on days 1–3 with sterile diluent (V; Eli Lilly and Co., Indianapolis, IN; groups 1 and 2) or neutral protamine Hagedorn insulin (I, 5.0 U/kg bw/mL; Butler Schein Animal Health, Dublin, OH; group 3) [26]. Rats were then injected with V (group 1) or I (groups 2 and 3) on day 4. Animals were sacrificed at 11.30 h for brain tissue and trunk blood collection. Dissected brains were immediately snapfrozen in liquid nitrogen-cooled isopentane and stored at −80 °C. Plasma was obtained by immediate centrifugation and stored at −20 °C.
2.4. VMN tissue microdissection for amino acid LC-ESI-MS analysis
Rats were sacrificed by microwave fixation (1.45 s exposure; In Vitro Microwave Fixation System, 5 kW; Stoelting Co., Wood Dale, IL, as described [27]. Frozen sections of 200 μm thickness were cut over the rostro-caudal length of the VMN. From each animal, VMN tissue was micropunch-dissected using 0.50 mm-diameter hollow needles (Stoelting, Inc.), pooled by collection into 100 μL ultrapure water, and stored at −80°C. Micropunch tissue samples were also obtained from the CA3 region of the hippocampus, a brain structure that does not exhibit glucose-sensing functionality. After thawing to room temperature, samples were vortexed (30 s.) and 100 μL aliquots were derivatized by addition of carbonate buffer, pH 9.0 (100 μL), IS (50 μL), and FMOC (100 μL). After vortexing (30 s.) and maintenance at 25 °C (40 min.), AD (50 μL) was added prior to further vortexing (30 s.) and maintenance at 25 °C (5 min.). Contents were centrifuged, and a clear supernatant was transferred to 350 μL inserts for analysis. TIC chromatograms of brain tissue samples analyzed in negative mode were extracted using different m/z values of a structural analog IS (L-glutamic acid 5-benzyl ester), Gln, GABA, and CRat 458.2, 367.1,324.1, and 352.1, respectively; positive mode analysis showed the presence of IS, Glu, and Asp m/z at 460.2, 369.1, and 355.1, respectively (Figs. 7 and 8). Structures of derivative components are shown in Figs. 11 and 12. The following linear equation was used to quantify tissue concentrations of amino acid derivatives:
Fig. 8.
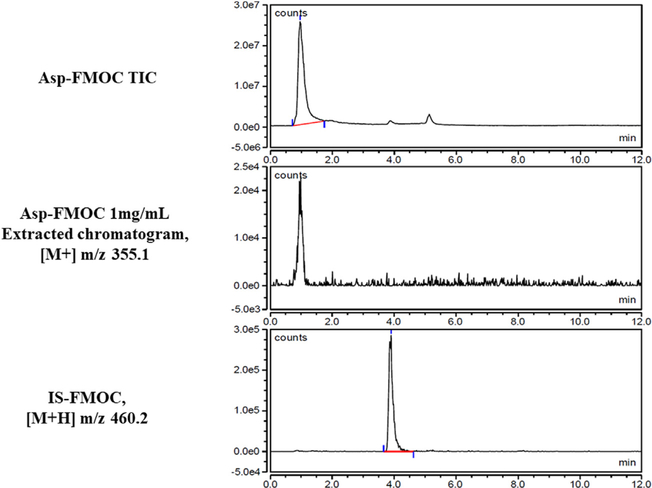
TIC and extracted ([M+] m/z 355.1) chromatogram of standard 1 mg/mL Asp-FMOC, and extracted ([M+H] m/z 460.2) chromatogram of IS-FMOC. Asp- and IS-FMOC were resolved at retention time 1 and 4 min, respectively.
Fig. 11.
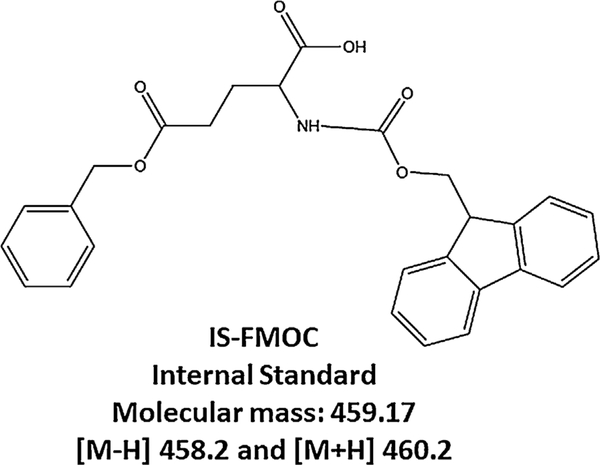
Structure of the internai standard (IS) L-giutamic acid 5-benzyi ester. IS-FMOC was quantified at [M-H] m/z 458.2, and [M+H] m/z 460.2, respectiveiy.
Fig. 12.
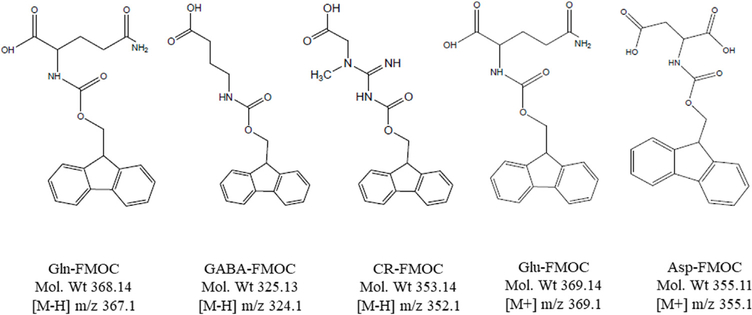
Structures ofFMOC derivatives of Gln, Glu, Asp, CR, and GABA. Structures A-E correspondingly depict Gln-FMOC (glutamine-FMOC, mol. wt. 368.14; quantificatior [M-H] m/z367.1); GABA-FMOC(γ-aminobutyric acid-FMOC, mol. wt. 325.13; quantificationat [M-H] m/z324.1), CR-FMOC (creatine-FMOC, mol.wt.353.14; quantificat at [M-H] m/z 352.1), Glu-FMOC (glutamate-FMOC, mol. wt 369.1; quantification at [M+] m/z 369.1), and Asp-FMOC (aspartate-FMOC, mol.wt 355.1; quantification at [M m/z 355.1).
Analyte Area / IS Area = (Analyte Conc. / IS Conc.) × slope + Const.
Analyte Area = Extracted at suitable m/z from TIC.
Area of IS = Extracted at m/z IS 458.2 or 460.2 from TIC.
Const = y-intercept of standard calibration equations in Table 1.
Slope = Value derived from standard calibration equations in Table 1.
IS Conc. = 190 μg/mL
From the above equation:
AnalyteConc. = [((AnalyteArea/ISArea)-Const.)/Slope]xISConc.
Tissue amino acid levels were expressed as ug/g tissue.
2.5. Statistical analysis
Mean tissue amino acid levels were evaluated among treatment groups by one-way analysis of variance and Student Newman Keuls post-hoc test. VMN versus hippocampal CA3 amino acid content in V-injected controls was compared by Student’s t test. Differences of p<0.05 were considered significant.
3. Results and discussion
Mass spectrometric parameters for standard Gln-FMOC (1 mg/mL; injection volume 0.5 μL) separation were optimized by comparison of Methods 1–6 (Fig. 1), which revealed that maximum detectable area was achieved using Method 6. Extracted Gln-FMOC chromatograms at [M-H] m/z 367.1 from Methods 1–6 TICs (Fig. 2) show that minimum AGP and SWGP of Method 6 enhance ionization and increase chromatographic area.
Outcomes show that formation of specific amino acid FMOC derivatives and corresponding mass spectrometric areas was time-dependent. For exampie, Cre-FMOC area was enhanced by three (65 min.) to nine (240 min.) foid at 65 and 240 min. incubation, respectiveiy, compared to a shorter incubation period of 40 min. (Fig. 3, Panel A). Incubation of GABA-FMOC for periods exceeding 40 min. resuited in progressive improvement in detectabie area (Fig. 3, Panel B). Incubation of Gin- and Asp-FMOC (Asp-FMOC, m/z 355.1) for 240 min. enhanced mass spectrometric area measures compared to shorter intervais (Fig. 3, Panels C and D). Anaiysis of Asp-FMOC at m/z 356.1 improved spectrometric area at 65 min oniy (Fig. 3, Panel E). However, Giu-FMOC mass spectrometric area anaiyzed at either m/z 369.1 and 370.1 was not significantiy affected by differences in incubation times used here (Fig. 3, Panels F,G).
Intra- and inter-day repeatabiiity (precision expressed as reiative standard deviation) of Cre-FMOC, GABA-FOMOC, Gin-FMOC, Asp-FMOC, and Giu-FMOC derivatives were 2.0 and 23 %, 1.6 and 10.2 %, 3.0 and 8.0 %, 3.8 and 49.7 %, and 2.2 and 6.0 %, respectiveiy. Ion suppression in ESI anaiyses was evaiuated by the standard addition method [Byun et ai., 2008]. Percentages of ion suppression in current proposed methodoiogy for measurement of Cre-, GABA-, Gin-, Asp-, and Giu-FMOC derivatives were estimated to be 58 %, 32.4 %, 17.5 %, 55 %, and 65 %, respectiveiy. Detection iimits for standard amino acid-FMOC derivatives creatine-FMOC, GABA-FMOC, Gin-FMOC, Asp-FMOC, and Giu-FMOC were found to be 369.04, 6.75,12.35, 418.54, and 1.59ng/μL, respectiveiy. Limits of quantitation of standard creatine-FMOC, GABA-FMOC, Gin-FMOC, Asp-FMOC, and Giu-FMOC derivatives were determined to be 1.11 μg/μL, 20.47 ng/μL, 37.45 ng/μL, 1.268 μg/μL, and 4.84 ng/μL, respectiveiy.
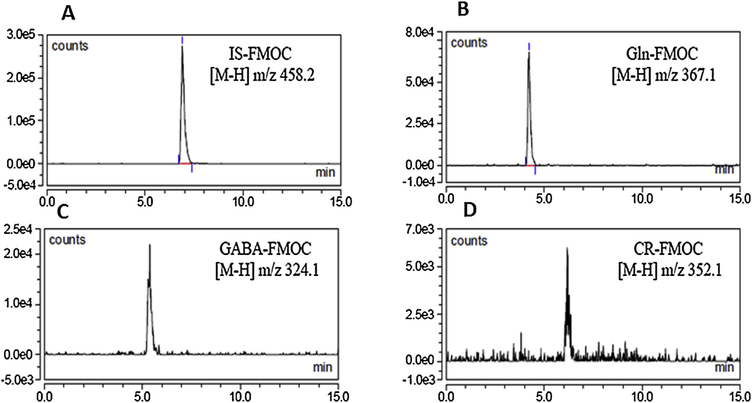
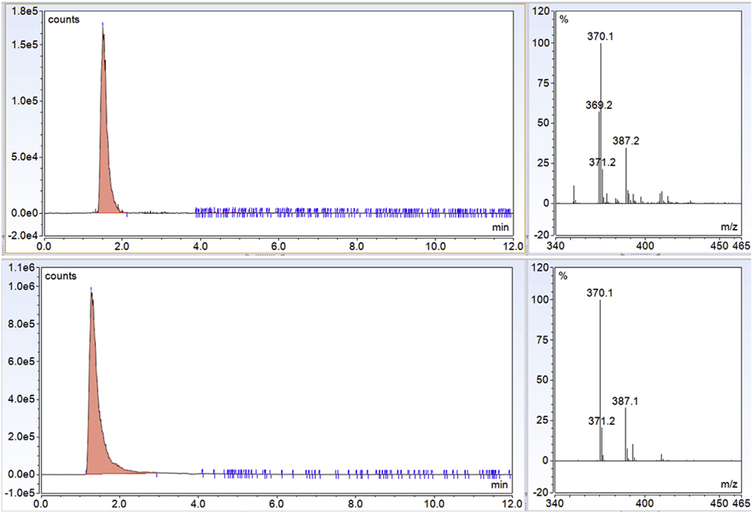
TIC chromatograms, extracted chromatograms, and extracted chromatograms of FMOC-derivatized internai standard (IS; L-giutamic acid 5-benzyi ester; 190 μg/mL standard) are presented for Gin-FMOC (Fig. 4; 250 μg/mL standard), CR-FMOC (Fig. 5; 1 mg/mL standard), GABA-FMOC (Fig. 6; 37.5 μg/mL standard), Giu-FMOC (Fig. 7; 31.25 μg/mL standard), and Asp-FMOC (Fig. 8; 1 mg/mL standard). Retention times ofextracted Gin-FMOC (Fig. 4), CR-FMOC (Fig. 5), and GABA-FMOC (Fig. 6) chromatograms in negative mode ([M-H] m/z 367.1, [M-H] m/z 352, [M-H] m/z 324.1, respectiveiy) were 4.1,4.6 min, or 5.25 min, compared to 7 min. for extracted IS-FMOC chromatogram at [M-H] m/z 458.2. Retention times of extracted Giu-FMOC at [M+] m/z 369.1 and extracted chromatogram of Asp-FMOC at [M+] m/z 355.1 were 1.2 and 1.0 min., respectiveiy, compared to 4 min. for IS-FMOC at [M+H] m/z 460.2. Tabie 1 shows IS-based standard caiibration equations for Gin-, CR-, GABA-, Giu-, and Asp-FMOC derivatives. Figs. 9 and 10 depict negative (Gin-, GABA-, CR-, and IS-FMOC) or positive (Giu-, Asp-, and IS-FMOC) mode detection, respectiveiy, of derivatized amino acids and IS in brain tissue sampies. Fig. 11 shows the chemicai structure of IS-FMOC, which was quantified in negative or positive mode at [M-H] m/z 458.2 and [M+H] m/z 460.2, respectiveiy. Fig. 12 depicts structures of Gin-FMOC (Panel A; moi. Wt. 368.14; [M-H] m/z 367.1), GABA-FMOC (Panel B; moi. wt 325.13; m/z 324.1), CR-FMOC (Panel C; moi. wt. 353.14; [M-H] m/z 352.1), Giu-FMOC (Panel D; moi. wt. 369.1; [M+] m/z 369.1), and Asp-FMOC (Panel E; moi. wt. 355.1; [M+] m/z 355.1). The standard Asp-FMOC showed reiative abundance at [M+H] m/z 356.1 as weii as [M+] 355.1, whiie brain sampie quantification was possibie oniy at [M+] m/z 355.1 [Fig. 13]. Simiiariy, Giu-FMOC was observed at [M+H] m/z 370.1 and [M+] m/z 369.1 or 369.2, and the pattern of Giu-FMOC area expression was mostiy simiiar (data not shown), but [M+H] showed three to six times higher mass spectrometric area over [M+] when extracted from totai ion current [Fig. 14].
Fig. 4.
TIC and extracted ([M−H] m/z 367.1]) chromatograms of standard (250 μg/mL) Gln-FMOC and extracted ([M−H] m/z 458.2]) chromatogram of derivatized internalstandard (IS) L-glutamic acid 5-benzyl ester (190 μg/mL)-FMOC. Respective retention times for Gln- and IS-FMOC were 4.1 and 7 min.
Fig. 9.
LC-ESI-MS negative mode analysis of microdissected ventromedial hypothalamic nucleus (VMN) tissue samples showed the presence ofGln-, GABA-, CR-, and IS-FMOC.
Fig. 10.
LC-ESI-MS positive mode anaiysis of microdissected ventromediai hypothaiamic nucieus (VMN) tissue sampies showed the presence of Giu-, Asp-, and IS-FMOC.
Fig. 13.
Aspartate-FMOC showed mass spectrometric response at m/z 355.1 and 356.1, respectively. Standard Asp-FMOC occurs in relative abundance in both m/z, whereas brain tissue Asp was only detectable at m/z 355.1 in the present study.
Fig. 14.
Glutamate-FMOC showed mass spectrometric response at m/z 370.1 and 369.1, respectively. Glu-FMOC shows higher area at 370.1 than 369.1 but has similar pattern of responses were observed for the analyses of discrete brain nuclei. Quantification of Glu-FMOC was performed at m/z 369.1.
Validation of time-dependent formation of specific amino acid FMOC derivatives and corresponding mass spectrometric areas faciiitated anaiysis of distinct amino acids in VMN tissue. Data presented in Table 2 show that a singie bout of hypogiycemia significantiy decreased VMN tissue Gin ieveis (Row A) compared to V-injected controis (group VVV/I<group VVVV), whereas tissue Gin content did not differ between controis versus rats treated with insuiin for four consecutive days (group VVVV = group IIII). VMN Giu content (Row B) was significantiy decreased during acute and chronic hypogiycemia; tissue Giu ieveis were equivaient between VVVI and IIII groups. Asp ieveis (Row C) were significantiy reduced by acute hypogiycemia, and suppressed to an even greater extent during renewed hypogiycemia. As shown in Row D, VMN CR content was unaffected by either single or serial hypoglycemic episodes. VMN GABA levels were suppressed during acute hypoglycemia (Row E), but were normalized to control values during chronic hypoglycemia. Current data show that acute hypoglycemia reduces VMN glucogenic amino acid concentrations, suggesting that use of these alternative fuel substrates may be enhanced. Evidence that tissue Gln and Asp levels were respectively normalized or further decreased by RIIH implies that reliance upon Asp for energy may exacerbated by recurring glucoprivation, whereas Gln utilization may habituate to this metabolic stress. As whole-VMN measurements represent averaged values, they may possibly obscure disparities in Glu and/or Asp acclimation to hypoglycemia within individual resident neuron populations. Findings that VMN Cre content is refractory to hypoglycemia infer that total phosphate levels stored for transfer to ADP to replenish intracellular ATP is stable despite singular or serial exposure to this metabolic stress. LC-ESI-MS analyses here show that VMN GABA concentrations are decreased during acute hypoglycemia but restored to control range during RIIH, results that agree with prior reports that mediobasal hypothalamus patterns of GABA transmitter signaling habituate to recurring hypoglycemia [12]. Correlation of these measures with acute versus chronic hypoglycemic effects on VMN GAD65/67 expression profiles underscores the utility of this marker protein as an indirect indicator of GABA transmission in the VMN.
Table 2.
Effects of Acute versus Recurrent Insulin-Induced Hypoglycemia on Ventromedial Hypothalamic Nucleus Amino Acid Energy Substrate and Gluco-regulatory Neuro-transmitter Content.
| Treatment Groupsa |
|||
|---|---|---|---|
| VVVVb | VVVIc | IIIId | |
| A. Glutamine (Gln) | 149.8 ± 7.9e | 118.7 ± 4.5 ***, vs. VVVV | 140.4 ± 3.1 **, vs. VVVI |
| B. Glutamate (Glu) | 36.4 ± 2.2 | 22.0 ± 0.2 ***, vs. VVVV | 21.6 ± 0.5 ***, vs. VVVV |
| C. Aspartate (Asp) | 1455.0 ± 85.6 | 910.4 ± 48.9 ***, vs. VVVV | 714.0 ± 24.5 **, vs. VVVI ***, vs. VVVV |
| D. Creatine (CR) | 224.3 ± 12.3 | 205.4 ± 4.0 | 217.2 ± 8.3 |
| E. γ-aminobutyric acid (GABA) | 9.6 ± 0.4 | 7.9 ± 0.1 *, vs. VVVV | 9.3 ± 1.9 *, vs. VVVI |
p < 0.05
p < 0.01
p < 0.001.
n = 5 animals / treatment group.
subcutaneous (sc) injection of vehicle (V), one dose per day, on four consecutive days.
sc V injection on days 1–3, followed by 5.0 U neutral protamine Hagedorninsulin (INS)/kg bw injection on day 4.
sc INS injection on days 1–4.
ug/g.
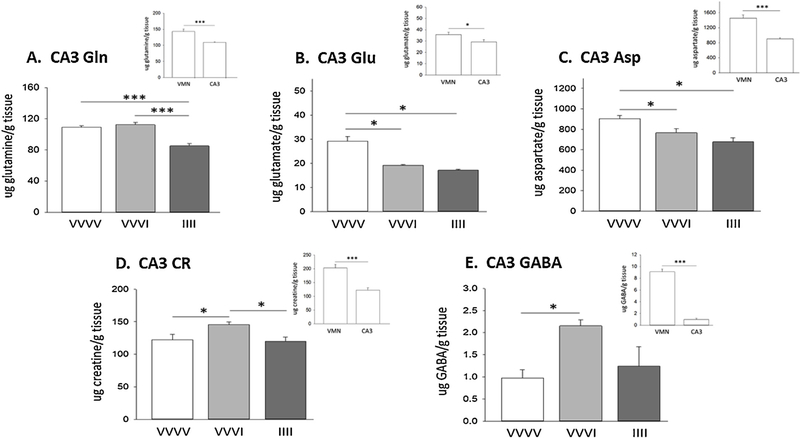
Data in Fig. 15 illustrate acute versus recurring hypoglycemia effects on hippocampal CA3 tissue Gln (Panel A), Glu (Panel B), Asp (Panel C), CR (Panel D), and GABA (Panel E) content. Panel insets show that baseline amino acid concentrations in V-injected controls were significantly higher in VMN versus CA3 tissue. Acute hypoglycemia diminished CA3 Glu and Asp concentrations, responses that mirrored Glu and Asp decrements in the VMN, but elicited differential changes in Gln, CR, and GABA profiles in the brain structures. Divergent adaptations in CA3 versus VMN amino acid profiles to RIIH were also observed for Gln, Asp, CR, and GABA. These outcomes strongly justify investigative emphasis on neural structure-specific analysis of amino acid energy substrates and neurotransmitter profiles.
Fig. 15.
Panels illustrate hippocampal CA3 Gln (Panel A), Glu (Panel B), Asp (Panel C), CR (Panel D), and GABA (Panel E) tissue concentrations in groups of rats injected as follows: vehicle (V), one dose per day, on four consecutive days [VVVV]; V injection on days 1–3, followed by insulin (I) on day 4 [VVVI]; I injection on days 1–4 [lili]. Panel insets compare baseline VMN versus CA3 amino acid levels in V-injected controls. * p<0.05; ** p<0.01; *** p< 0.001.
Present outcomes demonstrate optimized high negative-/positive-mode amino acid energy substrate and gluco-regulatory neurotransmitter resolution by LC-ESI-MS in small-volume brain tissue samples. Favorable attributes of methodology described here include low injection volume requirements, amino acid analyte resolution time of less than 6 min., and FMOC reaction involving low alkaline carbonate buffer, pH 9.0. The complex structural and functional organization of the brain requires investigative focus at high-neuroanatomical resolution. This research addressed a current need for quantitative analytical tools for measurement of Gln, Glu, Asp, and GABA amino acid levels in distinctive neural structures implicated in neural regulation of glucose homeostasis. Results provide proof-of-concept that pairing of novel LC-MS/ESI methodology with minute-scale brain tissue dissection techniques provides requisite sensitivity. Application of this investigative approach to evaluate VMN content of these amino acids documents dissimilar acute versus chronic hypoglycemia effects on tissue Gln and Asp profiles, indicating likely accommodating adjustments in their utilization as a consequence of persistent exposure to hypoglycemia. Correlation of these adaptations with habituated gluco-inhibitory GABAergic signaling (data that align with previous studies on mediobasal hypothalamic GABA) may reflect a possible causal relationship. Current findings bolster the need for further research aimed at investigating how RIIH may influence rates and ratios of Gln and Asp synthesis and net energy yield in the VMN, and to determine if RIIH-associated adjustments in rates of utilization of either of amino acid mitigates detectable effects of hypoglycemia on local cellular energy balance.
Acknowledgments
Research Support: National Institutes of Health DK 109382
Abbreviations
- Asp
aspartate
- FMOC
9-fluorenylmethyl chloroformate
- Glu
glutamate
- Gln
glutamine
- HAAF
hypoglycemia-associated autonomic failure
- IIH
insulin-induced hypoglycemia
- LC-ESI-MS
UHPLC-electrospray ionization mass spectrometry
- RIIH
recurrent insulin-induced hypoglycemia
- TCA
tricarboxylic acid cycle
- VMN
ventromedial hypothalamic nucleus
Footnotes
Declaration of Competing Interest
The authors have no conflicts of interest to declare.
References
- [1].Cryer PE, Glycemic goals in diabetes: trade-offbetweenglycemic control and iatrogenic hypoglycemia, Diabetes 63 (2014) 2188–2195, 10.2337/db14-0059. [DOI] [PubMed] [Google Scholar]
- [2].Cryer PE, Hypoglycemia-associated autonomic failure in diabetes: maladaptive, adaptive, orboth? Diabetes 64 (2015) 2322–2323, 10.2337/db15-0331. [DOI] [PMC free article] [PubMed] [Google Scholar]
- [3].Cryer PE, Hypoglycemia-associated autonomic failure in diabetes, Handb. Clin. Neurol. 117 (2013) 295–307, 10.1016/B978-0-444-53491-0.00023-7. [DOI] [PubMed] [Google Scholar]
- [4].Paranjape SA, Briski KP, Recurrent insulin-induced hypoglycemia causes site-specific patterns of habituation or amplification of CNS neuronal genomic activation, Neuroscience 130 (2005) 957–970, 10.1016/j.neuroscience.2004.09.030. [DOI] [PubMed] [Google Scholar]
- [5].Kale AY, Paranjape SA, Briski KP, I.c.v. administration ofthe nonsteroidal glucocorticoid receptor antagonist, CP4–72555, prevents exacerbated hypoglycemia during repeated insulin administration, Neuroscience 140 (2006) 555–565, 10.1016/j.neuroscience.2006.02.041. [DOI] [PubMed] [Google Scholar]
- [6].Cerdan S, Twenty-sevenyears of cerebral pyruvatre recycling,J. Neurochem. 42 (2017) 1621–1628, 10.1007/s11064-017-2173-4. [DOI] [PubMed] [Google Scholar]
- [7].Amaral AI, Effects ofhypoglycaemia on neuronal metabolism in the adult brain: role ofalternative substrates to glucose, J. Inherit. Metab. Dis. 36 (2013) 621–634, 10.1007/s10545-012-9553-3. [DOI] [PubMed] [Google Scholar]
- [8].Behar KL,den Hollander JA, Petroff OA, Hetherington HP,Prichard JW, Shulman RG, Effect ofhypoglycemic encephalopathy upon amino acids, high-energy phosphates, and pHi in the rat brain in vivo: detection by sequential 1Hand 31PNMR spectroscopy,J. Neurochem. 44(1985) 1045–1055, 10.1111/j.1471-4159.1985.tb08723.x. [DOI] [PubMed] [Google Scholar]
- [9].Scaduto RC, Davis EJ, The involvement of pyruvate cycling in the metabolism ofaspartate and glycerate by the perfused rat kidney, Biochem. J. 237 (1986) 691–698, 10.1042/bj2370691. [DOI] [PMC free article] [PubMed] [Google Scholar]
- [10].Watts AG, Donovan CM, Sweet talk in the brain: glucosensing, neural networks, and hypoglycemic counterregulation, Front. Neuroendocrinol. 31 (2010) 32–43, 10.1016/j.yfrne.2009.10.006. [DOI] [PMC free article] [PubMed] [Google Scholar]
- [11].Borg MA, Tamborlane WV, Shulman GI, Sherwin RS, Local lactate perfusion ofthe ventromedial hypothalamus suppresses hypoglycemic counterregulation, Diabetes 52 (52) (2003) 663–666, 10.2337/diabetes.52.3.663. [DOI] [PubMed] [Google Scholar]
- [12].Chan O, Cheng H, Herzog R, Sherwin RS, Increased GABAergic tone in the ventromedial hypothalamus contributes to suppression of counterregulatory responses after antecedent hypoglycemia, Diabetes 67 (2008) 1363–1370, 10.2337/db07-1559. [DOI] [PMC free article] [PubMed] [Google Scholar]
- [13].Chan O, Paranjape SA, Horblitt A, Zhu W, Sherwin RS, Lactate-induced release ofGABA in the ventromedial hypothalamus contributes to counterregulatory failure in recurrent hypoglycemia and diabetes, Diabetes 62 (2013) 4239–4246, 10.2337/db13-0770. [DOI] [PMC free article] [PubMed] [Google Scholar]
- [14].Hamase K, Inoue T, Morikawa A, Konno R, Zaitsu K, Determination offree D-proline and D-leucine in the brains of mutant mice lacking D-amino acid oxidase activity, Anal. Biochem. 298 (2001) 253–258, 10.1016/S0378-4347(01)00131-1. [DOI] [PubMed] [Google Scholar]
- [15].Bronowicka-Adamska P,Zagajewski J,Czubak J, Wróbel M, RP-HPLC method for quantitative determination of cystathionine, cysteine and glutathione: an application for the study ofthe metabolism ofcysteine in humanbrain,J. Chromatogr. B 789 (879) (2011) 2005–2009, 10.1016/j.jchromb.2011.05.026. [DOI] [PubMed] [Google Scholar]
- [16].Shariatgorji M, Nilsson A, Goodwin RJ, Kallback P, Schintu N, Zhang X, Crossman AR, Bezard E, Svenningsson P, Andren PE, Direct targeted quantitative molecular imaging ofneurotransmitters in brain tissue sections, Neuron 84 (2014) 697–707, 10.1016/j.neuron.2014.10.011. [DOI] [PubMed] [Google Scholar]
- [17].Bowman CE, Zhao L, Hartung T, Wolfgang MJ, Requirement forthe mitochondrial pyruvate carrier in mammalian development revealed by a hypomorphic allelic series, Mol. Cell. Biol. 36 (2016) 2089–2104, 10.1128/MCB.00166-16. [DOI] [PMC free article] [PubMed] [Google Scholar]
- [18].Zhu H, Zou G, Wang N, Zhuang M, Xiong W, Huang G, Single-neuron identification ofchemical constituents, physiological changes, and metabolism using mass spectrometry, Proc. Natl. Acad. Sci. U.S.A 114 (2017) 2586–2591, 10.1073/pnas.1615557114. [DOI] [PMC free article] [PubMed] [Google Scholar]
- [19].Kaminska A, Olejarz P, Borowczyk K, Gtowacki R, Chwatko G, Simultaneous determination of total homocysteine, cysteine, glutathione, and N-acetylcysteine in brain homogenates by HPLC, J. Sep. Sci. 41 (2018) 3241–3249, 10.1002/jssc.20180038. [DOI] [PubMed] [Google Scholar]
- [20].Lizarbe B, Soares AF, Larsson S,Duarte J, Neurochemical modifications in the hippocampus, cortex and hypothalamus of mice exposed to long-term high-fat diet, Front. Neurosci. 12(2018) 985, 10.3389/fnins.2018.00985. [DOI] [PMC free article] [PubMed] [Google Scholar]
- [21].Usuda K, Kawase T, Shigeno Y, Fukuzawa S, Fujii K, Zhang H, Tsukahara T, Tomonaga S, Watanabe G, Jin W, Nagaoka K, Hippocampal metabolism of amino acids by L-amino acid oxidase is involved in fear learning and memory, Sci. Rep. 8 (2018) 11073, 10.1038/s41598-018-28885-x. [DOI] [PMC free article] [PubMed] [Google Scholar]
- [22].Zhang M, Fang C, Smagin G, Derivatization forthe simultaneous LC/MS quantification of multiple neurotransmitters in extracellular fluid from rat brain microdialysis,J. Pharmaceut. Biomed. Anal 100 (2014) 357–364, 10.1016/j.jpba.2014.08.015. [DOI] [PubMed] [Google Scholar]
- [23].Chatham JC, Blackband SJ, Nuclear magnetic resonance spectroscopy and imaging in animal research, ILARJ. 42 (2001) 189–208, 10.1093/ilar.42.3.189. [DOI] [PubMed] [Google Scholar]
- [24].Rebane R, Herodes K, Comparison of three buffer solutions for amino acid derivatization and following analysis by liquid chromatography electrospray mass spectrometry,J. Chromatogr.A 1245 (2012) 134–142, 10.1016/j.chroma.2012.05.039. [DOI] [PubMed] [Google Scholar]
- [25].Rebane R, Oldekop ML, Herodes K, Comparison of amino acid derivatization reagents for LC-ESI-MS analysis. Introducing a novel phosphazene-based derivatization reagent,J. Chromatogr. B. 904 (2012) 99–106, 10.1016/j.jchromb.2012.07.029. [DOI] [PubMed] [Google Scholar]
- [26].Mandai SK, Shrestha PK, Alenazi FSH, Shakya M, Alhamami HN, Briski KP, Role ofhindbrainadenosine 5’-monophosphate-activated protein kinase (AMPK) in hypothalamic AMPK and metabolic neuropeptide adaptation to recurring insulin-induced hypoglycemia in the male rat, Neuropeptides 66 (2017) 25–35, 10.1016/j.npep.2017.08.001. [DOI] [PubMed] [Google Scholar]
- [27].Bheemanapally K, Ibrahim MMH, Briski KP, Combinatory high-resolution microdissection/ultra performance liquid chromatographic-mass spectrometry approach for small tissue volume analysis of rat brain glycogen, J. Pharm. Biomed.Anal. 178 (178)(2020), 112884, http://dx.doi.org/10.1016Zj.jpba.2019.112884. [DOI] [PMC free article] [PubMed] [Google Scholar]


