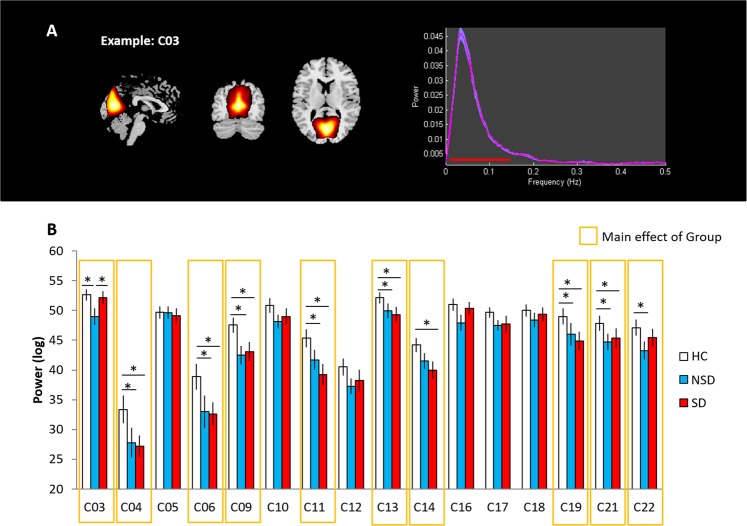
Fig. 2.
The network power spectra. a An example of power spectra, C03 (VN1). The sum of low frequency fluctuation power (red line, 0.01–0.15 Hz) was used to determine the strength of the signal of interest within the RSNs. b Group differences in power spectra. The yellow boxes indicate the RSN that showed a significant group effect (p < 0.05). The white bar represents the HC group, the blue bar represents the NSD group, and the red bar indicates the SD group. Error bars indicate the standard error (*p < 0.05)

