

Abstract
Organic dyes that absorb and emit in the near-infrared (NIR) region are potentially noninvasive, high-resolution, and rapid biological imaging materials. Indolizine donor-based cyanine and squaraine dyes with water-solubilizing sulfonate groups were targeted in this study due to strong absorptions and emissions in the NIR region. As previously observed for nonwater-soluble derivatives, the indolizine group with water-solubilizing groups retains a substantial shift toward longer wavelengths for both absorption and emission with squaraines and cyanines relative to classically researched indoline donor analogues. Very high quantum yields (as much as 58%) have been observed with absorption and emission >700 nm in fetal bovine serum. Photostability studies, cell culture cytotoxicity, and cell uptake specificity profiles were all studied for these dyes, demonstrating exceptional biological imaging suitability.
Graphical Abstract

INTRODUCTION
Near-infrared (NIR) emissive materials are intensely researched due to a plentiful number of practical applications, including biological imaging,1–8 photodynamic therapy,1,9–12 telecommunications,13–15 secure displays, which can be coupled to night vision technologies,16–18 and many other innovative areas of research.5,19–21 NIR biological imaging agents use low-energy photons in a spectral region where tissue is readily penetrated at a maximal depth optically.4,10,22,23 The desirable properties of biological imaging dyes include (1) absorbing and emitting light in the “therapeutic window” ranging from 700 to 1400 nm, (2) a significant Stokes shift to enable high-precision imaging, (3) efficient absorption and emission of photons through both a high molar absorptivity and quantum yield, and (4) water solubility. While there are many exciting dye design prospects being pursued in the literature,2 exceptional NIR emissive materials are still needed for practical biological imaging since current dyes fall short of meeting all of the desired criteria simultaneously.
Among NIR emissive dyes, squaraines21,24 and cyanines19,25 are ubiquitous.1,3,26 Previous research has frequently investigated indoline donor-based cyanine and squaraine dyes with indocyanine green (ICG) having been awarded FDA approval several decades ago.27,28 Both of these classes of dyes need design strategies that allow access to longer wavelength NIR photons in aqueous environments.2 In fact, the indoline squaraine absorbs outside the therapeutic window, which renders it impractical for use as a noninvasive biological imaging agent.29 To deepen the NIR absorbing properties of these dye classes, designs capable of extending the π-system through a conjugated donor (such as indolizine) are attractive.29–32 Recent photophysical studies using proaromatic indolizine donors in place of indoline donors show red-shifting of the absorption and emission profiles of these dyes firmly into the therapeutic window in nonaqueous environments (C5 and SQ compared to ICG and indoline squaraine, respectively; Figure 1).29–32 These studies indicated that in the case of phenyl-indolizine derivatives, the phenyl group does not play a significant role in tuning the absorption or emission energy values of the NIR indolizine dyes.29,30 This enables the use of the phenyl group to append water-soluble functionality without perturbing the core chromophore properties of the dyes, permitting the probing of the photophysical properties of the dyes in aqueous environments. Sulfonate-substituted dyes, SO3C5 and SO3SQ, were targeted given the water-solubilizing properties of sulfonate groups and FDA approval for human use by way of ICG (Figure 1). This work aims to compare the photophysical properties of SO3C5, SO3SQ, and benchmark ICG in a biologically relevant medium.
Figure 1.

Current work demonstrating water solubility of indolizine cyanine and indolizine squaraine dyes using sulfonate groups.
SYNTHESIS
The target dyes were synthesized in two steps from previously reported indolizine phenol 1 (Scheme 1).29 First, 1 was alkylated with butane sultone (2) in the presence of base to give sulfonate indolizine 3. Interestingly, this reaction required a careful selection of solvent and base to avoid significant side product formation as a carbon alkylated product (see Table S1 and Figure S1). Intermediate 3 is common to both SO3C5 and SO3SQ target dyes. The target sulfonate indolizine cyanine dye (SO3C5) is synthesized by reacting 3 with the methine bridge linker 4 in the presence of perchloric acid and acetic anhydride at room temperature similar to previously reported conditions in the literature.30 The target sulfonate indolizine squaraine (SO3SQ) is synthesized via an electrophilic aromatic substitution/condensation reaction between sulfonate indolizine 3 and squaric acid (5). Importantly, during optimization of the condensation reaction, it was found that the addition of small amounts of water led to an increase in product formation. Ultimately, running the reaction in nondried laboratory-grade methanol gave the highest yields (Table S2). Both target dyes are formed in an approximately 50% overall yield in this route over two steps.
Scheme 1.
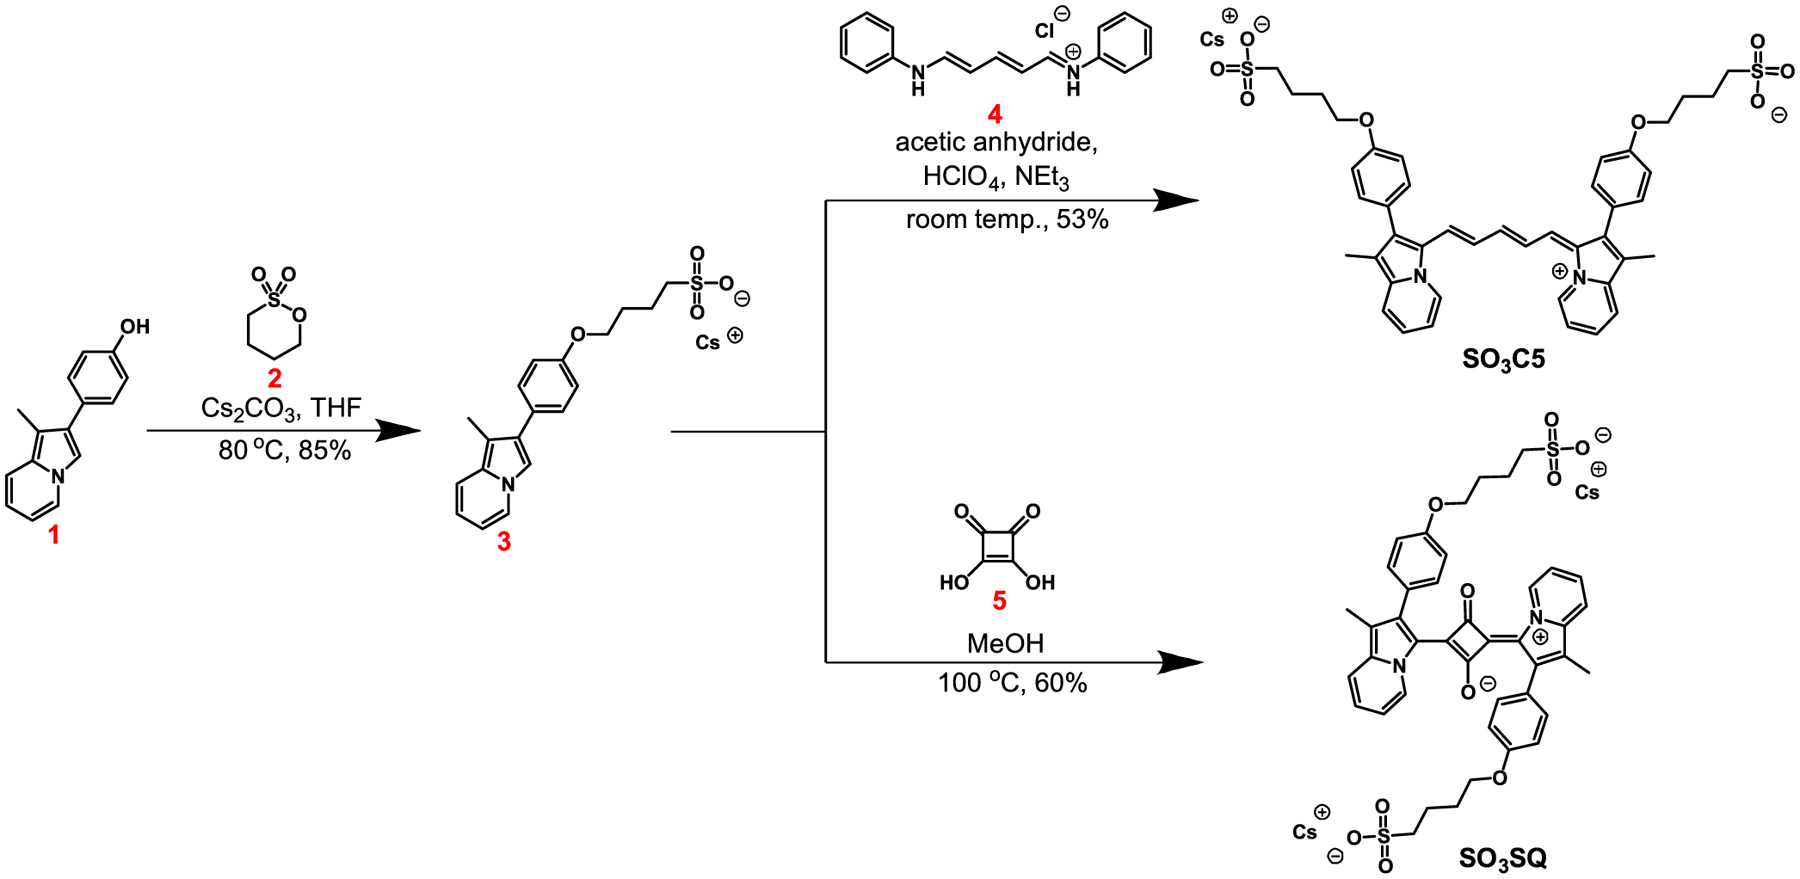
Synthetic Route to SO3C5 and SO3SQ
RESULTS AND DISCUSSION
With SO3C5 and SO3SQ in hand, absorption and emission studies were undertaken for comparison to ICG as a benchmark reference dye (Figures 2, S2 and S3; Table 1). Dimethyl sulfoxide (DMSO) and MeOH were also selected as solvents, which allows for the comparison of SO3C5 and SO3SQ to the previously reported dyes C5 and SQ, respectively (see Table S3 for solubility data).29,30 H2O and fetal bovine serum (FBS) were selected as well due to the biological relevance and for a convenient analysis of how these dyes will behave with biological matrix elements in place, as has been previously reported in the literature.4,33,34 The absorption profiles of both dyes in DMSO and MeOH are not significantly changed relative to the previously published dyes with no sulfonate groups.29,30 The absorption curves in H2O and FBS are similar to the curves observed in DMSO and MeOH for SO3SQ; however, the absorption curve of SO3C5 in water deviates shape significantly, which is likely due to aggregation in water (Figure S4). Upon changing concentrations, no significant evidence of aggregate disruption could be observed down to concentrations near the detection limit of the spectrometer (Figure S5). Notably, the evidence of aggregation of SO3SQ (modest amounts) and ICG (significant amounts) in H2O at concentrations of ≥10−5 M is apparent at higher-energy wavelengths when the absorption curves are overlaid with curves at 10−6 M in H2O, which appear to have disrupted aggregate features (Figures S6 and S7).35 It should be noted that while all three dyes were observed to form aggregates in H2O via dynamic light scattering analysis at 5 × 10⁻⁶ M (Figure S8), SO3C5 is the only dye that shows a significant impact of this aggregative behavior from the absorption profile. Interestingly, upon dissolving SO3C5 in FBS, the original curve shape observed in DMSO and MeOH is regained with a notable red shift of the λmax value by about 40 nm (Figure 2).
Figure 2.

Vis–NIR region molar absorptivity and normalized fluorescence emission of SO3C5 (top) and SO3SQ (bottom) in DMSO, MeOH, H2O, and FBS at 5 × 10⁻⁶ M.
Table 1.
Optical Properties of SO3C5, SO3SQ, and ICG in Water, Fetal Bovine Serum (FBS), Methanol, and DMSO
| dye | solvent | abs. max. (nm) | emis. max. (nm) | stokes shift (nm|eV|cm−1) | ε (M−1 cm−1) | Φ (%) | MB (ε × Φ) |
|---|---|---|---|---|---|---|---|
| SO3C5 | DMSO | 801 | 821 | 20 | 0.04 | 304 | 109 000 | 2.0 | 2180 |
| MeOH | 791 | 817 | 26 | 0.05 | 403 | 139 000 | 0.3 | 420 | |
| FBS | 842 | 808 | 61 000 | 0.1 | 60 | ||
| water | 726 | 808 | 40 000 | 0.05 | 20 | ||
| SO3SQ | DMSO | 720 | 734 | 14 | 0.03 | 265 | 145 000 | 8.6 | 12 500 |
| MeOH | 704 | 719 | 15 | 0.04 | 296 | 156 000 | 0.8 | 1250 | |
| FBS | 719 | 730 | 11 | 0.03 | 210 | 113 000 | 58.3 | 65 900 | |
| water | 698 | 716 | 18 | 0.04 | 360 | 93 000 | 0.3 | 280 | |
| ICG | DMSO | 794 | 825 | 31 | 0.06 | 473 | 211 000 | 11.0 | 23 200 |
| MeOH | 784 | 819 | 35 | 0.07 | 545 | 230 000 | 4.3 | 9900 | |
| FBS | 798 | 827 | 29 | 0.05 | 439 | 174 000 | 9.3 | 16 200 | |
| water | 779 | 812 | 33 | 0.06 | 522 | 157 000 | 0.5 | 780 |
FBS is commonly used in photophysical studies for NIR dyes intended for biological use as the albumin proteins help to better separate dye molecules from one another as is dramatically demonstrated here. The disruption of aggregation under biologically relevant conditions is encouraging as it leads to the minimization of thermal relaxations resulting in increased quantum yields. For comparison, the curve shape of ICG retains the same profile in all four solvents (Figure S3). The molar absorptivities are similar for SO3C5 and SO3SQ in MeOH and DMSO at approximately 110 000–150 000 M−1 cm−1 (Figure 2 and Table 1). In H2O and FBS, the SO3C5 molar absorptivities drop substantially to ~60 000 M−1 cm−1 or less. For SO3SQ in H2O or FBS, the molar absorptivities remain significantly higher at 113 000–93 000 M−1 cm−1. The molar absorptivity values and order of λmax values follow the same trend for SO3SQ and ICG with each of the four solvents. SO3C5 deviates from this trend with obvious aggregation in water-based solutions. Compared to ICG, the λmax of SO3C5 is shifted toward lower energy values (~15 nm), and the λmax of SO3SQ is shifted toward higher energy by about 100 nm (0.21 eV, Table 1).
Fluorescence spectroscopy was probed with each of the dyes to understand the excited-state behavior. Prior reports on C5 and SQ in organic solvents such as dichloromethane have shown Stokes shifts of 43 and 50 nm, respectively (taken as the difference between the λmaxabs and λmaxemis).29–31 The Stokes shifts of both sulfonate dyes decreased to ≤26 nm (≤400 cm−1) in all solvents where single molecule behavior is likely occurring. As the magnitude of the Stokes shift is directly related to the reorganization energy of the dye, the decrease in the Stokes shift demonstrates that there is smaller reorganization energy of SO3SQ and SO3C5 relative to the nonsulfonate-substituted dyes. Stokes shifts for SO3C5 could not be determined in FBS and H2O due to the presence of multiple species due to aggregation, leading to apparent emission energies higher than the lowest energy features of the combined absorption spectrum of all monomer and aggregate states. This suggests that in aqueous solvents, the higher-energy absorption feature of SO3C5 corresponds to the observed emission, while the lower-energy absorption feature is either weakly emissive or has an emission beyond the InGaAs fluorimeter detection limit.
Quantum yields (Φ) for each dye were calculated as relative values with respect to ICG in DMSO at 11.0% as the benchmarking system (Table 1).36 The quantum yields for ICG in water, MeOH, and FBS were calculated with respect to ICG in DMSO. Previously reported quantum yields for C5 in organic solvents ranged from 2 to 3.6%;30,31 however, SO3C5 shows Φ values below 1% in all three protic solvents examined. In DMSO, a Φ of 2% is observed, which is similar to the values observed for the parent C5 structure. The Φ data for SO3SQ is exceptionally intriguing. In water or methanol, the Φ of SO3SQ is <1%, which is not uncommon in the NIR spectral region. Upon changing the solvent environment to DMSO, a significantly increased Φ value of 8.6% is observed, which can be rationalized as the protic environments promoting non-radiative decay pathways leading to low Φ values in water and methanol. However, SO3SQ in FBS gives a 58% quantum yield, which is a number that is truly remarkable in the field of NIR dyes and encourages further studies with this material. The dramatic enhancement of Φ values in the complex biologically relevant environment of FBS has been previously observed in the literature.33 By comparison, the benchmark dye ICG shows a much lower 9% Φ in FBS.
An important metric for biological imaging materials is the molecular brightness (MB), which balances the contributions of ε and Φ through the equation MB = ε × Φ. MB is a good indicator of the amount of dye needed to give comparable fluorescence signal intensities among dyes with varying molar absorptivities and quantum yields. The MB values for SO3C5 are quite low in all solvents at ≤2180 M−1 cm−1 when compared with ICG at a maximum value of 23 000 M−1 cm−1 in DMSO (Table 1). Notably, the observed MB value for ICG is low in H2O at 780 M−1 cm−1 but remains high in the remaining solvents examined (>9000 M−1 cm−1). SO3SQ shows an MB value of >65 000 M−1 cm−1 in FBS, which is dramatically larger than the substantial 23 000 M−1 cm−1 value for ICG and is likely one of the largest values in this spectral region known in the literature. This indicates that significantly less dye (~3× less) would be needed with SO3SQ to generate the same amount of signal as ICG.
A key desirable property of biological imaging dyes is prolonged photostability.37 To probe this, SO3C5, SO3SQ, and ICG were dissolved in water under an ambient atmosphere at a concentration of 1 × 10⁻⁶ M and irradiated with a solar-simulated light-emitting diode (LED) spectrum from 400 to 1100 nm with white light irradiation (Figures 3 and S9–S11). Under these conditions, ICG has a half-life of approximately 35 min with complete consumption by 80 min. Both SO3C5 and SO3SQ show a higher photostability than ICG with half-lives of 50 and 100 min, respectively. The higher photostability of SO3SQ can be attributed, in part, to the squaraine structure being devoid of double-substituted alkenes, which are known to undergo various degradation pathways with ICG.38 In MeOH, SO3SQ and ICG are exceptionally stable with half-lives >24 h (Figures S12−S15). SO3C5 is notably less stable than ICG or SO3SQ in MeOH where the dye appears to be deaggregated, which suggests that the aggregate states of SO3C5 in water could impart some photostability since this dye is more stable than ICG in water. Overall, SO3SQ has a likely record quantum yield in this spectral region, a high molar absorptivity, an exceptional molecular brightness, and the highest photostability measured in this study in H2O.
Figure 3.
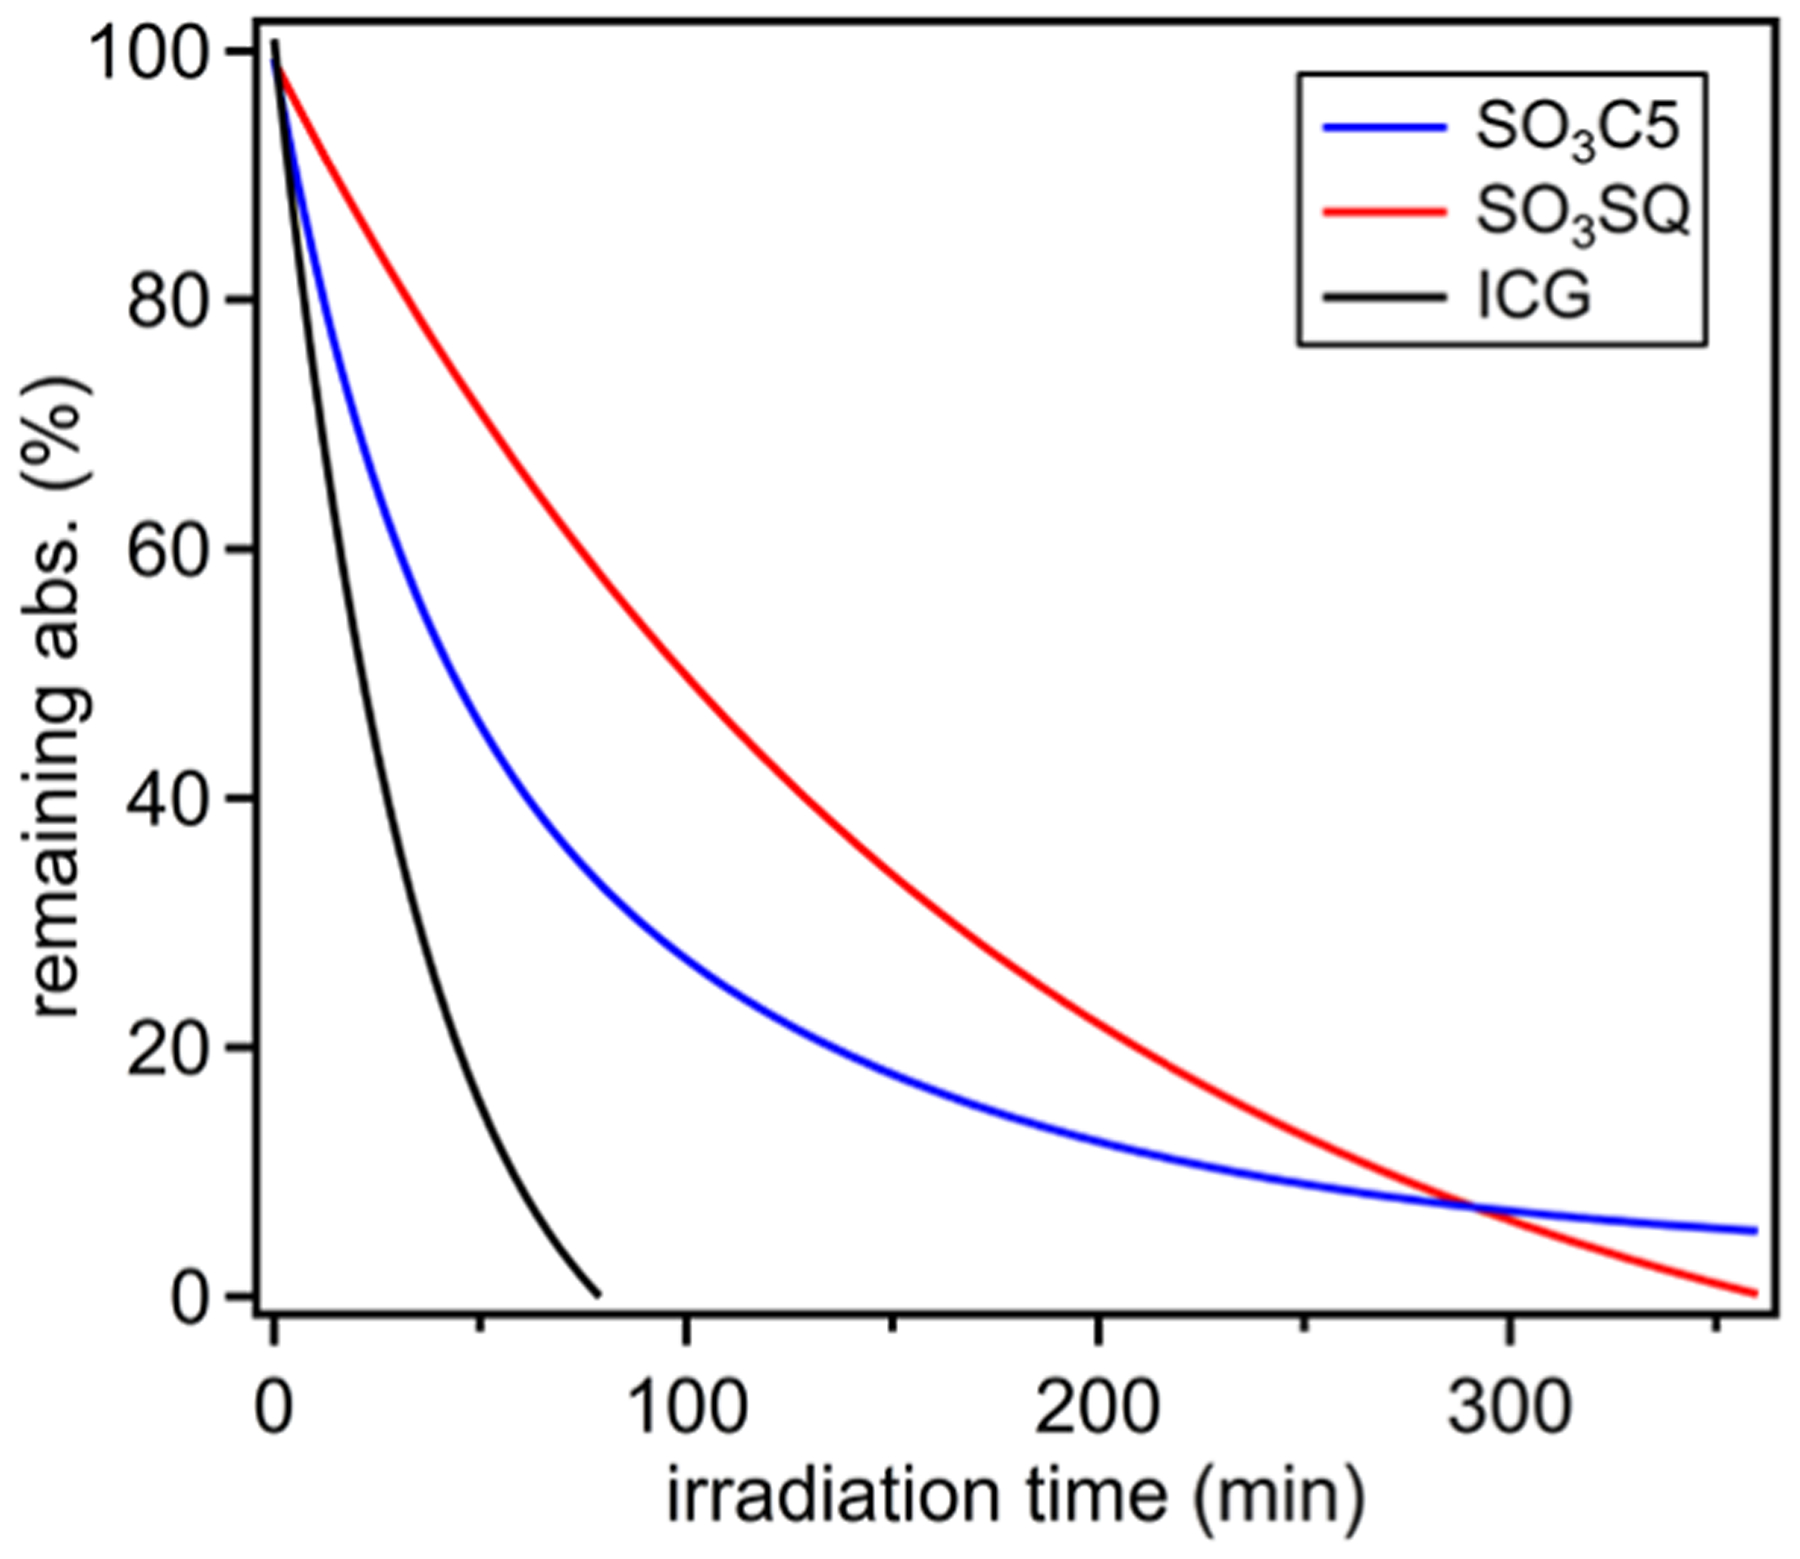
Photostability of SO3C5, SO3SQ, and ICG in water.
Finally, the cytotoxicity and cellular uptake of SO3C5 and SO3SQ were examined with human (HEK293) and Drosophila (S2) tissue culture cells (Figure 4). HEK cells are a human cell line grown at physiological conditions found in mammals. Performance and cytotoxicity of the dyes in HEK cells inform in vivo biocompatibility for clinical and veterinary settings for use in diagnostic or therapeutic technologies. In contrast, S2 cells grow at a lower temperature under normal atmospheric conditions and are derived from invertebrates (fruit fly embryos). Dye behavior in these cells is a proxy for understanding the environmental impact of these compounds. Both SO3C5 and SO3SQ show < 25% HEK cell death at or below 2 mM concentrations. At high dye loadings (10 mM), cell death is near 30%, which indicates that these dyes are relatively benign toward a human cell line. A similar trend is observed with the cytotoxicity studies of the S2 cell line, although ≥2 mM SO3C5 and 10 mM SO3SQ show >50% cell death. S2 cells are more phagocytically active compared to HEK293 cells, which may explain greater sensitivity to the dyes. This suggests that low-to-moderate concentrations of the dyes are not toxic to animal cells. SO3C5 and SO3SQ cell uptake studies were undertaken with LysoTracker by comparing the fluorescence overlap of each NIR dye with LysoTracker. With these studies, the SO3C5 dye shows a Pearson’s correlation coefficient of 0.9, indicating that HEK cells largely uptake this dye into the cell lysosomes. A similarly high Pearson’s correlation coefficient is observed for SO3SQ and S2 cells at 0.7. This shows that nonfavorable interactions of the dye with cell organelles are minimized.
Figure 4.

Interaction of SO3C5 and SO3SQ dyes with human (HEK) and Drosophila (S2) cells. (A–D) Percent cytotoxicity for each combination as determined by the LDH assay. X-axis values are mM. Error bars represent standard error, and letter denotes significance groups determined by Tukey’s HSD (p ≤ 0.05). (E, F) Confocal images of live HEK (E) and S2 (F) cells after exposure to dye and LysoTracker. Left panels show the merging of bright field, lysotracker (green), and dye (red). Dye fluorescence alone is shown in the right panel (E′, F′). Pearson’s correlation coefficient (noted as the overlap coefficient) shows colocalization between the dye and LysoTracker.
CONCLUSIONS
The need for biological imaging dyes that absorb and emit strongly in the NIR region is of paramount importance to society since this could enable noninvasive, nontoxic, and rapid imaging of medical patients and biological specimens. Indolizine donor-based cyanine and squaraine dyes with attached sulfonate groups were synthesized to provide a direct comparison in biological medium to benchmark ICG. The increased donor strength of the indolizine compared to that of the indoline allowed for these dyes to have a more red-shifted absorption and emission than their indoline counterparts. SO3SQ demonstrated a remarkable quantum yield of 58.3% (MB of > 65 000) in FBS, which is notable in that this is representative of the optical properties inside of a biological medium. SO3C5 shows significant concentration-independent aggregation effects in water, while SO3SQ shows minimal aggregation in water. Prolonged irradiation studies demonstrate that both of the indolizine dyes have a significantly higher photostability than ICG in water. Cell culture studies exhibited high specificity for lysosomal uptake with overlap coefficients of 0.9 and 0.7 for SO3C5 and SO3SQ, respectively, as well as low levels of cytotoxicity. The high molecular brightness, simple synthesis, prolonged photostability, and low toxicity of SO3SQ show that it is an attractive potential NIR biological imaging material with very high metrics significantly surpassing the benchmark ICG over a range of tests.
EXPERIMENTAL SECTION
All commercially obtained reagents and solvents were used as received without further purification. All heating was done in an oil bath. Thin-layer chromatography (TLC) was conducted with Merck KGaA TLC silica gel 60 RP-18 F254S glass-backed plates and visualized with UV. Flash column chromatography was performed using a CombiFlash Rf + system. RediSep cartridges were charged with silica gel from RediSep Rf reversed-phase C18, 40–63 μm (230–400 mesh). 1H and 13C {1H} NMR spectra were recorded on a Bruker Ascend-300 (300 MHz) spectrometer and are reported in ppm using solvent as an internal standard (DMSO-d6 at 2.50 ppm and CD3OD-d4 at 3.31 ppm). Data are reported as s = singlet, d = doublet, t = triplet, q = quartet, p = pentet, m = multiplet, b = broad, ap = apparent, dd = doublet of doublets, dt = doublet of triplets; coupling constant(s) are in Hz; integration. UV–vis–NIR spectra were measured13 with a Cary 5000 UV–vis–NIR spectrometer. For photostability studies, samples were irradiated with a Class AAA Rated G2V pico LED solar simulator providing a spectral range from 400 to 1100 nm at 100 mW cm−2. High-resolution mass spectrometry (HRMS) spectra were obtained with a quadrupole time-of-flight (QTOF) HRMS utilizing nanospray ionization. The mass analyzer was set to the 200–2000 Da range. Infrared spectra were recorded with an Agilent Cary 660 attenuated total reflection-Fourier transform infrared (ATR-FTIR) spectrometer. All emission data was obtained using a Horiba PTI fluorimeter. Excitation wavelengths were achieved by passing white light through a dual-grating system. Photons were collected through a photomultiplier tube. The relative quantum yields were obtained using this equation
For the equation above, E is the sum of emission intensities and A is the maximum absorbance, η is the refractive index of the solvent used, and Φ denotes the quantum yield. The standard used to obtain the relative quantum yields was indocyanine green (ICG) with a quantum yield of 11% in DMSO.36
Cell Imaging.
HEK293 cells were grown in standard conditions (37 °C, 5% CO2) in Dulbecco’s modified Eagle’s medium (DMEM) media supplemented with 10% FBS. S2 cell cultures were maintained in S2 media with 10% FBS at 25 °C. Dye cytotoxicity was determined with a CyQUANT LDH Cytotoxicity Assay Kit™ Invitrogen using a BioTek Synergy™ H1 microplate reader. Cells were imaged with a Zeiss LSM 510 META laser scanning confocal microscope following a 24 h exposure to dyes. Lysosome was visualized with a LysoTracker Green DND-26 (Invitrogen) following the manufacturer’s protocols.
Cesium 4-(4-(1-Methylindolizin-2-yl)phenoxy)butane-1-sulfonate (3).
To a flame-dried round-bottom flask equipped with a stir bar and reflux condenser that had been purged with N2 for 10 min were added 4-(1-methylindolizin-2-yl)phenol (1) (1.00 g, 4.48 mmol),29 Cs2CO3 (3.65 g, 11.20 mmol), and 1,4-butane sultone (2) (1.15 mL, 11.20 mmol). The reaction mixture was dissolved in tetrahydrofuran (THF) (140 mL) and heated to 80 °C in an oil bath for 16 h. The reaction mixture was cooled down to room temperature and yielded a light brown precipitate. Ethyl acetate was added (100 mL) to further precipitate the product, which was subsequently filtered to yield the crude material. The crude mixture was purified by recrystallization in water to yield a pure golden brown metallic in appearance solid (1.87 g, 85%). 1H NMR (300 MHz, DMSO-d6; Figure S16) δ 8.13 (d, J = 6.9 Hz, 1H), 7.63 (s, 1H), 7.42 (d, J = 8.7 Hz, 2H) 7.37 (d, J = 9.1 Hz, 1H), 6.99 (d, J = 8.7 Hz, 2H), 6.60 (dd, J = 8.1, 7.2 Hz, 1H), 6.45 (dt, J = 7.1, 1.2 Hz, 1H), 3.98 (t, J = 5.8 Hz, 2H), 2.46 (t, J = 7.1 Hz, 2H), 2.34 (s, 3H), 1.85–1.65 (m, 4H). 13C {1H} NMR (300 MHz, DMSO-d6; Figure S17) δ 157.3, 130.2, 129.1, 127.8, 127.8, 125.2, 117.0, 115.6, 114.6, 109.8, 109.7, 104.2, 67.3, 51.1, 28.1, 22.0, 9.7. HRMS m/z calculated for C19H20NO4S [M–Cs]−: 358.1119, found 358.1128. IR (neat, cm−1) 3413, 3310, 3064, 3048, 2931, 2860, 1675, 1611, 1535, 1515. Melting point (dec.): 226–232 °C.
Cesium 4-(4-(1-Methyl-3-((1E,3E)-5-((Z)-1-methyl-2-(4-(4-sulfonatobutoxy)phenyl)-3H-indolizin-4-ium-3-ylidene)-penta-1,3-dien-1-yl)indolizin-2-yl)phenoxy)butane-1-sulfonate (SO3C5).
To a round-bottom flask equipped with a stir bar was added cesium 4-(4-(1-methylindolizin-2-yl)phenoxy)butane-1-sulfonate (3) (0.50 g, 1.02 mmol) to acetic anhydride (10.2 mL) followed by perchloric acid (0.088 mL, 1.02 mmol) and N-[5-(phenylamino)-2,4-pentadienylidene]aniline monohydrochloride (4) (0.15 g, 0.51 mmol). The mixture was then sonicated and stirred until all of the starting material appeared to have been consumed in this first phase of the reaction (about 10 min). When the starting material was no longer visible, the reaction was allowed to stir for another 10 min before the addition of triethylamine (0.17 mL, 1.22 mmol). The reaction mixture quickly turned green and was allowed to stir for 2 h before diethyl ether was added to precipitate the crude product. The precipitate was filtered and rinsed once more with diethyl ether, collecting the solids. The solids were purified via reversed-phase column chromatography beginning with 100% H2O and gradually transitioning to 40:60 ethanol/H2O. The water was removed by blowing air over the surface of the solution to avoid heating. The pure product was yielded as a dark green solid (250 mg, 53%). 1H NMR (300 MHz, CD3OD-d4; Figure S18) δ 8.89 (d, J = 6.8 Hz, 2H), 7.73 (d, J = 8.6 Hz, 2H), 7.66–7.54 (m, 4H), 7.42–7.22 (m, 7H), 7.12 (d, J = 8.5 Hz, 4H), 6.57 (t, J = 13.1 Hz, 2H), 4.16 (t, J = 5.9 Hz, 4H), 2.95 (t, J = 7.0 Hz, 4H), 2.20 (s, 6H), 2.14–1.94 (m, 8H). 13C {1H}NMR (300 MHz, CD3OD-d4; Figure S19) δ 168.4, 160.9, 144.4, 140.1, 135.6, 132.6, 131.3, 129.7, 127.4, 126.2, 122.5, 121.2, 119.4, 118.0, 116.1, 68.9, 52.4, 29.5, 23.1, 9.3. HRMS m/z calculated for C43H44CsN2O8S2 [M + H]+ : 913.1588, found 913.1606. IR (neat, cm−1): 3375 (br), 3099, 3070, 3033, 2917, 2861, 1651, 1611, 1521, 1508. UV–vis–NIR (DMSO) λmax = 801 nm; UV–vis–NIR (MeOH) λmax = 791 nm; UV–vis–NIR (H2O) λmax = 726 nm; UV–vis–NIR (FBS) λmax = 842 nm. Melting point (dec.): 211–217 °C.
Cesium (Z)-4-(4-(1-Methyl-3-(3-(1-methyl-2-(4-(4-sulfonatobutoxy)phenyl)-3H-indolizin-4-ium-3-ylidene)-2-oxido-4-oxocyclobut-1-en-1-yl)indolizin-2-yl)phenoxy)-butane-1-sulfonate (SO3SQ).
To a pressure flask equipped with a stir bar were added cesium 4-(4-(1-methylindolizin-2-yl)phenoxy)-butane-1-sulfonate (3) (0.100 g, 0.204 mmol) and 3,4-dihydroxy-1,2-cyclobutanedione (5) (0.012 g, 0.102 mmol). The reagents were dissolved in 10 mL methanol and degassed with N2 for 10 min. The reaction mixture was then heated to 100 °C in an oil bath for 6 h. The reaction mixture was then concentrated, and the solids were further purified via reversed-phase column chromatography beginning with 100% H2O and gradually transitioning to 40:60 ethanol/H2O. The water was removed by blowing air over the surface of the solution as the product appeared to be sensitive to heat. The pure product was yielded following this step as a metallic red solid in appearance (65 mg, 60%). 1H NMR (300 MHz, CD3OD-d4; Figure S20) δ 9.76 (d, J = 6.9 Hz, 2H), 7.57 (d, J = 8.7 Hz, 2H), 7.37 (dd, J = 6.8, 1.0 Hz, 2H), 7.23 (d, J = 8.6 Hz, 4H), 7.04–6.95 (m, 6H), 4.13 (t, J = 6.0 Hz, 4H), 2.95 (t, J = 7.0 Hz, 4H), 2.21 (s, 6H), 2.12–1.83 (m, 8H). 13C {1H} NMR (300 MHz, CD3OD-d4; Figure S21) δ 177.8, 166.1, 160.1, 143.2, 138.6, 134.9, 132.9, 128.9, 127.7, 121.0, 119.5, 118.4, 116.1, 114.8, 68.7, 52.5, 29.6, 23.1, 9.5. HRMS m/z calculated for C42H39N2O10S2 [M–2Cs + 2H]− : 795.2052, found 795.2050. IR (neat, cm −1): 3398 (br), 3068, 3038, 2919, 2864, 1733, 1600, 1570, 1523. UV–vis–NIR (DMSO) λmax = 720 nm; UV–vis–NIR (MeOH) λmax = 704 nm; UV–vis–NIR (H2O) λmax = 699 nm; UV–vis–NIR (FBS) λmax = 719 nm. Melting point: 240–244 °C.
Photostability Studies.
All photostability studies were conducted at a concentration of 1 × 10⁻⁶ M to maintain consistency and deter any aggregative effects throughout the photodecomposition process. The samples were irradiated with a white LED lamp providing a spectral range from 400 to 1100 nm. The experiment was allowed to take place under ambient conditions without any further precautions to remove oxygen from the system. UV–vis–NIR was used to periodically measure the decline in absorption with respect to the λmax. The photostability in methanol was conducted over a period of 24 h, while the photostability in water was conducted over a period of just 6 h as the photodecomposition was observed within a shorter time frame.
Supplementary Material
ACKNOWLEDGMENTS
The authors thank the National Science Foundation for Award 1757220. W.M. thanks the Sally McDonnell Barksdale Honors College for funding support.
Footnotes
Supporting Information
The Supporting Information is available free of charge at https://pubs.acs.org/doi/10.1021/acs.joc.9b03108.
Photostability studies; molar absorptivity and normalized emission of ICG in several solvents; electronic absorption studies; fluorescence studies; 1H NMR and 13C {1H} NMR for the prepared compounds; and solubility studies (PDF)
Complete contact information is available at: https://pubs.acs.org/10.1021/acs.joc.9b03108
The authors declare no competing financial interest.
Contributor Information
Riley N. Bessetti, Department of Biological Sciences, University of Southern Mississippi, Hattiesburg, Mississippi 39406, United States.
Jacqueline N. Gayton, Department of Chemistry and Biochemistry, University of Mississippi, University, Mississippi 38677, United States.
Alex S. Flynt, Department of Biological Sciences, University of Southern Mississippi, Hattiesburg, Mississippi 39406, United States
REFERENCES
- (1).Luo S; Zhang E; Su Y; Cheng T; Shi C A Review of NIR Dyes in Cancer Targeting and Imaging. Biomaterials 2011, 32, 7127–7138. [DOI] [PubMed] [Google Scholar]
- (2).Li X; Gao X; Shi W; Ma H Design Strategies for Water-Soluble Small Molecular Chromogenic and Fluorogenic Probes. Chem. Rev 2014, 114, 590–659. [DOI] [PubMed] [Google Scholar]
- (3).Guo Z; Park S; Yoon J; Shin I Recent Progress in the Development of Near-Infrared Fluorescent Probes for Bioimaging Applications. Chem. Soc. Rev 2014, 43, 16–29. [DOI] [PubMed] [Google Scholar]
- (4).Jin T Review-Recent Progress in NIR Fluorophores Emitting over 1000 nm for Bioimaging. ECS J. Solid State Sci. Technol 2019, 8, R9–R13. [Google Scholar]
- (5).Zhu S; Tian R; Antaris AL; Chen X; Dai H Near-Infrared-II Molecular Dyes for Cancer Imaging and Surgery. Adv. Mater 2019, 31, No. 1900321. [DOI] [PMC free article] [PubMed] [Google Scholar]
- (6).Wang W; Ma Z; Zhu S; Wan H; Yue J; Ma H; Ma R; Yang Q; Wang Z; Li Q; Qian Y; Yue C; Wang Y; Fan L; Zhong Y; Zhou Y; Gao H; Ruan J; Hu Z; Liang Y; Dai H Molecular Cancer Imaging in the Second Near-Infrared Window Using a Renal-Excreted NIR-II Fluorophore-Peptide Probe. Adv. Mater 2018, 30, No. 1800106. [DOI] [PMC free article] [PubMed] [Google Scholar]
- (7).Zhang XD; Wang H; Antaris AL; Li L; Diao S; Ma R; Nguyen A; Hong G; Ma Z; Wang J; Zhu S; Castellano JM; Wyss-Coray T; Liang Y; Luo J; Dai H Traumatic Brain Injury Imaging in the Second Near-Infrared Window with a Molecular Fluorophore. Adv. Mater 2016, 28, 6872–6879. [DOI] [PMC free article] [PubMed] [Google Scholar]
- (8).Owens EA; Henary M; El Fakhri G; Choi HS Tissue-Specific Near-Infrared Fluorescence Imaging. Acc. Chem. Res 2016, 49, 1731–1740. [DOI] [PMC free article] [PubMed] [Google Scholar]
- (9).Detty MR; Gibson SL; Wagner SJ Current Clinical and Preclinical Photosensitizers for Use in Photodynamic Therapy. J. Med. Chem 2004, 47, 3897–3915. [DOI] [PubMed] [Google Scholar]
- (10).Zhao J; Zhong D; Zhou S NIR-I-to-NIR-II Fluorescent Nanomaterials for Biomedical Imaging and Cancer Therapy. J. Mater. Chem. B 2018, 6, 349–365. [DOI] [PubMed] [Google Scholar]
- (11).Sun X; Zhuang B; Zhang M; Jiang H; Jin Y Intratumorally Injected Photothermal Agent-Loaded Photodynamic Nanocarriers for Ablation of Orthotopic Melanoma and Breast Cancer. ACS Biomater. Sci. Eng 2019, 5, 724–739. [DOI] [PubMed] [Google Scholar]
- (12).Davies KS; Linder MK; Kryman MW; Detty MR Extended Rhodamine Photosensitizers for Photodynamic Therapy of Cancer Cells. Bioorg. Med. Chem 2016, 24, 3908–3917. [DOI] [PubMed] [Google Scholar]
- (13).Suzuki H Organic Light-Emitting Materials and Devices for Optical Communicaiton Technology. J. Photochem. Photobiol., A 2004, 166, 155–161. [Google Scholar]
- (14).Hales JM; Barlow S; Kim H; Mukhopadhyay S; Brédas J-L; Perry JW; Marder SR Design of Organic Chromophores for All-Optical Signal Processing Applications. Chem. Mater 2014, 26, 549–560. [Google Scholar]
- (15).Samuel IDW; Turnbull GA Organic Semiconductor Lasers. Chem. Rev 2007, 107, 1272–1295. [DOI] [PubMed] [Google Scholar]
- (16).Tuong LK; Chen-Cheng R-W; Lin H-W; Shiau Y-J; Liu S-H; Chou P-T; Tsao C-S; Huang Y-C; Chi Y Near-Infrared Organic Light-Emitting Diodes with Very High External Quantum Efficiency and Radiance. Nat. Photonics 2017, 11, 63–68. [Google Scholar]
- (17).Ibrahim-Ouali M; Dumur F Recent Advances on Metal-Based Near-Infrared and Infrared Emitting OLEDs. Molecules 2019, 24, 1412. [DOI] [PMC free article] [PubMed] [Google Scholar]
- (18).Qian G; Wang ZY Near-Infrared Organic Compounds and Emerging Applications. Chem. Asian J 2010, 5, 1006–1029. [DOI] [PubMed] [Google Scholar]
- (19).Bricks JL; Slominskii YL; Panas ID; Demchenko AP Fluorescent J-Aggregates of Cyanine Dyes: Basic Research and Applications Review. Methods Appl. Fluoresc 2017, 6, No. 012001. [DOI] [PubMed] [Google Scholar]
- (20).Wang J; Lv F; Liu L; Ma Y; Wang S Strategies to Design Conjugated Polymer Based Materials for Biological Sensing and Imaging. Coord. Chem. Rev 2018, 354, 135–154. [Google Scholar]
- (21).Ilina K; MacCuaig W; Laramie M; Jeouty JN; McNally LR; Henary M Squaraine Dyes: Molecular Design for Different Applications and Remaining Challenges. Bioconjugate Chem. 2019, DOI: 10.1021/acs.bioconjchem.9b00482. [DOI] [PMC free article] [PubMed] [Google Scholar]
- (22).Yang Z; Sharma A; Qi J; Peng X; Lee DY; Hu R; Lin D; Qu J; Kim JS Super-Resolution Fluorescent Materials: An Insight into Design and Bioimaging Applications. Chem. Soc. Rev 2016, 45, 4651–4667. [DOI] [PubMed] [Google Scholar]
- (23).Smith AM; Mancini MC; Nie S Bioimaging: Second Window for in Vivo Imaging. Nat. Nanotechnol 2009, 4, 710–711. [DOI] [PMC free article] [PubMed] [Google Scholar]
- (24).Gao FP; Lin YX; Li LL; Liu Y; Mayerhoffer U; Spenst P; Su JG; Li JY; Wurthner F; Wang H Supramolecular Adducts of Squaraine and Protein for Noninvasive Tumor Imaging and Photothermal Therapy in Vivo. Biomaterials 2014, 35, 1004–1014. [DOI] [PubMed] [Google Scholar]
- (25).Shindy HA Fundamentals in the Chemistry of Cyanine Dyes: A Review. Dyes Pigm 2017, 145, 505–513. [Google Scholar]
- (26).Escobedo JO; Rusin O; Lim S; Strongin RM NIR Dyes for Bioimaging Applications. Curr. Opin. Chem. Biol 2010, 14, 64–70. [DOI] [PMC free article] [PubMed] [Google Scholar]
- (27).Keereweer S; Van Driel PBAA; Snoeks TJA; Kerrebijn JDF; Baatenburg de Jong RJ; Vahrmeijer AL; Sterenborg HJCM; Löwik CWGM Optical Image-Guided Cancer Surgery: Challenges and Limitations. Clin. Cancer Res 2013, 19, 3745–3754. [DOI] [PubMed] [Google Scholar]
- (28).Lerchenberger M; Gundogar U; Al Arabi N; Gallwas JKS; Stepp H; Hallfeldt KKJ; Ladurner R Indocyanine Green Fluorescence Imaging During Partial Adrenalectomy. Surg. Endosc 2019, 1–6. [DOI] [PubMed] [Google Scholar]
- (29).McNamara LE; Rill TA; Huckaba AJ; Ganeshraj V; Gayton J; Nelson RA; Sharpe EA; Dass A; Hammer NI; Delcamp JH Indolizine-Squaraines: NIR Fluorescent Materials with Molecularly Engineered Stokes Shifts. Chem. - Eur. J 2017, 23, 12494–12501. [DOI] [PubMed] [Google Scholar]
- (30).Gayton J; Autry SA; Meador W; Parkin SR; Hill GA; Hammer NI; Delcamp JH Indolizine-Cyanine Dyes: Near Infrared Emissive Cyanine Dyes with Increased Stokes Shifts. J. Org. Chem 2019, 84, 687–697. [DOI] [PubMed] [Google Scholar]
- (31).Gayton JN; Autry S; Fortenberry RC; Hammer NI; Delcamp JH Counter Anion Effect on the Photophysical Properties of Emissive Indolizine-Cyanine Dyes in Solution and Solid State. Molecules 2018, 23, 3051. [DOI] [PMC free article] [PubMed] [Google Scholar]
- (32).Rathnamalala CSL; Gayton JN; Dorris AL; Autry SA; Meador W; Hammer NI; Delcamp JH; Scott CN Donor-Acceptor-Donor NIR II Emissive Rhodindolizine Dye Synthesized by C-H Bond Functionalization. J. Org. Chem 2019, 84, 13186–13193. [DOI] [PubMed] [Google Scholar]
- (33).Li B; Lu L; Zhao M; Lei Z; Zhang F An Efficient 1064 nm NIR-II Excitation Fluorescent Molecular Dye for Deep-Tissue High-Resolution Dynamic Bioimaging. Angew. Chem., Int. Ed 2018, 57, 7483–7487. [DOI] [PubMed] [Google Scholar]
- (34).Antaris AL; Chen H; Diao S; Ma Z; Zhang Z; Zhu S; Wang J; Lozano AX; Fan Q; Chew L; Zhu M; Cheng K; Hong X; Dai H; Cheng Z A High Quantum Yield Molecule-Protein Complex Fluorophore for Near-Infrared II Imaging. Nat. Commun 2017, 8, No. 15269. [DOI] [PMC free article] [PubMed] [Google Scholar]
- (35).Rotermund F; Weigand R; Penzkofer A J-Aggregation and Disaggregation of Indocyanine Green in Water. Chem. Phys 1997, 220, 385–392. [Google Scholar]
- (36).Reindl S; Penzkofer A; Gong S-H; Landthaler M; Szeimies RM; Abels C; Bäumler W Quantum Yield of Triplet Formation for Indocyanine Green. J. Photochem. Photobiol., A 1997, 105, 65–68. [Google Scholar]
- (37).Zhang Y; Autry SA; McNamara LE; Nguyen ST; Le N; Brogdon P; Watkins DL; Hammer NI; Delcamp JH Near-Infrared Fluorescent Thienothiadiazole Dyes with Large Stokes Shifts and High Photostability. J. Org. Chem 2017, 82, 5597–5606. [DOI] [PubMed] [Google Scholar]
- (38).Rüttger F; Mindt S; Golz C; Alcarazo M; John M Isomerization and Dimerization of Indocyanine Green and a Related Heptamethine Dye. Eur. J. Org. Chem 2019, 2019, 4791–4796. [Google Scholar]
Associated Data
This section collects any data citations, data availability statements, or supplementary materials included in this article.