

Abstract
This article presents a collection of electroencephalographic (EEG) data recorded from 14 participants, that includes 7 participants with Intellectual and Developmental Disorder (IDD) and 7 Typically Developing Controls (TDC) under resting-state and under music stimuli. The EEG data were acquired using the EMOTIV EPOC+ device that is a 14-channel dry electrode device. The article provides two types of data: (1) Raw EEG data under resting-state and with music stimuli (i.e., task based data) and (2) pre-processed EEG data under resting state and with music stimuli. Alongside this data, we provide a robust and fully automated pre-processing pipeline for EEG data. The pipeline performs filtering, line noise removal, data selection, ICA, and automatic artefact removal.
Keywords: EEG, Neurodevelopment disorder, Auditory stimulus, Music apprehension, Emotiv
Specifications table
| Subject | Biomedical signal processing, Neuroscience |
| Specific subject area | Signal processing, Cognitive Neuroscience, Cognitive Psychology, Auditory perception, Multichannel EEG acquisition |
| Type of data | Electroencephalography data |
| How data were acquired | High-resolution multichannel EEG data were acquired using portable dry-electrode equipment from EMOTIV, model EPOC+. The device has 16 channels (14 data channels and two reference channels). |
| Technical specifications: | |
| Sampling frequency: 128 Hz | |
| Resolution: 14 bits per channel | |
| Dynamic range: ± 4.17 mV | |
| Response frequency: 0.16–43 Hz | |
| Data format | Raw (.set and .fdt files) and pre-processed (.mat) EEG data |
| Parameters for data collection | EEG was recorded during the experimental tests. The participants were seated in a comfortable chair with eyes closed in a noise-isolated room. The music stimuli was provided using earphones plugged to a laptop. For IDD participants, a special educator (professional) was present for explaining the task and calming down the subjects if they felt uncomfortable or got irritated by the headset or environment. |
| Description of data collection | Fourteen participants (seven IDD and seven TDC) performed the auditory perception experiment. The experiment had two stages. First, the participants were asked to stay in a resting state for two minutes. Second, following the resting state, a music stimulus was provided through plugged-in earphones for two minutes. |
| Data source location | Nai Disha School, Tamana NGO, New Delhi, India |
| Data accessibility | Data is hosted on a public repository |
| Repository name: Mendeley Data | |
| Data identification number: http://dx.doi.org/10.17632/fshy54ypyh.1 | |
| Direct URL to data: https://data.mendeley.com/datasets/fshy54ypyh/1 | |
| Related research article | Authors: Ekansh Sareen, Anubha Gupta, Rohit Verma, G. Krishnaveni Achary, Blessin Varkey |
| Title: Studying functional brain networks from dry electrode EEG set during music and resting states in neurodevelopment disorder | |
| Published at: bioRxiv | |
| DOI: https://doi.org/10.1101/759738 |
Value of the data
-
•
Currently, to the best of our knowledge, this is the only available EEG dataset of IDD participants observing music stimuli. The IDD population usually gets uncomfortable with dense electrodes and wired EEG acquisition system. This impacts the quality of collected data adversely. This predisposed the idea of using a wireless, portable, lesser-electrode EEG acquisition system such as EMOTIV's EPOC [1]. The toy-like built of the device, along with the mentioned features, made it better acceptable to the IDD participants, thus, providing credence to the quality of data.
-
•
The dataset contains high-quality EEG data of IDD participants along with typically developing control group. This can help in exploring and differentiating the cortical brain dynamics of the two groups in response to music stimuli.
-
•
The data will be beneficial to understand the differences in functional brain connectivity in IDD and TDC population. The data will also help to extract task-specific functional connectivity of participants. Furthermore, it will help in understanding the cognitive deficits and social impairments that are generally observed in the IDD population.
-
•
Researchers and clinical experts working in this domain can make use of the data to understand task-specific functional brain connectivity along with cognitive processing strategies in TDC and IDD population.
-
•
With this data and more data from other environmental stimulations to this population, programs can be developed to foster early life intervention strategies to boost cognitive rehabilitation of the IDD population. It can also help in the identification of clinical biomarkers in the IDD population.
-
•
The data is provided in multiple standardized formats for ease of access and use for various purposes.
1. Data
EEG signals were recorded for fourteen participants (seven TDC and seven IDD) during the experimental tests using the Emotiv Epoc+ data acquisition system. This is a dry-electrode, wireless, portable device. The device has 16 electrodes (14 data channels and two reference channels), which are positioned according to the international 10–20 system. The channel configuration of the device includes AF3, F7, F3, FC5, T7, P7, O1, O2, P8, T8, FC6, F4, F8, and AF4 are depicted in Fig. 1.
Fig. 1.

EMOTIV's Electrode placement (Emotive electrodes are highlighted in green color over the 10–20 electrode system). (For interpretation of the references to color in this figure legend, the reader is referred to the web version of this article.)
The raw and pre-processed data includes 14-channel EEG data for two minutes of resting-state followed by two minutes of music state, recorded at 128 Hz sampling rate. Tables 1 and 2 present participants’ ID, age, gender, and file name for IDD and TDC groups, respectively. The additional behavioural information such as IQ, SQ, music apprehension and facial expressions (emotion) for IDD participants is provided in the file “QualitativeData.xlsx”. The entire dataset is hosted on Mendeley data (DOI) and is presented as follows:
-
1.
The raw EEG data is provided in EEGLAB [2] .fdt and .set file format where .fdt file contains the raw data and .set file contains the metadata information (number of channels, sampling frequency, etc.). The raw data from the acquisition device has been modified to provide only the relevant 14-channel EEG recording and has been segmented into ‘Rest’ and ‘Music’ state for easy analysis.
The raw TDC data is arranged as: Data/RawData/RawData_TDC/Music and Rest
The raw IDD data is arranged as: Data/RawData/RawData_IDD/Music and Rest
The data can be loaded into EEGLAB by going to the 'File' menu and selecting the option of ‘Load existing dataset.'
The raw EEG data can also be loaded in EEGLAB using the following command:
≫ EEG = pop_loadset(‘filename’, ‘filename.set’, ‘filepath’, ‘Directory path’);
To export the raw data in .mat format, the following command can be used:
≫ EEG_data=ALLEEG.data;
-
2.
The pre-processed and filtered EEG data is provided in MATLAB's ‘.mat’ file format for easier post-processing and analysis. The raw EEG data can be processed by using the automated pre-processing pipeline, as proposed and explained later in this paper.
The clean TDC data is arranged as: Data/CleanData/CleanData_TDC/Music and Rest
The clean IDD data is arranged as: Data/CleanData/CleanData_IDD/Music and Rest
The pre-processed and filtered data (in .mat) can be loaded in EEGLAB using:
File-> Import data -> Using EEGLAB functions and plugins -> From ASCII/float file or Matlab array. Select the mat file from 'Browse,' enter the sampling rate (in Hz), and click 'Ok'.
Alternatively, data (ex- CGS01_Music_CD.mat) can also be loaded using command line as:
≫ EEG = pop_importdata(‘dataformat’, ‘matlab’, ‘nbchan’, 0, ‘data’, CGS01_Music_CD.mat ‘srate’, 128);
For data visualization, use 'Channel data (scroll)' from the 'Plot' menu. Alternatively, it can be done through the command line using:
≫ pop_eegplot(EEG, 1, 1, 1);
Table 1.
IDD Participants' data.
| Participant ID | Age (in years) | Gender | Condition | Raw file/Clean file (.set and .fdt) |
|---|---|---|---|---|
| NDS001 | 28 | Male | Rest | NDS001_Rest/ NDS001_Rest_CD |
| Music | NDS001_Music/ NDS001_Music_CD | |||
| NDS002 | 26 | Male | Rest | NDS002_Rest/ NDS002_Rest_CD |
| Music | NDS002_Music/ NDS002_Music_CD | |||
| NDS003 | 26 | Male | Rest | NDS003_Rest/ NDS003_Rest_CD |
| Music | NDS003_Music/ NDS003_Music_CD | |||
| NDS004 | 28 | Male | Rest | NDS004_Rest/ NDS004_Rest_CD |
| Music | NDS004_Music/ NDS004_Music_CD | |||
| NDS005 | 31 | Male | Rest | NDS005_Rest/ NDS005_Rest_CD |
| Music | NDS005_Music/ NDS005_Music_CD | |||
| NDS006 | 31 | Male | Rest | NDS006_Rest/ NDS006_Rest_CD |
| Music | NDS006_Music/ NDS006_Music_CD | |||
| NDS007 | 28 | Male | Rest | NDS007_Rest/ NDS007_Rest_CD |
| Music | NDS007_Music/ NDS007_Music_CD |
Table 2.
TDC Participants' data.
| Participant ID | Age (in years) | Gender | Condition | Raw file/Clean file (.set and .fdt) |
|---|---|---|---|---|
| CGS01 | 20 | Male | Rest | CGS01_Rest/ CGS01_Rest_CD |
| Music | CGS01_Music/ CGS01_Music_CD | |||
| CGS02 | 21 | Male | Rest | CGS02_Rest/ CGS02_Rest_CD |
| Music | CGS02_Music/ CGS02_Music_CD | |||
| CGS03 | 20 | Male | Rest | CGS03_Rest/ CGS03_Rest_CD |
| Music | CGS03_Music/ CGS03_Music_CD | |||
| CGS04 | 23 | Male | Rest | CGS04_Rest/ CGS04_Rest_CD |
| Music | CGS04_Music/ CGS04_Music_CD | |||
| CGS05 | 24 | Male | Rest | CGS05_Rest/ CGS05_Rest_CD |
| Music | CGS05_Music/ CGS05_Music_CD | |||
| CGS06 | 20 | Male | Rest | CGS06_Rest/ CGS06_Rest_CD |
| Music | CGS06_Music/ CGS06_Music_CD | |||
| CGS07 | 21 | Male | Rest | CGS07_Rest/ CGS07_Rest_CD |
| Music | CGS07_Music/ CGS07_Music_CD |
2. Experimental design, materials, and methods
2.1. Statement of ethics
The voluntary, fully informed consent of the participants involved in this data collection was obtained on a written document. In the case of IDD participants, the consent was co-signed by parents and the special educators/caregivers who worked with the IDD participants at the data collection location, i.e., Nai Disha School, Tamana NGO, New Delhi, India. The document, used to obtain the informed consent, was approved by the Institutional Review Board (IRB) of Indraprastha Institute of Information Technology-Delhi (IIIT-D) and followed the ethical standards laid down in the 1964 Declaration of Helsinki. The data collection and associated protocols were reviewed and approved by IIITD's IRB. The anonymized data contains no personally identifiable information.
2.2. Participants
The EEG signals were recorded for 14 participants (7 IDD and 7 TDC). The age of IDD participants (all males) ranged from 26 to 31 years (age = 28.28 ± 2.05) with Intelligence Quotient (IQ) from 52 to 68 (mean IQ: 59.143 ± 5.33) and Social Quotient (SQ) from 57 to 62 (mean SQ: 60 ± 2.08). The age of TDC participants (all males) ranged from 20 to 24 years (age = 21.28 ± 1.60). For the evaluation of IQ of IDD population, Malin's Intelligence Scale for Indian Children (MISIC), which is an Indian adaptation of Wechsler's Intelligence Scale for Children (WISC), was used. For SQ evaluation of IDD population, the Vineland Social Maturity Scale was used.
2.3. Risks and inconveniences
There were risks associated with data collection. The equipment used for data acquisition consists of sixteen external electrodes positioned explicitly over the scalp. The non-invasive nature of the device prevents possible electrical risks. However, participants could experience minimal discomfort due to prolonged wearing of the headset. To handle this discomfort, small breaks were provided in between as and when any participant asked for it. For IDD participants, special care was exercised. They were familiarized with the acquisition device by their special educators so that they felt comfortable with this new object, generally a challenge with this population. This reduced discomfort in these participants on the use of this headset. Instead, once they felt familiarized, they took it as the playful object and hence, made data collection an easier task. These special educators were present during the data acquisition to provide the IDD participants with a familiar and friendly environment. They also kept a check on their discomfort level and offered assistance, whenever needed.
2.4. Material and equipment
EEG data acquisition was done using a portable and commercially available EEG acquisition system called EMOTIV EPOC+. This device records high-quality multichannel EEG data with 16 electrodes (14 data channels and two reference channels). The sampling rate of the device is set at 128 Hz with a dynamic range of ± 4.17 mV. The frequency response extends between 0.16 and 43 Hz with 14 bits per channel resolution. The EEG acquisition system is a dry electrode system that uses saline hydration-based sensors (felt pads). For data acquisition, the device is connected to a laptop using a 2.4 Ghz USB 3.0 receiver and low energy Bluetooth wireless connectivity. The equipment runs with a proprietary software EMOTIV PRO. The auditory stimulus is provided through standard earphones.
2.5. Experiment
The experiment had two stages. First, the participants were asked to stay in the resting-state for two minutes. Second, following the resting-state, music stimuli was provided through plugged-in earphones for the next two minutes. The music stimuli was a two minute clipping of a soothing piano tune. Throughout the experiment, participants were asked to keep their eyes closed to avoid any visual distractions. The experiment layout is depicted in Fig. 2. The EEG data was recorded for this entire duration and later, was divided into rest and music state data. Participants were asked to stay calm and avoid stressful thinking during the whole experiment. IDD participants were assisted by their special educators in understanding the task and provide assistance, whenever needed.
Fig. 2.

Experiment layout.
2.6. Experiment protocol
The following protocol was followed during the experiment:
-
1.
The entire experiment design was explained to all participants in a clear and precise manner. They were informed about the guidelines to be followed during the experiment, say, avoiding sudden movements, stressful thinking, and talking. Participants were given sufficient time to understand and ask questions about the task and the guidelines. If at any point in the experiment, any participant felt uneasy or was not up for the experiment, he/she could decide not to continue with the experiment, and the session was concluded. For IDD participants, special educators explained to them the task considering their pace of understanding and comfort level.
-
2.
Participants were asked to sign the consent form before the start of the experiment. For IDD participants, consent was provided jointly by parents and appointed special educator at the data collection center.
-
3.
Before the start of the experiment, all materials and equipment were organized and prepared to be used. The recording device was ensured to be in a good working condition, and the felt-pads of the device were adequately soaked in saline solution to ensure good connectivity. Participants were asked to make themselves comfortable in the sitting position and with the surroundings.
-
4.
The data acquisition system was placed over participant's head following the 10–20 standard positioning, and the device connection was checked for 100% connectivity. Each electrode was manually inspected for proper contact with the scalp before the start of the experiment.
-
5.
Once the participant was comfortable with the experimental setup and the guidelines, the experiment started. Once the audio clip terminated, the recording session was concluded and the device was removed from the participant's head.
2.7. Data pre-processing
The raw EEG data was filtered and pre-processed using an in-house fully automated pipeline. The steps of the pipeline are as follows:
-
1.
Loading the dataset: The raw EEG dataset was loaded in EEGLAB.
-
2.
Filtering: The 14-channel data was filtered by using a bandpass filter with a lower cut-off at 1 Hz and a higher cut-off at 30 Hz. Filtering helped in minimizing artefacts at epoch boundaries. Line noise of 50/60 Hz was removed by using the CleanLine plugin [3].
-
3.
Channel location: The customized channel location file, which contains the spherical coordinates of the electrodes (must-have information for independent component decomposition) in the recording device as mapped on the 10–20 system, was created specifically for the device used (EMOTIV EPOC) and loaded.
-
4.
Independent Component Analysis (ICA): To decompose the data into its independent components for the identification and removal of artefacts, Independent components Analysis (ICA) was implemented. The ICA decomposition was done using a logistic infomax algorithm with the natural gradient feature. This method was implemented in EEGLAB using ‘runica’ function.
-
5.Automatic artefact detection using ADJUST plugin: The artefacts are automatically identified by using the ADJUST plugin [4]. ADJUST automatically computes a set of spatial and temporal features for each independent component (IC). Each class of artefact corresponds to a temporal and spatial feature as follows:
-
5.1.Eye Blinks: Spatial Average Difference (SAD) and Temporal Kurtosis (TK)
-
5.2.Vertical eye movements: SAD and Maximum Epoch Variance (MEV)
-
5.3.Horizontal eye movement: Spatial Eye Difference (SED) and MEV
-
5.4.Generic discontinuities: Generic Discontinuities Spatial Feature (GDSF) and MEV
-
5.1.
ADJUST computes these five spatial and temporal features for all the ICs. The ICs which cross the pre-determined threshold for both spatial and temporal features corresponding to a class of artefact were classified as that class of artefact.
Note: ADJUST can result in classification of most of the stable ICs into artefacts simply based on threshold crossing but rejecting all of them could lead to loss of useful data. Thus, while using lesser channel data (for example- 14-channel data), proper caution was advised. Therefore, only the worst two components of all the ADJUST-classified components are considered for rejection. This ensures artefact removal while retaining useful information of the data.
-
6.
Automatic artefact rejection: Among the identified artefacts, two of the worst IC's were selected based on their cumulative threshold exceedance for five features.
-
7.
Component rejection: The identified components were removed and the filtered artefact-free EEG data was reconstructed.
The entire pre-processing framework, depicted in Fig. 3, has been converted into a fully automated pre-processing pipeline (Pre-processing pipeline/eegppf.m) and can be deployed easily for batch processing. Required toolboxes, plugins and functions for the pipeline execution were combined together and were available under Pre-processing pipeline/Helper_func. Proper description and usage instructions were provided as comments within the main pipeline code.
Fig. 3.
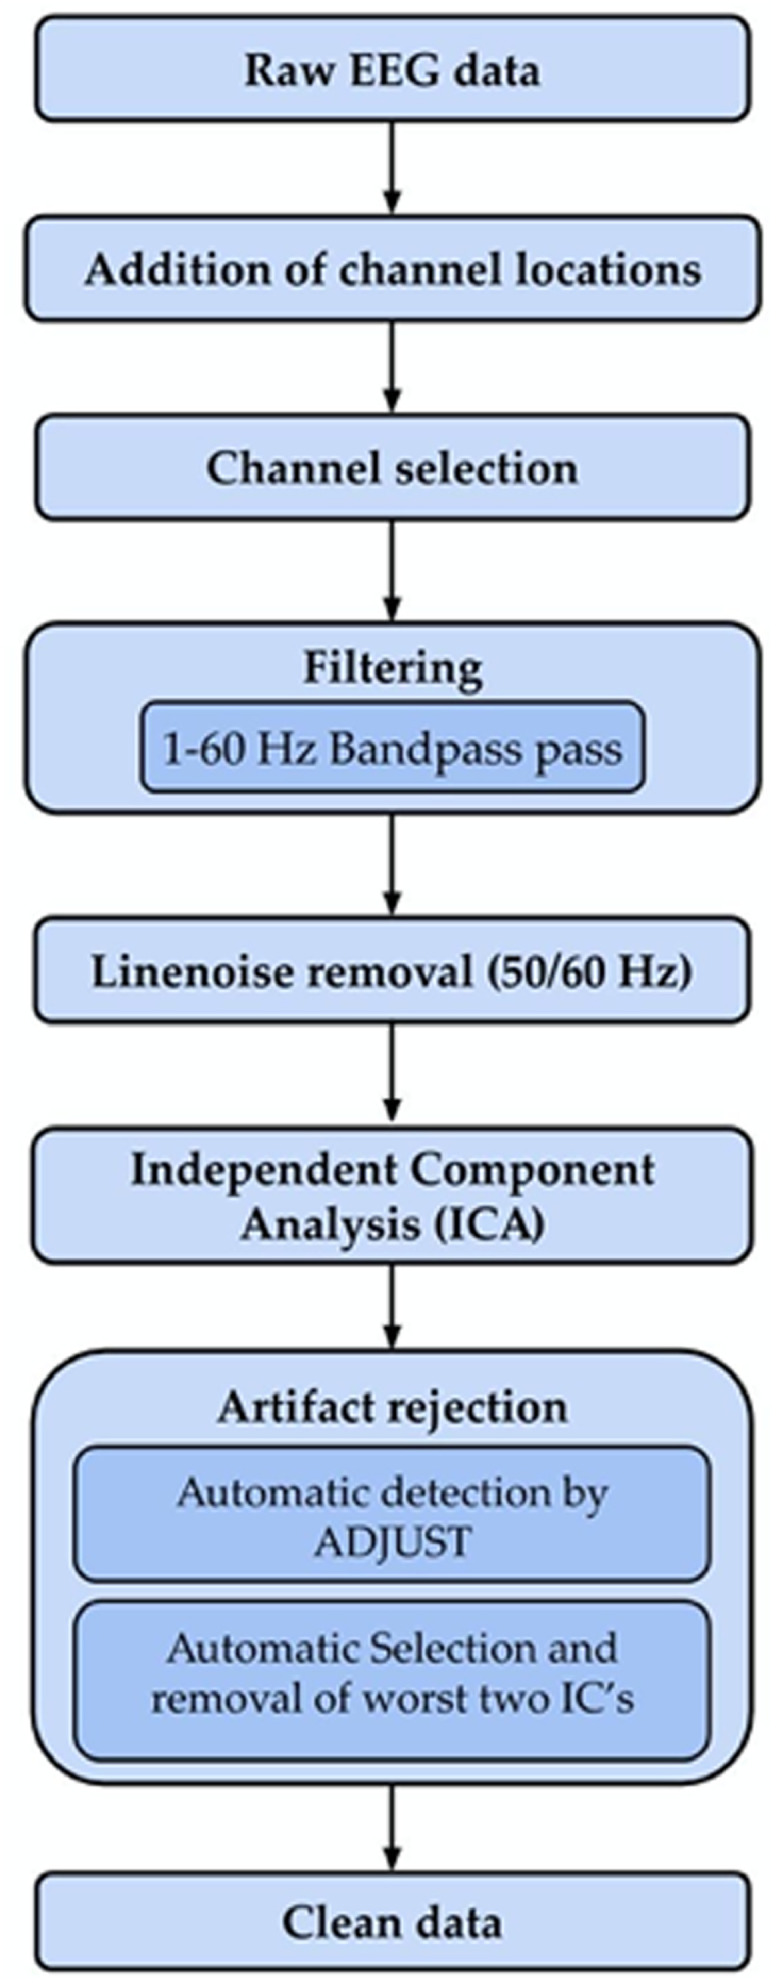
Pre-processing pipeline (Adapted from [5]).
Some salient features of the proposed pipeline are as follows:
-
1.
The pipeline is robust and can be used for multiple raw EEG data formats like .edf, .mat, and .set.
-
2.
Channels of interest can be selected using the input argument ‘electrode_select’.
-
3.
Bandpass filtering can be done by providing the input arguments ‘lpf’ and ‘hpf’.
-
4.
Line noise of 50/60 Hz can be removed by providing the input argument ‘linenoise’.
-
5.
Channel location file can be loaded using the input argument ‘chan_loc’.
-
6.
The number of components to be removed from all the identified artefactual components can also be controlled through input argument ‘rem_num’.
CRediT authorship contribution statement
Ekansh Sareen: Conceptualization, Methodology, Software, Validation, Investigation, Data curation, Writing - original draft, Visualization. Lakshya Singh: Software, Validation, Data curation. Blessin Varkey: Conceptualization, Resources, Supervision. Krishnaveni Achary: Conceptualization, Resources, Supervision. Anubha Gupta: Conceptualization, Methodology, Resources, Supervision, Project administration.
Declaration of Competing Interest
The authors declare that they have no known competing financial interests or personal relationships which have, or could be perceived to have, influenced the work reported in this article.
Acknowledgments
The authors would like to thank Aakash Deep from Indraprastha Institute of Information Technology Delhi (IIIT-D) for his support in data collection. The authors would also like to thank Infosys Centre for AI, IIIT-D and TCS Centre for Design and New Media, IIIT-D for their support in the accomplishment of the present work.
References
- 1.Emotiv EPOC headset, http://www.emotiv.com/, (Accessed 20 January 2020).
- 2.Delorme A., Makeig S. EEGLAB: an open source toolbox for analysis of single-trial EEG dynamics including independent component analysis. J. Neurosci. Methods. 2004;134(1):9–21. doi: 10.1016/j.jneumeth.2003.10.009. [DOI] [PubMed] [Google Scholar]
- 3.Mullen T. 2012. NITRC: CleanLine: Tool/Resource Info.http://www.nitrc.org/projects/cleanline Available online at: (Accessed 20 January 2020) [Google Scholar]
- 4.Mognon A., Jovicich J., Bruzzone L., Buiatti M. ADJUST: an automatic EEG artifact detector based on the joint use of spatial and temporal features. Psychophysiology. 2011;48(2):229–240. doi: 10.1111/j.1469-8986.2010.01061.x. [DOI] [PubMed] [Google Scholar]
- 5.Sareen, E., Gupta, A., Verma, R., Achary, G.K., Varkey, B. (2019), Studying functional brain networks from dry electrode EEG set during music and resting states in neurodevelopment disorder, bioRxiv 759738 [Preprint]. Available from:https://www.biorxiv.org/content/10.1101/759738v1.