

Abstract
Aims
To externally validate an earlier characterized relationship between bedaquiline exposure and decline in bacterial load in a more difficult‐to‐treat patient population, and to explore the performances of alternative dosing regimens through simulations.
Methods
The bedaquiline exposure–response relationship was validated using time‐to‐positivity data from 233 newly diagnosed or treatment‐experienced patients with drug‐resistant tuberculosis from the C209 open‐label study. The significance of the exposure–response relationship on the bacterial clearance was compared to a constant drug effect model. Tuberculosis resistance type and the presence and duration of antituberculosis pre‐treatment were evaluated as additional covariates. Alternative dosing regimens were simulated for tuberculosis patients with different types of drug resistance.
Results
High bedaquiline concentrations were confirmed to be associated with faster bacterial load decline in patients, given that the exposure–effect relationship provided a significantly better fit than the constant drug effect (relative likelihood = 0.0003). The half‐life of bacterial clearance was identified to be 22% longer in patients with pre‐extensively drug‐resistant (pre‐XDR) tuberculosis (TB) and 86% longer in patients with extensively drug‐resistant (XDR) TB, compared to patients with multidrug‐resistant (MDR) TB. Achievement of the same treatment response for (pre‐)XDR TB patients as for MDR TB patients would be possible by adjusting the dose and dosing frequency. Furthermore, daily bedaquiline administration as in the ZeNix regimen, was predicted to be as effective as the approved regimen.
Conclusion
The confirmed bedaquiline exposure–response relationship offers the possibility to predict efficacy under alternative dosing regimens, and provides a useful tool for potential treatment optimization.
Keywords: bedaquiline, modelling, multidrug‐resistance, nonlinear mixed‐effect, sputum culture conversion, time‐to‐positivity, tuberculosis

What is already known about this subject
Higher bedaquiline concentrations have been associated with faster decline in bacterial load in patients with drug‐resistant tuberculosis, and it has been suggested that the maximal effect is not achieved under the approved regimen.
Novel dosing regimens for bedaquiline are currently under consideration.
Pharmacometric models can support clinical trial design as well as the processes of treatment refinement.
What this study adds
The relationship between bedaquiline exposures and decline in bacterial load was confirmed using sparse and heterogeneous data.
Different treatment responses were identified for pre‐treated patients as well as for patients with different degrees of drug resistance.
A regimen with daily administration of bedaquiline was predicted to be as effective as the less practical approved regimen.
1. INTRODUCTION
After decades of limited treatment options for patients with drug‐resistant tuberculosis (TB), bedaquiline (BDQ) entered the market in 2012, providing hope for improved treatment outcomes, better therapy tolerance and shortened treatment duration. BDQ was approved on the basis of 2 Phase IIb studies involving 440 patients (randomized placebo‐controlled trial C208 [http://ClinicalTrials.gov; number NCT00449644] and open‐label trial C209 [http://ClinicalTrials.gov; number NCT00910871]). The drug showed the ability to shorten the time to sputum culture conversion (TSCC) as well as to increase the cure rate at 24 and 120 weeks compared to placebo.1, 2 Since 2013, BDQ has been recommended for the treatment of multidrug‐resistant (MDR) TB by the World Health Organization and is currently being implemented at the programme level.3 Emerging results from the use of BDQ around the world show that sputum culture conversion rates are improved when BDQ is added to a background regimen.4, 5, 6, 7
To evaluate the relationship between drug exposure and treatment responses (e.g. decrease in bacterial load), quantitative measurements such as time to positivity in liquid media perform better than methods implementing secondary derived metrics, e.g. sputum culture conversion (SCC).1, 8 In this work, we have re‐evaluated an earlier presented quantitative model, called the reference model [8]. This model is able to describe a relationship between BDQ exposure (average concentration of BDQ [mg/L] per week) and the decline of bacterial load in patients, where the original analysis of the same data could not identify any exposure–response relationship by using TSCC.1 The model suggests that under the approved regimen, BDQ levels are not achieving the maximal possible effect and that higher exposures early in the treatment process may lead to faster clearing of the infection. The current dosing of BDQ includes a loading phase of 2 weeks with 400 mg daily (qd) administration and thereafter a continuation phase with 200 mg 3 times weekly. More simplistic dosing schedules are being considered,9 and this work illustrates that pharmacometric models can be a tool for evaluation of such alternative regimens.
The objective of this work was to assess the previously defined exposure–response relationship using data from a separate clinical trial, to further explore patient profiles' heterogeneity as new covariates, and to demonstrate the usefulness of dose–exposure–response models as tools for dose refinement by performing simulations.
2. METHODS
2.1. Clinical data and study design
This analysis used anonymized data obtained from the C209 phase IIb clinical trial (TMC207‐C209, http://ClinicalTrials.gov number NCT00910871) sponsored by Janssen Pharmaceuticals, and shared through the European PreDiCT‐TB consortium (http://www.predict-tb.eu/). Results and outcomes from the study have already been published.2 The trial was conducted in accordance with Good Clinical Practice standards and received ethical approval from appropriate local authorities. C209 was a single‐arm open‐label study enrolling 233 newly diagnosed or treatment‐experienced patients (i.e. previously treated for tuberculosis within 1 month before start of BDQ) with drug‐resistant TB. The trial involved patients with different degrees of drug resistance: MDR (i.e. resistant to rifampicin and isoniazid), pre‐extensively drug‐resistant (pre‐XDR, i.e. MDR + additional resistance to injectable second‐line drugs or fluoroquinolones) and extensively drug‐resistant (XDR, i.e. MDR + additional resistance to injectable second‐line drugs and fluoroquinolones) TB.10 The patients received 24 weeks of BDQ on top of an individualized background regimen, selected by the investigator at baseline, according to national and international treatment guidelines.
Triplicate spot sputum samples were collected on the day prior to start of treatment, at week 2, and then every fourth week from week 4 until week 24. Samples were cultured in mycobacterial growth indicator tubes (MGIT) recording the time to positivity (TTP). Time to positivity is defined as the time from inoculation to the time when a signal can be detected, i.e. when bacteria have consumed enough oxygen within the tube to reach the critical threshold where the fluorescence probe is no longer quenched. The longer the time is, the lower the bacterial load in the inoculum. Cultures without any signal after 42 days (or 1008 hours) are considered negative, i.e. no mycobacterial growth is reported.
2.2. The reference model [8]
The structure of the previously developed model includes 3 linked components:
A longitudinal representation of bacterial load in the patient (Bpatient), described by a mono‐exponential decline function
The probability of bacterial presence in sputum derived from the bacterial load in the patient
A time‐to‐event model where the inoculum and bacterial growth in the MGIT are linked to TTP
A schematic overview of the model is illustrated in Figure 1 and further description of the model can be found in Appendix A.1. An example of the model code and dataset used is available in Appendices A.2 and A.3.
Figure 1.

Schematic representation of the reference model. Adapted from Svensson and Karlsson.8 Bpatient, bacterial load in patient; Bsputum, bacterial load in MGIT; MGIT, mycobacteria growth indicator tube; TAST, time after start of treatment; t, time in MGIT after inoculation
The C208 study1 (data used for the reference model development) mainly differed from the C209 study by 2 aspects: the targeted population and the study design. The C208 study enrolled only newly diagnosed patients, receiving BDQ or placebo on top of an optimized background regimen of 5 drugs (kanamycin, ofloxacin, ethionamide, pyrazinamide and terizidone). In C208, sputum samples were drawn every week until week 8 and thereafter every second week.
2.3. Modelling strategy
2.3.1. Exposure–response relationship evaluation
The exposure–response model was compared to a constant drug effect model (receiving or not BDQ on top of the background regimen). The exposure–response effect consisted of an Emax‐type function affecting the half‐life of the decline of the mycobacterial load in patients (HLBpatient), where the maximum effect has been fixed to 100% inhibition and the exposure dependence linked to the weekly average concentration of BDQ. The constant drug effect model included the same effect on HLBpatient for all patients receiving BDQ, regardless of their individual BDQ concentration. This effect was set to 0 before start of BDQ treatment (between the screening visit and the first BDQ dose), mimicking a step function. The 2 models were applied to C209 data by using fixed population parameters values obtained from the C208 study. Individual BDQ weekly average concentrations were derived using a previously developed pharmacokinetic model11 based on 3 measurements (at weeks 2, 12 and 24) of BDQ concentrations in plasma. The performance of the models' ability to describe the C209 data were compared using the models' relative likelihood (Equation 1). The relative likelihood can be interpreted as the probability of model i to describe the data as well the data as a model with the minimum log‐likelihood value (min).
| (1) |
where OFV stands for objective function value.
2.3.2. Model refinement and covariate analysis
Following the comparison between the 2 models established from study C208, the exposure–response model was updated using information from both studies. Data from C209 were analysed using prior knowledge. The final parameter estimates from the C208 analysis provided information about the probability distributions of the parameters and served as a starting point to help stabilizing the estimation process.12 Using the NONMEM NWPRI PRIOR subroutine, the variance–covariance matrix and derived degrees of freedom from C208, were implemented as priors. The use of priors in the estimation process imposes a penalty on the objective function value (OFV) which is derived from a normal–inverse Wishart distribution.
Kaplan–Meier visual predictive checks (VPCs) of TTP stratified on week after start of treatment and VPCs of the probability of a positive MGIT readout over time after start of treatment were used to evaluate the models. Posterior predictive checks of time to sputum culture conversion (based on observed and model simulated datasets (n = 100)) were also performed. Sputum culture conversion was defined as the first of 2 visits with no positive cultures obtained at least 25 days apart. Estimates of parameter precision were obtained from a sampling–importance–resampling procedure.13, 14
The impact of additional covariates (in addition to those already implemented in the C208 model) on mycobacterial load in patients was explored. Based on design and patient‐related characteristics, the following covariates were considered: the type of drug resistance (TBtype) in 3 distinct groups (MDR, pre‐XDR, XDR) and the presence (p_preT) and duration (d_preT; in case pre‐treatment was present) of TB pre‐treatment before start of study. A mixture model served to assign a patient with missing covariate data to the most probable subpopulation, given the overall population and the patient's recorded information.15 Additionally, when covariate information was missing, methods such as omission of the patient's records with missing value and median/mode imputation were evaluated in a sensitivity analysis. Model discrimination for inclusion of covariates was based on differences in OFV with a 5% statistically significant level (3.84 points for 1 degree of freedom).
2.3.3. Evaluation of alternative dosing regimens
The treatment response was quantified by 3 specific metrics: the median TSCC and the proportion of patients without SCC at week 8 and at week 20, respectively. The following research questions were explored:
What dose regimen would treatment‐naïve patients with pre‐XDR and XDR TB need to achieve the same MGIT response as patients with MDR TB (i.e. median TSCC of 7 weeks)?
What MGIT response does the model predict for the alternative dosing regimen used in the ZeNix trial?
The ZeNix clinical trial (http://ClinicalTrials.gov number NCT03086486) evaluates the safety and efficacy of linezolid, BDQ and pretomanid as combination therapy in patients with drug‐resistant TB. BDQ is administered for 8 weeks at the dose of 200 mg once daily and thereafter 100 mg once daily until week 26. The expected results from ZeNix were compared to the approved BDQ dosing regimen, assuming similar effectiveness of the ZeNix background regimen as the C208/C209 background regimen.
The BDQ weekly average concentrations were derived with a published pharmacokinetic model11 and were used as input in the updated exposure–response model to perform the simulations for treatment‐naïve patients with MDR, pre‐XDR and XDR TB.
2.4. Software
Data analysis was performed with the nonlinear mixed effects modelling software NONMEM version 7.3,16 using the second‐order conditional LAPLACE estimation method. All modelling procedures were executed using PsN,17, 18, 19 version 4.7.9. Data management was performed with the R software (http://cran.r-project.org/) version 3.4.2, and diagnostics plots generated with the package Xpose version 4.5.3.19, 20 Model and run management was performed using Pirana, version 2.9.6.19, 21
3. RESULTS
3.1. Clinical data
The analysis included 206 patients out of 233 from the C209 trial (reasons for exclusion are described in Appendix A.4.). In total, 3628 observations of TTP measurements were recorded, among them 1077 were positive. Patient characteristics used as covariates are presented in Table 1 and compared to the values in the reference model. Further description of patients' demographics stratified by type of drug resistance can be found in Appendix A.5.
Table 1.
Summary of C209 patients characteristics used as covariates in the model, compared to C208 patient characteristics reported in the reference publication 8
| Variable | C209 (n=233 patients) | C208 (n=206 patients) |
|---|---|---|
| Mean TTP at baseline* [days] | ||
| Median | 14.4 | 6.8 |
| Range | 3.3‐42 | 2.3‐42 |
| BDQ weekly average concentration at week 2** [mg/L]† | ||
| Median | 1.6 | NR |
| Range | 0.068‐4.4 | NR |
| TB drug resistance type [n(%)] | ||
| MDR | 93 (40%) | 96 (46%) |
| pre‐XDR | 44 (19%) | 53 (25%) |
| XDR | 38 (16%) | 11 (5%) |
| Drug sensitive | 3 (1%) | 8 (4%) |
| Missing | 55 (24%) | 39 (20%) |
| TB pre‐treatment ‐ presence [n(%)] | ||
| Yes | 211 (91%) | 0 (0%) |
| No | 22 (9%) | 206 (100%) |
| TB pre‐treatment ‐ duration*** [days] | ||
| Median | 54 | NA |
| Range | 4‐2638 | NA |
BDQ, bedaquiline; MDR, multidrug‐resistant; NA, not applicable; NR, not reported; TB, tuberculosis; TB pre‐treatment—presence, the number of patients who got TB treatment within 1 month before start of BDQ; TB pre‐treatment—duration, the length of the period of TB treatment before BDQ start; TTP, time‐to‐positivity; XDR, extensively drug‐resistant.
Mean of the triplicate samples, n =227 patients/C209; n =191 patients/C208.
n=217 patients/C209.
n=201 patients/C209.
Calculated from AUC0‐168h after dose 7 (400 mg)
3.2. Exposure–response relationship evaluation
The evaluation of the exposure–response effect model and the constant drug effect model on C209 data, resulted in a 16‐point difference in objective function value (−2Log likelihoodi –[−2Log likelihoodmin]) in favour of the exposure–response effect model. The quantification of the loss of information between the exposure–response model and constant drug effect model revealed that the constant drug effect model has a relative likelihood of 0.0003 in relation to the exposure–response model (e–16/2 = 0.0003). Another interpretation would be to say that the constant drug effect model is 0.0003 times as probable as the exposure–response model to minimize the information loss. This confirmed that the model including the exposure–response effect was appropriate to adopt.
3.3. Covariate analysis
The reference analysis (based on C208 data) established that patients with pre‐XDR or XDR TB are slower than patients with MDR TB to clear out the bacteria from the body (28.1% longer half‐life of the mycobacterial load).8 The larger proportion of patients with XDR TB in the C209 study (16% compared to 5% in the C208 study; Table 1) enabled to discriminate between the effects of pre‐XDR and XDR drug resistance on the half‐life of the decline in mycobacterial load (COVTBtype, Equation 2). Patients with pre‐XDR TB exhibited 21.6% longer half‐life whereas the patients with XDR TB had 85.6% longer half‐life, compared to patients with MDR TB. Patients with missing information about degree of TB resistance (24%) or with drug sensitive TB (1%) were assigned to the MDR group, as in the reference model. The model was insensitive to the different tested methods for handling of missing data (mixture model,22 omission or implementation as MDR). Additionally, the analysis also established that patients who received TB treatment within 1 month before start of BDQ had a 27.6% longer half‐life of mycobacterial load than treatment‐naïve patients (COVp_preT, Equation 2).
| (2) |
The VPCs of the final model (Figure 2) demonstrate a good predictive performance in terms of describing TTP data as binary (positive/negative) information (Figure 2A) and quantitative continuous (Figure 2B). The figure also presents the ability of the model to capture longer treatment times required for patients with pre‐XDR and XDR TB to achieve median time to SCC (9 and 14 weeks respectively, vs 7 weeks for patients with MDR TB; Figure 2C). The parameter estimates and their uncertainty displayed in Table 2 are consistent with the previous findings of the C208 analysis.
Figure 2.

Model evaluation by graphical analysis. Panel (A) describes the probability of having a positive sample vs time stratified by tuberculosis resistance group. The solid lines represent the proportion of positive samples and the shaded areas the 95% confidence intervals of the simulated data. Panel (B) represents the time to positivity in mycobacteria growth indicator tube (MGIT) per week on treatment. The solid lines represent the observed time to positivity and the shaded areas the 95% confidence intervals based on model simulations of time to positivity. Panel (C) displays the posterior predictive check of time to SCC. The solid lines represent the observed time to SCC and the shaded areas the 95% prediction intervals based on time to sputum culture conversion calculated from model simulations of time to positivity. The vertical dashes represent censoring events in the real data set. MDR, multidrug‐resistance; XDR, extensive drug‐resistance
Table 2.
Parameters estimates and uncertainty of the final model
| Submodel | Parameters [unit] | Value [95% CI] |
|---|---|---|
| Bacterial load in patients |
N0 Bpatient [number of bacteria/inoculum] HL Bpatient [weeks] IIV HL Bpatient (variance) BoxCox transformation IIV HL Bpatient EC50 BDQ effect on HL Bpatient [mg/L] Baseline TTP effect on N0 Bpatient pre‐XDR effect on HL Bpatient [%] XDR effect on HL Bpatient [%] p_preT effect on HL Bpatient [%] IOV sputum sampling Bpatient (variance) |
522 [391; 684] 0.90 [0.81; 0.97] 0.57 [0.46; 0.73] 0.57 [0.38; 0.83] 1.57 [1.26; 1.98] −3.65 [−3.95; ‐3.37] 21.6 [5.7; 39.9] 85.6 [38.3; 156.5] 27.6 [10.7; 51.0] 3.71 FIXa |
| Probability of bacterial presence |
Pmax bacterial presence Bpatient50 |
0.969 FIXa 0.5 FIXa |
| Growth in MGIT | Kgrowth [1/(day*bacteria)] | 3.37 × 10⁻⁶ |
| [3.06 × 10⁻⁶; 3.73 × 10⁻⁶] | ||
| Bsputummax [number of bacteria] | 1.68 × 10⁵ | |
| [1.47 × 10⁵; 1.89 × 10⁵] | ||
| Scaling of hazard | 2.63 × 10⁻⁶ | |
| [2.24 × 10⁻⁶; 3.15 × 10⁻⁶] |
BDQ, bedaquiline; Bpatient50, bacterial load in patient corresponding to 50% of Pmax; Kgrowth, growth rate in MGIT; Bsputummax, maximum bacteria carrying capacity in MGIT; CI, confidence interval; N0, bacterial load in patient at time 0; IIV, inter‐individual variability; HL, Half‐life of bacterial decline in patient; MGIT, mycobacterial growth indicator tube; Pmax, maximal probability; p_preT, presence of TB pre‐treatment.
Parameter fixed to the same value used in C208 analysis.
3.4. Evaluation of alternative dosing regimens
3.4.1. Simulated response for patients with (pre‐)XDR TB
Simulation of TSCC profiles suggested that increasing the dose and switching to a once‐daily dosing throughout the 24 weeks of treatment for both patients with pre‐XDR and XDR TB would be needed to achieve the same efficacy profile as patients with MDR TB (Table 3 and Figure A.6).
Table 3.
Standard and alternative dosing regimens simulations for treatment‐naïve MDR, pre‐XDR and XDR TB patients
| Standard dosing regimen | Alternative dosing regimen | ||||
|---|---|---|---|---|---|
| 400 mg qd 2 weeks, then 200 mg q3w | 500 mg qd 2 weeks, then 200 mg qd | 1000 mg qd 2 weeks, then 500 mg qd | |||
| MDR | pre‐XDR | XDR | pre‐XDR | XDR | |
| Median time to SCC (weeks) | 7 | 9 | 14 | 7 | 7 |
| % of patient without SCC at week 8 | 42 | 50 | 73 | 42 | 40 |
| % of patient without SCC at week 20 | 14 | 18 | 31 | 13 | 12 |
MDR, multidrug‐resistance; XDR, extensive drug‐resistance; SCC, sputum culture conversion; qd, once daily; q3w, 3 times a week
For patients with pre‐XDR TB to reach the same median TSCC and percentage of patients without SCC at week 8 and 20 as patients with MDR TB, an increase in daily BDQ doses by 25% for the loading phase and 133% for the maintenance phase would be required (i.e. 500 mg for 2 weeks, thereafter 200 mg qd). For patients with XDR TB the corresponding increases would need to be 150% and 483%, respectively (i.e. 1000 mg qd for 2 weeks, thereafter 500 mg qd).
3.4.2. Predicted performances of the ZeNix trial
For the ZeNix dosing regimen, similar treatment outcomes as the standard dosing regimen for BDQ were predicted (Figure 3).
Figure 3.
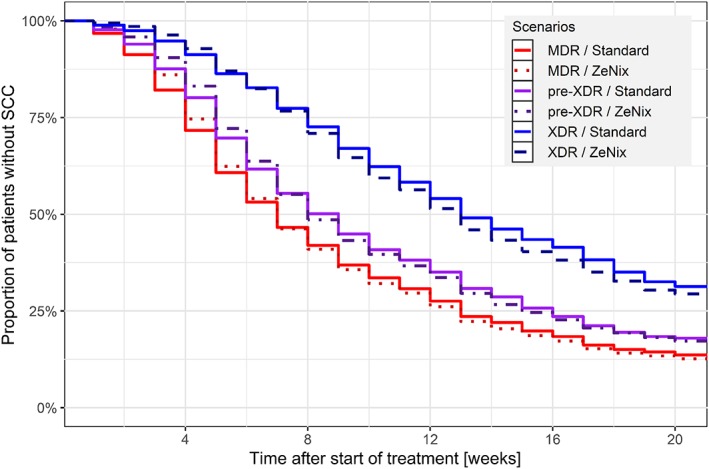
Kaplan–Meier plot of expected treatment response. Prediction of the Zenix trial performances, for multidrug‐resistance (MDR; red dotted line), pre‐extensive drug‐resistance (XDR; purple dot–dashed line) and XDR (blue dashed line) patients, compared with the standard dosing regimen of bedaquiline (respective colored full lines). ZeNix trial: 100 mg qd 8 weeks, followed by 200 mg qd 16 weeks. Standard dosing regimen: 400 mg qd 2 weeks, followed by 200 mg q3w 22 weeks
4. DISCUSSION
In this pharmacometric framework, we successfully externally validated a previously reported exposure–response relationship between BDQ weekly average concentrations and mycobacterial load in patients, using external data from an interventional open‐label phase IIb study. Thus, we confirmed the relevance of the exposure–response relationship and could also further characterise the impact of study design and patient characteristics. Additionally, this work was broadened to demonstrate the usefulness of model‐based approaches to predict efficacy of novel dosing regimens with simulations.
Accounting for the exposure–effect relationship was significantly better than just accounting for having BDQ in the treatment (relative likelihood = 0.0003), confirming the importance of adequate BDQ exposure levels for desired treatment response. The typical BDQ weekly average concentration required to achieve half of the expected maximal drug effect (i.e. shortening of the half‐life of bacterial clearance), was 1.57 mg/L (95%CI 1.26–1.98) with C209 data. This finding corresponds approximately to the median observed average concentrations at week 2 of treatment and is in line with the precedent results (1.42 mg/L).8
The wider inclusion criteria of the C209 study, depicted a more real‐world landscape compared to the C208 study; therefore, more heterogeneous patients' profiles were available for analysis. The broader range of drug‐resistance types allowed us to establish that the more sever the drug resistance (MDR, pre‐XDR, and XDR) is, the longer it will take to clear the bacteria. The model estimates translate to a median TSCC of 7 weeks for patients with MDR TB vs 9 weeks for patients with pre‐XDR TB and 14 weeks for patients with XDR TB. The 2 most likely reasons for the observed difference are less efficient background regimen in patients with pre‐XDR and XDR TB and a difference in disease severity. It is reasonable to expect that patients with XDR TB have carried the infection longer and therefore have a more advance pathophysiology. The latter would lead to a slower treatment response since drug distribution to the sites where mycobacteria reside is severely limited in cavitating disease.23 Patients who were pretreated, e.g. had other TB therapy within a month of starting BDQ in study C209, exhibited slower clearance of the bacteria. One possible explanation is that after receiving some TB therapy, multiplying bacteria are already cleared whereas nonmultiplying bacteria or persisters remain, being then more difficult to clear from the body.24, 25, 26, 27 Other possible explanations are bias from patient selection, different effectiveness of the background TB regimen, or a multiphasic mechanism of bacterial clearance not captured by the model. Nonetheless, because of the lower starting bacterial load (15.1 days for pretreated patients vs 7.5 days for treatment‐naïve patients), pretreated patients still achieve SCC faster than treatment‐naïve patients. This is in line with the outcome from the clinical trials (median TSCC of 57 days in C209 where 91% of the patients were pretreated vs 83 days in the BDQ arm of C208 stage 2 which had no pretreated patients). The estimate of the half‐life of bacterial decline in treatment‐naïve patients in C209 is consistent with what was found in C208 (0.90 days [95%CI 0.81–0.97] in C209 and 0.81 days [95%CI 0.71–0.93] in C208).
Finally, we demonstrated how a model‐based approach allows prediction of expected outcomes of alternative dosing regimens, based on the newly established covariates relationships with C209 data. First, we demonstrated that with a semi‐mechanistic approach accounting for type of drug resistance, it would be possible to suggest dosing regimens adapted to each TB patients' subpopulation (Table 3) aiming for the same treatment response for everyone. For example, BDQ exposures after dose adjustment proposed for patients with pre‐XDR TB would be in the same range as BDQ exposures obtained when BDQ is co‐administered with lopinavir/ritonavir.28 The much higher raise required to achieve the model‐predicted exposure suitable for patients with XDR TB (increase of 483%) would result in concentrations well above those previously studied. A main safety concern is the QT‐prolongation. However, model‐based analysis predicts that the maximal QT‐prolongation is achieved already at exposures achieved with standard dosing.29 Elevation of liver enzymes, another safety concern, does not appear to have an exposure–response relation in the studied interval.30 Taken together it is encouraging that higher exposures suitable to treat patients with XDR TB may be safe; however, given that the exposure required markedly exceeds present exposures to BDQ and its metabolite, additional studies are needed. Secondly, we checked that the practical ZeNix dosing schedule for BDQ31 (200 mg daily for 8 weeks and then 100 mg daily for 16 weeks) displays similar treatment response profile as with the approved dosing regimen (Figure 3). A daily regimen would be more convenient for the patient, simpler for treatment programmes to implement, and easier to include in a fixed‐dose combination.32
While this work focused on the newly introduced covariate, other scenarios could have been evaluated based on pharmacokinetics considerations. For instance, a patient with documented low exposure (for example, through therapeutic drug monitoring) or coadministration of a drug known to reduce BDQ concentrations (e.g. efavirenz33) would require a dose adjustment to reach at least the typical concentration levels at standard regimen. Besides, model‐based approaches of modelling TTP data could be extended to the testing of other recently introduced regimens such as the combination therapy of moxifloxacin, pretomanid and pyrazinamide.34
There are some limitations and assumptions of the updated exposure–response model. The study design of the C209 trial included sparser sampling for TTP evaluation, compared to the C208 study which was used to develop the reference model. However, we used priors to allow both studies to influence the final parameter estimates. For some parameters, such as the variability between MGIT replicates, the information was assumed to be supported by study C208. For the other parameters, such as the separate estimates for pre‐XDR and XDR, all information comes from the C209 study which alone contained such information. Moreover, due to limited pharmacokinetic data (predoses samples at 3 time points) and limited spread in exposures (as all the patients were receiving the same dosing regimen), extrapolations outside the range of exposures obtained with observed data are uncertain when exploring alternative dosing regimen (Table A.7) and must be considered carefully and as indicative information. Knowledge of the distribution shape of the extrapolated exposures is useful information to understand the risk associated with such extrapolations (Figure A.8).
In summary, this study validates that exposure differences observed with the recommended dose regimen are associated with different expected treatment responses. Further, the developed pharmacometric exposure–response model could be used to predict efficacy for untested dosing regimens. However, to concretely suggest novel dosing schedules, one needs to account for safety considerations. It would therefore be of value to include the here validated model of bacteriological response in an integrated efficacy and safety framework.
COMPETING INTERESTS
There are no competing interests to declare.
CONTRIBUTORS
M.O.K and E.M.S designed the research, L.T, M.O.K and E.M.S performed the research, L.T wrote the first draft of the article, M.O.K and E.M.S reviewed and revised the article.
Supporting information
Data S1. Supporting Information
ACKNOWLEDGEMENTS
We thank the Swedish Foundation for International Cooperation in Research and Higher Education, STINT, jointly with the South African National Research Council, National Research Foundation [NRF] (Grant No. STINT: SA2015‐6259, NRF: 101575) for the travelling support to South Africa, Cape Town. The research leading to the results has received funding from the Swedish Research Council (grant number 521–2011‐3442) in addition to the Innovative Medicines Initiative Joint Undertaking (http://www.imi.europa.eu) for the PreDiCT‐TB consortium, resources of which are composed of financial contribution from the European Union's Seventh Framework Programme (FP7/2007–2013; grant agreement number 115337) and European Federation of Pharmaceutical Industries and Associations (EFPIA) companies' in‐kind contribution.
Tanneau L, Karlsson MO, Svensson EM. Understanding the drug exposure–response relationship of bedaquiline to predict efficacy for novel dosing regimens in the treatment of multidrug‐resistant tuberculosis. Br J Clin Pharmacol. 2020;86:913–922. 10.1111/bcp.14199
The principal investigator of C209 clinical trial is not 1 of the authors since anonymized data from the study were obtained while shared through the European PreDiCT‐TB consortium (http://www.predict-tb.eu/). Results and outcomes from the C209 clinical trial have already been published (DOI:https://doi.org/10.1183/13993003.00724-2015).
DATA AVAILABILITY STATEMENT
Sharing of pharmacological data is not applicable to this article as no new data were created in this study.
An example of the model code and dataset used is available in the Appendix.
REFERENCES
- 1. Diacon AH, Pym A, Grobusch MP, et al. Multidrug‐resistant tuberculosis and culture conversion with Bedaquiline. N Engl J Med. 2014. Aug 21;371(8):723‐732. [DOI] [PubMed] [Google Scholar]
- 2. Pym AS, Diacon AH, Tang S‐J, et al. Bedaquiline in the treatment of multidrug‐ and extensively drug‐resistant tuberculosis. Eur Respir J. 2016. Feb 1;47(2):564‐574. [DOI] [PubMed] [Google Scholar]
- 3. World Health Organization . WHO|Interim guidance on the use of bedaquiline to treat MDR‐TB [Internet]. WHO. [cited 2017. Nov 27]. Available from: http://www.who.int/tb/challenges/mdr/bedaquiline/en/
- 4. Borisov SE, Dheda K, Enwerem M, et al. Bedaquiline (BQ)‐containing regimen at the programmatic level for MDR‐TB: preliminary results. Eur Respir J. 2017. Sep 1;50(suppl 61):OA4852. [Google Scholar]
- 5. Guglielmetti L, Jaspard M, Le Dû D, et al. Long‐term outcome and safety of prolonged bedaquiline treatment for multidrug‐resistant tuberculosis. Eur Respir J. 2017;49(3). [DOI] [PubMed] [Google Scholar]
- 6. Schnippel K, Ndjeka N, Maartens G, et al. Effect of bedaquiline on mortality in south African patients with drug‐resistant tuberculosis: a retrospective cohort study. Lancet Respir Med. 2018. Sep;6(9):699‐706. [DOI] [PubMed] [Google Scholar]
- 7. Udwadia ZF, Ganatra S, Mullerpattan JB. Compassionate use of bedaquiline in highly drug‐resistant tuberculosis patients in Mumbai. India Eur Respir J. 2017. Mar 1;49(3):1601699. [DOI] [PubMed] [Google Scholar]
- 8. Svensson EM, Karlsson MO. Modelling of mycobacterial load reveals bedaquiline's exposure–response relationship in patients with drug‐resistant TB. J Antimicrob Chemother. 2017. Dec 1;72(12):3398‐3405. [DOI] [PMC free article] [PubMed] [Google Scholar]
- 9. ClinicalTrials.gov . Safety and Efficacy of Various Doses and Treatment Durations of Linezolid Plus Bedaquiline and Pretomanid in Participants With Pulmonary TB, XDR‐TB, Pre‐ XDR‐TB or Non‐responsive/Intolerant MDR‐TB (ZeNix) ‐ Full Text View ‐ ClinicalTrials.gov [Internet]. http://bcp14199.docx. 2017 [cited 2018. Nov 9]. Available from: https://clinicaltrials.gov/ct2/show/NCT03086486
- 10. World Health Organization . WHO|Multidrug‐resistant tuberculosis|Factsheet [Internet]. 2016. Available from: http://www.who.int/tb/areas-of-work/drug-resistant-tb/global-situation/en/
- 11. Svensson E, Dosne A, Karlsson M. Population pharmacokinetics of Bedaquiline and metabolite M2 in patients with drug‐resistant tuberculosis: the effect of time‐varying weight and albumin. CPT Pharmacomet Syst Pharmacol. 2016. Dec;5(12):682‐691. [DOI] [PMC free article] [PubMed] [Google Scholar]
- 12. Gisleskog PO, Karlsson MO, Beal SL. Use of prior information to stabilize a population data analysis. J Pharmacokinet Pharmacodyn. 2002. Dec 1;29(5–6):473‐505. [DOI] [PubMed] [Google Scholar]
- 13. Dosne A‐G, Bergstrand M, Karlsson MO. An automated sampling importance resampling procedure for estimating parameter uncertainty. J Pharmacokinet Pharmacodyn. 2017. Sep;8:1‐12. [DOI] [PMC free article] [PubMed] [Google Scholar]
- 14. Dosne A‐G, Bergstrand M, Harling K, Karlsson MO. Improving the estimation of parameter uncertainty distributions in nonlinear mixed effects models using sampling importance resampling. J Pharmacokinet Pharmacodyn. 2016. Dec 1;43(6):583‐596. [DOI] [PMC free article] [PubMed] [Google Scholar]
- 15. Carlsson KC, Savi RM, Hooker AC, Karlsson MO. Modeling subpopulations with the $MIXTURE subroutine in NONMEM: finding the individual probability of belonging to a subpopulation for the use in model analysis and improved decision making. AAPS j. 2009. Mar 1;11(1):148‐154. [DOI] [PMC free article] [PubMed] [Google Scholar]
- 16. Beal S, Boeckmann A, Bauer RJ. NONMEM User's Guides (1989–2013) [Internet]. Icon Development Solutions, Ellicott City, MD, USA; 2009. Available from: http://www.iconplc.com/innovation/nonmem/ [Google Scholar]
- 17. Karlsson MO, Hooker A, Nordgren R, Harling K, Freiberga S. Perl‐speaks‐NONMEM (PsN) [Internet]. 2016. Available from: https://uupharmacometrics.github.io/PsN/
- 18. Lindbom L, Pihlgren P, Jonsson N. PsN‐toolkit—A collection of computer intensive statistical methods for non‐linear mixed effect modeling using NONMEM. Comput Methods Programs Biomed. 2005. Sep 1;79(3):241‐257. [DOI] [PubMed] [Google Scholar]
- 19. Keizer RJ, Karlsson MO, Hooker A. Modeling and simulation workbench for NONMEM: tutorial on Pirana, PsN, and Xpose. CPT Pharmacomet Syst Pharmacol. 2013. Jun;2(6): 1–9. e50. [DOI] [PMC free article] [PubMed] [Google Scholar]
- 20. Hooker A, Karlsson MO, Wilkins JJ, Jonsson EN, Keizer RJ. Xpose R package [Internet]. Available from: http://xpose.sourceforge.net
- 21. Keizer RJ, van Benten M, Beijnen JH, Schellens JHM, Huitema ADR. Piraña and PCluster: a modeling environment and cluster infrastructure for NONMEM. Comput Methods Programs Biomed. 2011. Jan;101(1):72‐79. [DOI] [PubMed] [Google Scholar]
- 22. Johansson ÅM, Karlsson MO. Comparison of methods for handling missing covariate data. AAPS j. 2013. Sep 11;15(4):1232‐1241. [DOI] [PMC free article] [PubMed] [Google Scholar]
- 23. Imperial MZ, Nahid P, Phillips PPJ, et al. A patient‐level pooled analysis of treatment‐shortening regimens for drug‐susceptible pulmonary tuberculosis. Nat Med. 2018. Nov;24(11):1708‐1715. [DOI] [PMC free article] [PubMed] [Google Scholar]
- 24. Babiarz KS, Suen S, Goldhaber‐Fiebert JD. Tuberculosis treatment discontinuation and symptom persistence: an observational study of Bihar, India's public care system covering >100,000,000 inhabitants. BMC Public Health. 2014. May 1;14:418. [DOI] [PMC free article] [PubMed] [Google Scholar]
- 25. Zhang Y, Yew WW, Barer MR. Targeting Persisters for tuberculosis control. Antimicrob Agents Chemother. 2012. May;56(5):2223‐2230. [DOI] [PMC free article] [PubMed] [Google Scholar]
- 26. Torrey HL, Keren I, Via LE, Lee JS, Lewis K. High Persister mutants in Mycobacterium tuberculosis . PLoS ONE [Internet]. 2016. May 13 [cited 2019 Jan 24];11(5). Available from:). https://www.ncbi.nlm.nih.gov/pmc/articles/PMC4866775/ [DOI] [PMC free article] [PubMed] [Google Scholar]
- 27. Coates A, Hu Y, Bax R, Page C. The future challenges facing the development of new antimicrobial drugs. Nat Rev Drug Discov. 2002. Nov;1(11):895‐910. [DOI] [PubMed] [Google Scholar]
- 28. Brill MJE, Svensson EM, Pandie M, Maartens G, Karlsson MO. Confirming model‐predicted pharmacokinetic interactions between bedaquiline and lopinavir/ritonavir or nevirapine in patients with HIV and drug‐resistant tuberculosis. Int J Antimicrob Agents. 2017. Feb;49(2):212‐217. [DOI] [PubMed] [Google Scholar]
- 29. Tanneau L, Svensson E, Rossenu S, Karlsson MO. Bedaquiline appears to antagonize its own main metabolite's QTcF interval prolonging effect. In Montreux, Switzerland; 2018. Available from: https://www.page-meeting.org/default.asp?abstract=8634 [Google Scholar]
- 30. Tanneau L, Svensson E, Karlsson MO. Evaluating potential link between liver enzyme abnormalities and bedaquiline exposure in multi‐drug resistant tuberculosis patients. In: Stockholm, Sweden [Internet]. 2019. Available from: http://www.page-meeting.org/?abstract=9123
- 31. Conradie F, Everitt D, Dawson R. New TB regimens promise to simplify, shorten therapy. Infectious disease news [Internet]. 2017. Feb 15 [cited 2017 Nov 22]; Available from: https://www.healio.com/infectious-disease/respiratory-infections/news/online/%7B515576ae-1132-4929-a292-3149a2271286%7D/new-tb-regimens-promise-to-simplify-shorten-therapy
- 32. TB alliance . Annual report [Internet]. http://www.tballiance.org; 2017. Available from: https://www.tballiance.org/annualreport2017/
- 33. Svensson EM, Aweeka F, Park J‐G, Marzan F, Dooley KE, Karlsson MO. Model‐based estimates of the effects of efavirenz on bedaquiline pharmacokinetics and suggested dose adjustments for patients coinfected with HIV and tuberculosis. Antimicrob Agents Chemother. 2013. Jun;57(6):2780‐2787. [DOI] [PMC free article] [PubMed] [Google Scholar]
- 34. Dawson R, Diacon AH, Everitt D, et al. Efficiency and safety of the combination of moxifloxacin, pretomanid (PA‐824), and pyrazinamide during the first 8 weeks of antituberculosis treatment: a phase 2b, open‐label, partly randomised trial in patients with drug‐susceptible or drug‐resistant pulmonary tuberculosis. Lancet Lond Engl. 2015. May 2;385(9979):1738‐1747. [DOI] [PubMed] [Google Scholar]
Associated Data
This section collects any data citations, data availability statements, or supplementary materials included in this article.
Supplementary Materials
Data S1. Supporting Information
Data Availability Statement
Sharing of pharmacological data is not applicable to this article as no new data were created in this study.
An example of the model code and dataset used is available in the Appendix.