

Abstract
Aims
This study assessed the cost‐effectiveness of long‐acting insulin analogues (LAIAs) vs intermediate/long‐acting human insulin (ILAHI) for patients with type 1 diabetes (T1D) in real‐world clinical practice.
Methods
Individual‐level analyses were conducted within a longitudinal population‐based cohort of 540 propensity score‐matched T1D patients (LAIAs, n = 270; ILAHI, n = 270) with over 10 years of follow‐up using Taiwan's National Health Insurance Research Database, 2004–2013, from third‐party payer and healthcare sector perspectives. The study outcomes included the number needed to treat (NNT) to prevent one case of clinical events (eg, hypoglycaemia, diabetes‐related complications), medical costs, and cost per case of events prevented. Cost estimates are presented in 2013 British pounds (GBP, £).
Results
The NNTs using LAIAs vs ILAHI to avoid one case of hypoglycaemia requiring medical assistance, outpatient hypoglycaemia and any diabetes‐related complications were 12, 9 and 10 for mean follow‐up periods of 5.84, 6.02 and 3.62 years, respectively. From third‐party payer and healthcare sector perspectives, using LAIAs instead of ILAHI saved GBP6924‐GBP7116 per case of hypoglycaemia requiring medical assistance prevented, GBP5346‐GBP5508 per case of outpatient hypoglycaemia prevented, and GBP3570‐GBP3680 per case of any diabetes‐related complications prevented. Sensitivity analyses considering sampling uncertainty showed that using LAIAs over ILAHI yields at least a 76% probability of cost‐saving for avoiding one case of hypoglycaemia requiring medical assistance, outpatient hypoglycaemia or any diabetes‐related complications.
Conclusions
This real‐world evidence reveals that compared with ILAHI, the greater pharmaceutical costs associated with LAIAs for patients with T1D could be substantially offset by savings from averted hypoglycaemia or diabetes‐related complications.
Keywords: cost‐effectiveness analysis, intermediate/long‐acting human insulin, long‐acting insulin analogues, longitudinal cohort study, type 1 diabetes
What is already known about this subject
Long‐acting insulin analogues (LAIAs) yield better efficacy in glycaemic control and reduce the risk of hypoglycaemia relative to intermediate/long‐acting human insulin (ILAHI) in clinical trials. In a real‐world setting, however, few studies have demonstrated the effectiveness of LAIAs in preventing long‐term diabetes‐related complications and it remains unknown whether the high costs of LAIAs could be justified against their potential effectiveness compared with ILAHI.
What this study adds
In a real‐world setting, the high costs of LAIAs could be justified based on their effectiveness compared with ILAHI under a single‐payer healthcare system.
Based on the empiric data analysis from a nationwide claims database in Taiwan, LAIAs relative to ILAHI saved GBP852 and GBP876 per patient from third‐party payer and healthcare sector perspectives, respectively, over a mean follow‐up of 7.2 years.
LAIAs should be considered as an economically reasonable first‐line choice for the basal insulin regimen in the treatment of patients with type 1 diabetes.
1. INTRODUCTION
Type 1 diabetes (T1D) is associated with an increased risk of vascular complications compared with the non‐diabetic population.1, 2, 3 The morbidity and mortality associated with diabetes have resulted in a substantial economic burden on national healthcare.4 In 2009, the estimated number of patients with T1D in Taiwan was 8043, which accounts for less than 1% of the diabetic population; the age‐standardized incidence rate was 31.3 per million persons.5 Although T1D accounts for a small proportion of the diabetic population, it leads to a substantial economic burden in Taiwan. Our previous study showed that T1D was associated with lifetime healthcare expenditures of British Pounds (GBP, £) 65 158 per case in Taiwan.6 Moreover, the annual healthcare costs per case for patients with T1D were estimated to be 1.5 to 3 times greater than those for patients with type 2 diabetes according to studies from the United States.7, 8
Patients with T1D typically require multiple‐dose insulin injections to mimic the natural secretory pattern of insulin in the body. Long‐acting insulin analogues (LAIAs) have better pharmacokinetic and pharmacodynamic profiles,9, 10, 11, 12 resulting in a slight reduction in glycosylated hemoglobin (HbA1c) (less than 0.5%) and a lower risk of hypoglycaemia compared with those for intermediate/long‐acting human insulin (ILAHI) (eg, neutral protamine Hagedorn; NPH).13 However, the price of LAIAs (ie, insulin glargine, insulin detemir) is four times higher than that of NPH according to Taiwan's National Health Insurance (NHI) price listings.14 The economic value of LAIAs is debated15, 16 because of their high acquisition costs compared with that of ILAHI and the uncertainty of their effectiveness in improving solid clinical outcomes (eg, diabetes‐related complications). Patients' age and treatment convenience could be important factors influencing clinicians' decisions in selecting LAIA vs ILAHI for patients with T1D in Taiwan. Specifically, for young children with T1D who are unable to use injectable insulin by themselves at school, it is more convenient for their parents to use a regimen of ILAHI and short‐acting insulin twice daily (ie, before and after school). Older children, adolescents and adult patients with T1D are likely to be prescribed a four‐times‐daily regimen with LAIA once daily and rapid‐acting insulin three times daily to reduce the risk of hypoglycaemia.
Although several cost‐effectiveness studies of LAIAs vs ILAHI among patients with T1D exist, the results remain inconclusive and no such study has been done in Taiwan. Studies have shown that some LAIAs (ie, glargine,17, 18 detemir19, 20, 21, 22, 23 and degludec23) are more costly but also more effective than ILAHI, with a large variation in incremental cost‐effectiveness ratio estimates, from GBP2562 to GBP99 683 per quality‐adjusted life year, while others (ie, glargine24 and detemir25) are cost‐saving compared to ILAHI. Moreover, the results from previous studies17, 18, 19, 20, 21, 22, 23, 24, 25 should be interpreted with caution. First, the model inputs in the model‐based simulation studies were typically taken from a single clinical trial with limited sample size and follow‐up time.17, 18, 19, 20, 21, 22, 24, 25 However, the efficacy data from clinical trials may not translate to clinical effectiveness/outcomes. The model inputs directly taken from clinical trials may not be generalizable to patients in a real‐world setting because available treatments and recommended strategies may differ by country, and the risk equations, utilities, resource utilization and costs may be subject to change. For example, adherence to treatment in a real‐world setting is often lower than that observed in clinical trials. Second, the projection of long‐term outcomes (eg, incidence of diabetes‐related complications) is usually done using short‐term results based on clinical biomarkers (eg, HbA1c) due to a lack of effectiveness data from real‐world settings.17, 18, 19, 20, 21, 22, 23, 24, 25 However, the extrapolation from clinical biomarkers to clinical events in cost‐effectiveness analysis (CEA) should be done with caution. Third, the results of CEA depend on the willingness‐to‐pay (WTP) threshold made by health policy decision‐makers, which varies by country and healthcare setting. These limitations highlight the importance of conducting CEA in a real‐world setting from various perspectives to corroborate previous study findings.
Against this background, we estimated the real‐world cost‐effectiveness of LAIAs vs ILAHI among patients with T1D in Taiwan. Real‐world evidence provides valuable information to complement the evidence from randomized controlled trials,26 and it has increasingly appeared in recent studies of diabetes.27, 28, 29, 30 The effectiveness inputs in this CEA were based on our published comparative effectiveness study of basal insulins, in which reduced risks of hypoglycaemia and diabetes‐related complications associated with LAIAs vs ILAHI were found.29 The individual‐level cost estimates were measured using Taiwan's National Health Insurance Research Database (NHIRD), which includes nationwide, population‐based, longitudinal data.
2. METHODS
2.1. Data source
This study was approved by the Institutional Review Board of National Cheng Kung University Hospital (B‐EX‐103‐015). This CEA utilized the claims data of a nationwide diabetes cohort to examine the long‐term effectiveness and cost consequences of basal insulins. Specifically, individual‐level data were obtained from the Longitudinal Cohort of Diabetes Patients (LHDB) 2004–2013 from the NHIRD, which contains emergency, outpatient, inpatient, and pharmacy claims. Taiwan's NHI is a single‐payer, universal‐access healthcare system that was introduced in 1995 and covers over 99% of Taiwan's population.31, 32 The application of the LHDB is described in detail elsewhere.29, 33
2.2. Description of study cohort
Patients who had an ICD‐9‐CM diagnosis code of T1D (250.X1 or 250.X3) and were issued a Catastrophic Illness Card (CIC) for T1D were identified in the LHDB. We further excluded those who were prescribed with oral antidiabetic agents (except for metformin and thiazolidinediones) after the CIC for T1D was issued and those who had a history of chronic diabetes‐related complications (ie, cardiovascular disease, nephropathy, neuropathy and retinopathy). Among patients identified as T1D, those who were newly prescribed with basal insulins (ie, LAIAs or ILAHI) and had persistent use of the basal insulin (ie, at least three refills with any gaps between two consecutive refills of fewer than 180 days) between 2004 and 2008 were included in the analyses. The propensity score (PS)‐matching method was then applied to identify baseline comparable users of LAIAs (n = 270) with those on ILAHI (n = 270). The follow‐up period for each study patient started from the first prescription of basal insulins until the occurrence of a diabetes‐related complication, dropout from Taiwan's NHI program, death or the end of 2013, whichever came first, for the effectiveness estimates, and until dropout from Taiwan's NHI program, death or the end of 2013, whichever came first, for the cost estimates. After applying the PS‐matching method, all baseline characteristics were comparable between the LAIA and ILAHI groups (mean age of each group was 18 years old). More details about the cohort extraction procedure, patient characteristics before and after PS matching and comparative effectiveness results of basal insulins can be found elsewhere.29
2.3. Study method
As recommended by the Second Panel on Cost‐Effectiveness in Health and Medicine,34 the structure of the study methods is summarized in an Impact Inventory, consisting of potential effectiveness and cost consequences of basal insulins for the third‐party payer (payer hereafter) and healthcare sector perspectives (Supplementary Table 1). For each perspective, we measured the effect of basal insulins on health outcomes in terms of the number needed to treat (NNT) for preventing diabetes‐related complications and all direct medical costs, including future diabetes‐related and ‐unrelated medical costs paid by a third‐party payer and the copayment (for healthcare sector perspective). For each study patient, we measured their direct medical costs during the follow‐up, which represented the expenditures for all medical services and products associated with medical management of their diseases paid by Taiwan's NHI program (eg, costs of emergency department visits, hospitalization, outpatient care, laboratory tests and medications) and the out‐of‐pocket expense paid by patients. The reporting of this study follows the Consolidated Health Economic Evaluation Reporting Standards (CHEERS) statement (Table S2).
2.4. Effect of basal insulins on health outcomes
The effectiveness of basal insulins was defined as the NNT for preventing one case of diabetes‐related complications (ie, cardiovascular disease [CVD], nephropathy, retinopathy, neuropathy, hospitalized hyperglycaemia, any hypoglycaemia requiring medical assistance, outpatient hypoglycaemia and hospitalized hypoglycaemia) or all‐cause death. NNT measures were estimated using Equations (1), (2), (3). First, we converted the incidence rates of diabetes‐related complications obtained from our published study29 into cumulative incidences using Equation (1), 35:
| (1) |
where t denotes the average observational period for each outcome of interest among the study cohort, CI is the cumulative incidence of the outcome of interest during time t and IR is the incidence rate of the outcome of interest measured during time t. Second, absolute risk reduction (ARR) was measured as the difference in the cumulative incidences of the outcome of interest during time t between the LAIA group (CI 1) and the ILAHI group (CI 0) (Equation (2)). NNT was then estimated as 1 divided by the ARR (Equation (3)). For three outcomes in which a statistically significant difference in risks was found between the LAIA and ILAHI groups (ie, hypoglycaemia requiring medical assistance, outpatient hypoglycaemia and any diabetes‐related complications), we calculated the 95% confidence intervals (CIs) using the Wald method.36
| (2) |
| (3) |
2.5. Medical costs
Each of the medical costs listed in the impact inventory was measured as a summary of cost components from the following claims files in Taiwan's NHIRD: emergency department, inpatient admission, outpatient visit and pharmacy. Cost components in these claims files include the costs of diagnosis, treatments (ie, examinations, procedures and special materials), pharmaceutical services and medications. In Taiwan, copayments are typically required for patients but can be waived for patients with catastrophic diseases such as T1D.37, 38 In this study, copayments were considered as the out‐of‐pocket (OOP) expense paid by patients. In the analyses from the third‐party payer perspective, we included all medical services and costs during the follow‐up related to the emergency room, outpatient, inpatient and pharmacy components but excluded the OOP expense. In the analyses from the healthcare sector perspective, we also included the OOP expense.
To adjust for differences in baseline medical costs (ie, one year before the beginning of basal insulin therapy) for LAIA and ILAHI users, a regression‐based adjustment was performed (Equation (4))39:
| (4) |
Total medical cost (costj) for a given patient j is an explanatory variable, and baseline cost (costbaselinej) and basal insulin group (treatmentj = 1 for the LAIA group and treatmentj = 0 for the ILAHI group) are independent variables.
We used log‐transformation to reduce the skewness of cost data and to improve the normality of our data. We then calculated the adjusted total medical costs for each perspective using Equation (5), 39:
| (5) |
where is the adjusted total medical cost for a given person j, βbaseline is the beta coefficient for baseline cost (ie, costbaselinej) obtained from Equation (4), and costmean at baseline is the mean baseline cost for all patients from the study cohort.
All cost estimates were standardized to the year 2013 using the Taiwan consumer price index (https://eng.stat.gov.tw/public/data/dgbas03/bs3/english/cpiidx.xls) and converted to 2013 GBP using an average exchange rate of GBP1:NT$46.4 from 2013.
2.6. Cost‐effectiveness analysis of basal insulins
NNT is a measure of treatment effectiveness and is interpreted as the average number of patients with T1D who would need to be treated with LAIA relative to ILAHI for a given follow‐up period of time to prevent one case of diabetes‐related complications or all‐cause death. A lower absolute value of NNT indicates a more effective intervention. The incremental costs refer to the difference in the average per‐patient medical costs during the given follow‐up period between the LAIA and ILAHI groups. Thus, cost‐effectiveness analyses were performed by multiplying the estimates of incremental costs between LAIAs and ILAHI by the NNT for a given study outcome from the payer and healthcare sector perspectives. The incremental cost‐effectiveness ratio (ICER) was estimated as the incremental cost per one case of outcomes of interest prevented when LAIAs are used compared with ILAHI. Because NNT is intrinsically understandable and often used as a decision tool by clinicians, and can conveniently be combined with costs to calculate cost‐effectiveness, it has become increasingly used as a tool in health economic evaluation studies, including those on chronic diseases such as diabetes, cancer, heart failure, atrial fibrillation, psoriasis and rheumatoid arthritis.40, 41, 42, 43, 44, 45, 46, 47, 48, 49, 50 Moreover, the inclusion of NNT increases clinical relevance and the application of CEA results, and an increased understanding of the relationships between CEA and NNT may help clinicians apply CEA findings in practice.40
2.7. Sensitivity analysis
To capture the sampling uncertainty in the ICER estimates, the nonparametric bootstrap method was applied to generate 1000 replicated estimates of incremental cost‐effectiveness pairs51 for the study subjects. The 95% CIs for ICER were defined as the 2.5th and 97.5th ranked ICER of the 1000 replicated estimates. A summary measure of the joint uncertainty of costs and effectiveness has been presented as cost‐effectiveness acceptability curves (CEACs), which indicate the probability of cost‐effectiveness at various WTP thresholds.52 According to the World Health Organization,53 an intervention strategy is considered cost‐effective if the ICER is less than three times the gross domestic product (GDP) per capita (ie, GBP41 943 in Taiwan, 201354), and it is considered highly cost‐effective if the ICER is less than one GDP per capita (ie, GBP13 981 in Taiwan, 2013). Furthermore, we performed several sensitivity analyses to estimate the ICER based on the scenarios considered in our published effectiveness study29: (1) the effectiveness estimates were derived from the intention‐to‐treat (ITT) analysis (ie, the observation of individual patients was stopped/censored if patients died, withdrew from Taiwan's NHI or at the end of 2013, whichever came first) and the cost calculation was based on the ITT analysis with consideration of the occurrence of the event of interest as the censoring variable, (2) both the effectiveness and cost estimates were derived from the on‐treatment (OT) analysis (ie, the observation of individual patients was stopped/censored if patients died, withdrew from Taiwan's NHI, at the end of 2013, or the treatment pattern changed [ie, switch or discontinuation], whichever came first) and (3) the effectiveness estimates were derived from the OT analysis and the cost calculation was based on the OT analysis with consideration of the occurrence of the event of interest as the censoring variable.
3. RESULTS
3.1. Effectiveness estimates
Our effectiveness study revealed that compared with ILAHI, LAIAs led to a significantly lower risk of hypoglycaemia and any diabetes‐related complications.29 Relative to ILAHI, 12, 9 and 10 patients (95% CIs 6 to 75, 6 to 27 and 6 to 74, respectively) would need to be treated with LAIAs for a mean of 5.84, 6.02 and 3.62 years to prevent a case of hypoglycaemia requiring medical assistance, outpatient hypoglycaemia and any diabetes‐related complications, respectively (Table 1).
Table 1.
Disaggregated results of effectiveness for cost‐effectiveness analysis
| Diabetes‐related complications | Incidence ratesa | Mean follow‐up time (years) | Estimated cumulative incidences | NNT | |||||
|---|---|---|---|---|---|---|---|---|---|
| ILAHI | LAIA | ILAHI | LAIA | Overall | ILAHI | LAIA | HR (95% CIs) | ||
| CVD | 5.2 | 1.6 | 7.15 | 7.13 | 7.14 | 0.0363 | 0.0111 | 0.304 (0.084–1.106) | 40 |
| Nephropathy | 23.7 | 24.3 | 6.72 | 6.55 | 6.64 | 0.1455 | 0.1490 | 1.027 (0.673–1.568) | −284 |
| Retinopathy | 64.1 | 58.5 | 5.66 | 5.64 | 5.65 | 0.3039 | 0.2813 | 0.918 (0.689–1.223) | 44 |
| Neuropathy | 15.6 | 18.5 | 6.90 | 6.61 | 6.76 | 0.0999 | 0.1173 | 1.169 (0.710–1.925) | −57 |
| Hospitalized hyperglycaemia | 54.0 | 49.4 | 5.96 | 5.77 | 5.87 | 0.2717 | 0.2517 | 0.910 (0.670–1.237) | 50 |
| Hypoglycaemia that requires medical assistance | 61.8 | 41.7 | 5.63 | 6.04 | 5.84 | 0.3029 | 0.2160 | 0.681 (0.498–0.930) | 12 |
| Outpatient hypoglycaemia | 56.6 | 33.0 | 5.76 | 6.28 | 6.02 | 0.2886 | 0.1804 | 0.592 (0.424–0.828) | 9 |
| Hospitalized hypoglycaemia | 7.4 | 12.0 | 7.05 | 6.76 | 6.91 | 0.0495 | 0.0798 | 1.622 (0.830–3.170) | −33 |
| Any diabetes‐related complicationsb | 224.7 | 169.8 | 3.46 | 3.77 | 3.62 | 0.5564 | 0.4589 | 0.782 (0.639–0.956) | 10 |
| All‐cause death | 2.0 | 1.0 | 7.27 | 7.16 | 7.22 | 0.0146 | 0.0074 | 0.502 (0.092–2.739) | 140 |
Abbreviations: CIs, confidence intervals; CVD, cardiovascular disease; HR, hazard ratio; ILAHI, intermediate/long‐acting human insulin; LAIA, long‐acting insulin analogue; NNT, number needed to treat.
Incidence rates are presented as patient number per 1000 person‐years.
Any diabetes‐related complications consisted of CVD, nephropathy, retinopathy, neuropathy, hospitalized hyperglycaemia or hypoglycaemia that requires medical assistance.
3.2. Cost estimates
Table 2 outlines the disaggregated cost estimates per patient for LAIA and ILAHI users. The adjusted total cost per patient for LAIAs was lower than that for ILAHI, with a difference of –GBP852 per patient from the payer perspective and –GBP876 from the healthcare sector perspective, over a mean follow‐up of 7.2 years. The cost differences were mainly due to differences in outpatient care and inpatient care. The cost estimates for medications are shown in Table S3. The cost of antidiabetic drugs per patient among the users of LAIAs was higher than that for ILAHI users, which was most likely due to the higher acquisition costs of LAIAs. However, the costs of other medications per patient were much lower in the LAIA group vs the ILAHI group. As a result, the overall medication cost per patient in the LAIA group was GBP552 less than that in the ILAHI group.
Table 2.
Disaggregated results of costs per patient over follow‐up period (mean = 7.22 years) for cost‐effectiveness analysis
| (2013 GBP) | ILAHI group | LAIA group | ΔC |
|---|---|---|---|
| Third‐party payer perspective | |||
| Third‐party payer costs | 9427 | 8183 | −1244 |
| Third‐party payer costs (adjusted a ) | 8852 | 8000 | −852 |
| Healthcare sector perspective | |||
| Emergency costs | 231 | 226 | −4 |
| Diagnosis | 54 | 50 | −4 |
| Treatment | 156 | 154 | −2 |
| Pharmaceutical service | 4 | 4 | 0 |
| Medication | 16 | 19 | 3 |
| Outpatient costs | 6908 | 5751 | −1156 |
| Diagnosis | 795 | 692 | −102 |
| Treatment | 2049 | 1550 | −500 |
| Pharmaceutical service | 127 | 115 | −12 |
| Medication | 3937 | 3395 | −542 |
| Inpatient costs | 1511 | 1235 | −276 |
| Room | 499 | 407 | −92 |
| Diagnosis | 114 | 112 | −1 |
| Therapy and examination | 506 | 469 | −38 |
| Pharmaceutical service | 30 | 22 | −7 |
| Medication | 309 | 181 | −128 |
| Special material | 53 | 44 | −9 |
| Pharmacy costs | 977 | 1147 | 171 |
| Pharmaceutical service | 34 | 31 | −3 |
| Medication | 510 | 626 | 116 |
| Special material | 433 | 490 | 57 |
| Out‐of‐pocket expense | 199 | 177 | −22 |
| Healthcare sector costs | 9626 | 8360 | −1266 |
| Healthcare sector costs (adjusted a ) | 9061 | 8186 | −876 |
Abbreviations: ΔC, difference in costs per case between LAIA and ILAHI users; ILAHI, intermediate/long‐acting human insulin; LAIA, long‐acting insulin analogue.
Adjusted for baseline difference in medical costs between insulin groups.
3.3. Costs per case of event prevented
The incremental costs of the average medical costs per patient per year between the LAIA and ILAHI users were calculated from the payer (–GBP99) and healthcare sector (–GBP102) perspectives (Table S4). The base‐case analysis demonstrates that using LAIAs vs ILAHI is cost‐saving in terms of preventing one case of hypoglycaemia requiring medical assistance, outpatient hypoglycaemia and any diabetes‐related complications (Table 3). For example, relative to ILAHI, 10 patients would need to be treated with LAIAs for 3.62 years to prevent one case of any diabetes‐related complications, which would save GBP3570 and GBP3680 per case from the payer and healthcare sector perspectives, respectively.
Table 3.
Results of cost‐effectiveness analysis of long‐acting insulin analogues vs intermediate/long‐acting human insulin
| Event of interest | NNT | Mean follow‐up time (years)b | ΔC over mean follow‐up timec | Costs per case with event of interest prevented over mean follow‐up time | ||
|---|---|---|---|---|---|---|
| Third‐party payer perspective | Healthcare sector perspective | Third‐party payer perspective | Healthcare sector perspective | |||
| Individual complications | ||||||
| CVD | 40 | 7.14 | −705 | −725 | −28 200 | −29 000 |
| Nephropathy | −284 | 6.64 | −656 | −675 | 186 304 | 191 700 |
| Retinopathy | 44 | 5.65 | −558 | −574 | −24 552 | −25 256 |
| Neuropathy | −57 | 6.76 | −667 | −687 | 38 019 | 39 159 |
| Hospitalized hyperglycaemia | 50 | 5.87 | −580 | −596 | −29 000 | −29 800 |
| Hypoglycaemia that requires medical assistancea | 12 | 5.84 | −577 | −593 | −6924 | −7116 |
| Outpatient hypoglycaemiaa | 9 | 6.02 | −594 | −612 | −5346 | −5508 |
| Hospitalized hypoglycaemia | −33 | 6.91 | −682 | −702 | 22 506 | 23 166 |
| Any diabetes‐related complicationa , d | 10 | 3.62 | −357 | −368 | −3570 | −3680 |
| All‐cause death | 140 | 7.22 | −713 | −734 | −99 820 | −102 760 |
Abbreviations: ΔC, difference in costs per case between LAIA and ILAHI users; CVD, cardiovascular disease; NNT, number needed to treat.
Compared with ILAHI use, LAIA use was associated with a significantly lower risk of these events.
The follow‐up period of time per person for each event of interest started from the first prescription of basal insulins until occurrence of an event, withdrawal from Taiwan's NHI program, death or the end of 2013, whichever came first.
Average difference in the cost per patient per year between LAIA and ILAHI users is estimated in detail in Table S4.
Any diabetes‐related complications consisted of CVD, nephropathy, retinopathy, neuropathy, hospitalized hyperglycaemia or hypoglycaemia that requires medical assistance.
Note: All cost estimates are in 2013 GBP.
Using the nonparametric bootstrapping method, the 95% CIs for estimated incremental costs were between –GBP2927 and –GBP1003 from the payer perspective and between –GBP3158 and –GBP809 from the healthcare sector perspective. The CEACs in Figure 1 indicate that the probabilities that LAIAs are cost‐saving compared with ILAHI from the payer perspective (healthcare sector perspective) is 76.9% (77.3%), 76.8% (77.2%) and 76.5% (76.9%), respectively, for avoiding one case of hypoglycaemia requiring medical assistance, outpatient hypoglycaemia and any diabetes‐related complications. Using one GDP per capita (ie, GBP13 981) as the WTP threshold, there was a 96.6–98.6% probability that LAIAs are highly cost‐effective for preventing one case of these clinical events from the payer and healthcare sector perspectives. The results from several scenario sensitivity analyses shown in Tables S5–S11 demonstrate that LAIAs are either cost‐saving or highly cost‐effective compared with ILAHI, which is consistent with the findings from base‐case analyses.
Figure 1.
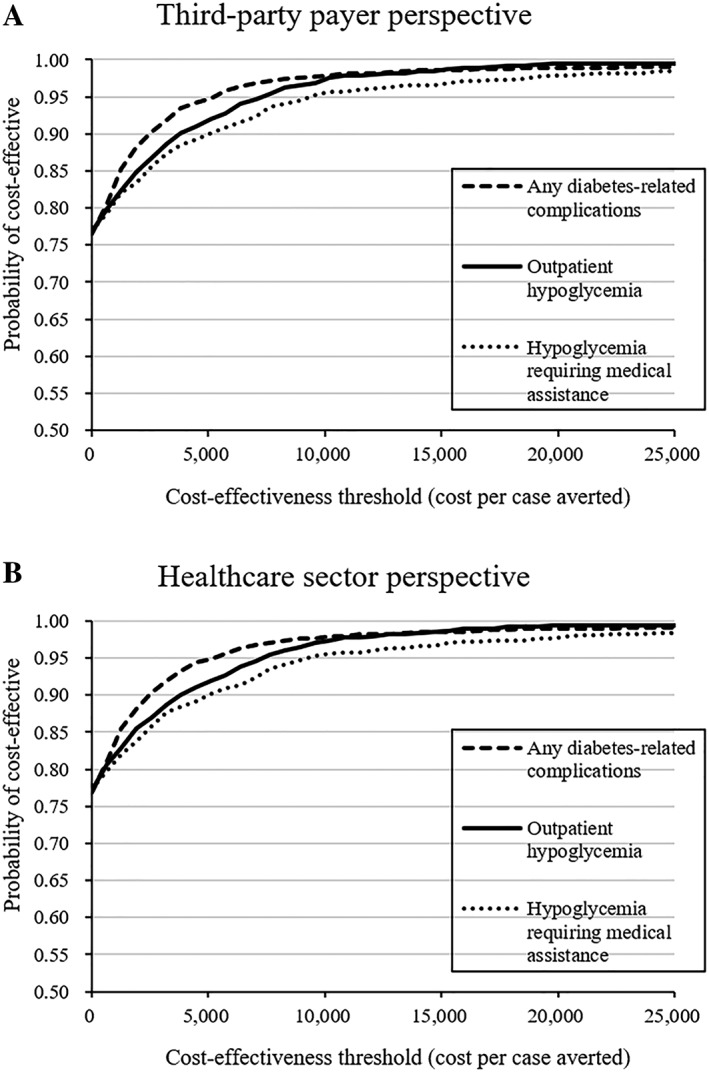
Cost‐effectiveness acceptability curves using 1000 bootstraps (cost estimates are in 2013 GBP) (A) from the third‐party payer perspective and (B) from the healthcare sector perspective
4. DISCUSSION
This is the first real‐world CEA of LAIAs vs ILAHI based on the comparative effectiveness results obtained from a large population‐based cohort study of T1D in a real‐world setting. Relative to ILAHI, LAIAs for patients with T1D are cost‐saving for preventing one case of hypoglycaemia requiring medical assistance, outpatient hypoglycaemia and any diabetes‐related complications, mainly owing to the reductions in outpatient and inpatient costs. LAIAs are highly cost‐effective, with an almost 100% likelihood of falling below one GDP per capita for Taiwan (GBP13 981).
Although a direct comparison of our study with existing cost‐effectiveness studies17, 18, 19, 20, 21, 22, 23, 24, 25 may be a challenge due to the use of different analytic approaches, study perspectives and healthcare settings, this real‐world, population‐based cost‐effectiveness research provides supporting data for favourable economic outcomes using LAIAs vs ILAHI in patients with T1D. In particular, our analyses were based on clinical data derived from a large population‐based cohort study with long‐term follow‐up on a varied range of diabetes‐related complications and all‐cause death. Our study allows a sufficient time horizon to measure relevant health impacts and costs, which is rarely the case in trial‐based cost‐effectiveness studies. Moreover, we utilized Taiwan's NHIRD, which is a data source with a nationwide representative population, for a comprehensive estimation of all economic consequences of treatments reimbursed by Taiwan's NHI for individuals with T1D. A cost analysis study of basal insulins for T1D in a real‐world setting was previously conducted using Germany's claims database,55 but a CEA was not performed and the cost estimates were based on only a 1‐year period. The study demonstrated a trend of lower annual costs for insulin glargine users owing to the lower costs of bolus insulin, blood glucose test strips, lancets, needles and antihypoglycaemic treatments vs NPH users. The results of this short‐term cost analysis are consistent with our findings that LAIAs have higher acquisition costs, but other relevant medical costs for LAIA users (Tables 2 and S3) are lower than those for ILAHI users, therefore the lower economic burden associated with the use of LAIAs vs ILAHI may be partly due to lower medical resource consumption (eg, examinations, other treatments) in the short term and lower risks of diabetes‐related complications in the long term.
Several limitations in our study need to be addressed. First, our analysis did not include direct nonmedical costs (eg, transportation costs) and indirect costs (eg, lost productivity for individuals) due to data unavailability, and thus the results of this study may not be extrapolated to a societal or individual patient's perspective. Second, the costs of lancets and blood glucose meters were not estimated because such materials are not reimbursed by Taiwan's NHI. However, we estimated the costs of needles and test strips, which accounted for most of the costs related to self‐monitoring of blood glucose. Third, degludec, an ultra‐long‐acting insulin analogue, was not included in our analyses because it was unavailable in Taiwan in the study period. Fourth, some diabetes‐related complications could greatly reduce a person's quality of life and thus should be considered in a cost‐utility analysis. However, due to a lack of representative utility data for Taiwanese patients with T1D, a cost‐utility analysis was not conducted. Fifth, including NNT in CEA studies may increase the understanding and relevance of CEA findings to clinical decision‐makers, but we acknowledge its limitations.56 For instance, our study used NNT to quantify the treatment effectiveness as a function of the difference in the probability of developing an outcome event between two treatment groups, which can only measure one type of benefit (eg, any diabetes‐related complications in the present study) at one time. In future studies, a survival analysis that estimates the area under survival curves between two treatment groups could be used to measure the aggregated benefit (eg, quality‐adjusted life years gained), which would provide a more comprehensive measure to account for treatment benefits. Sixth, this study was based on a PS‐matched cohort that consisted of two comparable drug groups (ie, LAIA and ILAHI), while some unmatched subjects who were treated with LAIA or ILAHI may not be included in the analyses.57, 58 Our study results therefore may limit the generalizability to those matched patients treated with LAIA or ILAHI. Seventh, although we found a comparable prescription refill pattern of insulins between the two study groups, we did not account for patients' adherence behaviour for insulin therapy in this economic analysis study. This is because the claims‐based data did not reveal the detailed information of insulin dosages that patients actually consumed. Moreover, our published comparative‐effectiveness cohort study that was used to generate the effectiveness input parameters for this economic analysis study had implemented two procedures to minimize the potential impact from medication non‐adherence.29 First, our study only included the stable users for insulin therapy, defined as at least three consecutive refills from the same insulin group among the first five prescriptions after initiation of LAIA or ILAHI and any gaps between two consecutive refills less than 180 days. Second, our sensitivity analysis also examined the result of economic analysis that was based on the effectiveness parameters which were generated from the “as‐treated” scenario, where study patients who discontinued insulin therapy were censored in the analyses. Finally, the results of this study may only reflect T1D patients under a single‐payer system and universal healthcare insurance coverage.
We provided real‐world evidence that the use of LAIAs vs ILAHI has a high likelihood of being cost‐saving for patients with T1D to avoid hypoglycaemia and diabetes‐related complications from the third‐party payer and healthcare sector perspectives in Taiwan. LAIAs should be considered as an economically reasonable first‐line choice for a basal insulin regimen for the treatment of patients with T1D. We expect that the results of this study will inform clinical professionals and health policymakers when prioritizing treatment strategies for patients with T1D given limited healthcare resources.
COMPETING INTERESTS
There are no competing interests to declare.
CONTRIBUTORS
S.K. and H.T.O. conceived the concept of this study. T.Y.L. was responsible for data collection and performed the statistical analysis. C.Y.Y. contributed to statistical analyses and provided statistical consultation. T.Y.L. drafted the manuscript. T.Y.L., S.K. and H.T.O. made substantial contributions to the interpretation of data and revised the manuscript. T.Y.L. and H.T.O. are the guarantors of this work and had full access to all the data in the study.
Supporting information
Table S1. Impact inventory for components considered in the cost‐effectiveness analysis
Table S2. CHEERS checklist
Table S3. Total medication costs and breakdown of medication costs per patient
Table S4. Adjusted medical costs per patient per year for LAIA (n = 270) and ILAHI users (n = 270) during the follow‐up period
Table S5. Adjusted medical costs per patient per year during the follow‐up period (Sensitivity analysis 1: effectiveness estimates were derived from ITT analysis and cost calculation was based on ITT analysis with consideration of the occurrence of the event of interest as the censoring variable)
Table S6. Cost‐effectiveness analysis results (Sensitivity analysis 1: effectiveness estimates were derived from ITT analysis and cost calculation was based on ITT analysis with consideration of the occurrence of the event of interest as the censoring variable)
Table S7. Disaggregated results of effectiveness for cost‐effectiveness analysis (Sensitivity analysis 2: both effectiveness and cost estimates were derived from OT analysis)
Table S8. Adjusted medical cost per patient per year during follow‐up period (Sensitivity analysis 2: both effectiveness and cost estimates were derived from OT analysis)
Table S9. Cost‐effectiveness analysis results (Sensitivity analysis 2: both effectiveness and cost estimates were derived from OT analysis)
Table S10. Adjusted medical cost per patient per year during the follow‐up period (Sensitivity analysis 3: effectiveness estimates were derived from OT analysis and cost calculation was based on OT analysis with consideration of the occurrence of the event of interest as the censoring variable)
Table S11. Cost‐effectiveness analysis results (Sensitivity analysis 3: effectiveness estimates were derived from OT analysis and cost calculation was based on OT analysis with consideration of the occurrence of the event of interest as the censoring variable)
ACKNOWLEDGEMENTS
We gratefully thank National Cheng Kung University and its affiliated hospital for all support. The project was supported by Grant Number P30DK092926 (MCDTR and MCDTR Methods and Measurement Core) from the National Institute of Diabetes and Digestive and Kidney Diseases, which had no role in the design and conduct of the study, collection, management, analysis and interpretation of the data, preparation, review or approval of the manuscript, and decision to submit the manuscript for publication.
This project was funded by the Taiwan Ministry of Science and Technology (MOST 104‐2320‐B‐006‐008‐MY3). The funder had no role in the design and conduct of the study; collection, management, analysis, and interpretation of the data; preparation, review, or approval of the manuscript; and decision to submit the manuscript for publication.
Lee T‐Y, Kuo S, Yang C‐Y, Ou H‐T. Cost‐effectiveness of long‐acting insulin analogues vs intermediate/long‐acting human insulin for type 1 diabetes: A population‐based cohort followed over 10 years. Br J Clin Pharmacol. 2020;86:852–860. 10.1111/bcp.14188
Tsung‐Ying Lee and Shihchen Kuo have equal first‐authorship.
Principal investigator: The authors confirm that there is no principal investigator for this paper.
DATA AVAILABILITY STATEMENT
Research data are not shared.
REFERENCES
- 1. Intensive diabetes treatment and cardiovascular disease in patients with type 1 diabetes. The diabetes control complications trial/epidemiology of diabetes interventions complications study research group. N Engl J Med. 2005;353(25):2643‐2653. [DOI] [PMC free article] [PubMed] [Google Scholar]
- 2. Bate KL, Jerums G. 3: preventing complications of diabetes. Med J Aust. 2003;179(9):498‐503. [DOI] [PubMed] [Google Scholar]
- 3. Beckman JA, Creager MA. Vascular complications of diabetes. Circ Res. 2016;118(11):1771‐1785. [DOI] [PubMed] [Google Scholar]
- 4. Economic costs of diabetes in the U.S. in 2012. Diabetes Care. 2013;36(4):1033‐1046. [DOI] [PMC free article] [PubMed] [Google Scholar]
- 5. Jiang YD, Chang CH, Tai TY, Chen JF, Chuang LM. Incidence and prevalence rates of diabetes mellitus in Taiwan: analysis of the 2000‐2009 Nationwide health insurance database. J Formos Med Assoc. 2012;111(11):599‐604. [DOI] [PubMed] [Google Scholar]
- 6. Ou HT, Yang CY, Wang JD, Hwang JS, Wu JS. Life expectancy and lifetime health care expenditures for type 1 diabetes: a Nationwide longitudinal cohort of incident cases followed for 14 years. Value Health. 2016;19(8):976‐984. [DOI] [PubMed] [Google Scholar]
- 7. Tunceli O, Wade R, Gu T, Bouchard JR, Aagren M, Luo W. Cost of diabetes: comparison of disease‐attributable and matched cohort cost estimation methods. Curr Med Res Opin. 2010;26(8):1827‐1834. [DOI] [PubMed] [Google Scholar]
- 8. Willey VJ, Kong S, Wu B, et al. Estimating the real‐world cost of diabetes mellitus in the United States during an 8‐year period using 2 cost methodologies. Am Health Drug Benefits. 2018;11(6):310‐318. [PMC free article] [PubMed] [Google Scholar]
- 9. Bolli GB, Songini M, Trovati M, et al. Lower fasting blood glucose, glucose variability and nocturnal hypoglycaemia with glargine vs NPH basal insulin in subjects with type 1 diabetes. Nutr Metab Cardiovasc Dis 2009;19(8):571–579. [DOI] [PubMed] [Google Scholar]
- 10. Valensi P, Cosson E. Is insulin detemir able to favor a lower variability in the action of injected insulin in diabetic subjects. Diabetes Metab. 2005;31(4 Pt 2):4s34‐34s39. [DOI] [PubMed] [Google Scholar]
- 11. Kruszynska YT, Home PD, Hanning I, Alberti KG. Basal and 24‐h C‐peptide and insulin secretion rate in normal man. Diabetologia. 1987;30(1):16‐21. [DOI] [PubMed] [Google Scholar]
- 12. Owens DR. Insulin preparations with prolonged effect. Diabetes Technol Ther. 2011;13 Suppl 1:S5–14, S1. [DOI] [PubMed] [Google Scholar]
- 13. Tricco AC, Ashoor HM, Antony J, et al. Safety, effectiveness, and cost effectiveness of long acting versus intermediate acting insulin for patients with type 1 diabetes: systematic review and network meta‐analysis. BMJ. 2014;349(oct01 6):g5459. [DOI] [PMC free article] [PubMed] [Google Scholar]
- 14. Drug Formulary from National Health Insurance (NHI) in Taiwan. Available at: http://www.nhi.gov.tw/Query/query1.aspx?menu=20&menu_id=712&WD_ID=831. Accessed January 5, 2017.
- 15. Grunberger G. Insulin analogs‐are they worth it? Yes! Diabetes Care. 2014;37(6):1767‐1770. [DOI] [PubMed] [Google Scholar]
- 16. Davidson MB. Insulin analogs‐‐is there a compelling case to use them? No! Diabetes Care. 2014;37(6):1771‐1774. [DOI] [PMC free article] [PubMed] [Google Scholar]
- 17. Grima DT, Thompson MF, Sauriol L. Modelling cost effectiveness of insulin glargine for the treatment of type 1 and 2 diabetes in Canada. Pharmacoeconomics. 2007;25(3):253‐266. [DOI] [PubMed] [Google Scholar]
- 18. McEwan P, Poole CD, Tetlow T, Holmes P, Currie CJ. Evaluation of the cost‐effectiveness of insulin glargine versus NPH insulin for the treatment of type 1 diabetes in the UK. Curr Med Res Opin. 2007;23(sup1):S7‐S19.17931479 [Google Scholar]
- 19. Valentine WJ, Jendle J, Saraheimo M, Thorsteinsson B, Pollock RF, Lammert M. Evaluating the cost‐effectiveness of reduced mild hypoglycaemia in subjects with type 1 diabetes treated with insulin detemir or NPH insulin in Denmark, Sweden, Finland and the Netherlands. Diabet Med. 2012;29(3):303‐312. [DOI] [PubMed] [Google Scholar]
- 20. Valentine WJ, Aagren M, Haglund M, Ericsson A, Gschwend MH. Evaluation of the long‐term cost‐effectiveness of insulin detemir compared with neutral protamine hagedorn insulin in patients with type 1 diabetes using a basal‐bolus regimen in Sweden. Scand J Public Health. 2011;39(1):79‐87. [DOI] [PubMed] [Google Scholar]
- 21. Cameron CG, Bennett HA. Cost‐effectiveness of insulin analogues for diabetes mellitus. CMAJ. 2009;180(4):400‐407. [DOI] [PMC free article] [PubMed] [Google Scholar]
- 22. Tunis SL, Minshall ME, Conner C, et al. Cost‐effectiveness of insulin detemir compared to NPH insulin for type 1 and type 2 diabetes mellitus in the Canadian payer setting: modeling analysis. Curr Med Res Opin. 2009;25(5):1273‐1284. [DOI] [PubMed] [Google Scholar]
- 23. Dawoud D, Fenu E, Higgins B, Wonderling D, Amiel SA. Basal insulin regimens for adults with type 1 diabetes mellitus: a cost‐utility analysis. Value Health. 2017;20(10):1279‐1287. [DOI] [PubMed] [Google Scholar]
- 24. Pfohl M, Schadlich PK, Dippel FW, Koltermann KC. Health economic evaluation of insulin glargine vs NPH insulin in intensified conventional therapy for type 1 diabetes in Germany. J Med Econ. 2012;15(Sup2):14‐27. [DOI] [PubMed] [Google Scholar]
- 25. Gschwend MH, Aagren M, Valentine WJ. Cost‐effectiveness of insulin detemir compared with neutral protamine Hagedorn insulin in patients with type 1 diabetes using a basal‐bolus regimen in five European countries. J Med Econ. 2009;12(2):114‐123. [DOI] [PubMed] [Google Scholar]
- 26. Breckenridge AM, Breckenridge RA, Peck CC. Report on the current status of the use of real‐world data (RWD) and real‐world evidence (RWE) in drug development and regulation. Br J Clin Pharmacol. 2019;85(9):1874‐1877. [DOI] [PMC free article] [PubMed] [Google Scholar]
- 27. Seong JM, Yee J, Gwak HS. Dipeptidyl peptidase‐4 inhibitors lower the risk of autoimmune disease in patients with type 2 diabetes mellitus: a nationwide population‐based cohort study. Br J Clin Pharmacol. 2019;85(8):1719‐1727. [DOI] [PMC free article] [PubMed] [Google Scholar]
- 28. Adimadhyam S, Schumock GT, Calip GS, Smith Marsh DE, Layden BT, Lee TA. Increased risk of mycotic infections associated with sodium‐glucose co‐transporter 2 inhibitors: a prescription sequence symmetry analysis. Br J Clin Pharmacol. 2019;85(1):160‐168. [DOI] [PMC free article] [PubMed] [Google Scholar]
- 29. Ou HT, Lee TY, Du YF, Li CY. Comparative risks of diabetes‐related complications of basal insulins: a longitudinal population‐based cohort of type 1 diabetes 1999‐2013 in Taiwan. Br J Clin Pharmacol. 2018;84(2):379‐391. [DOI] [PMC free article] [PubMed] [Google Scholar]
- 30. Driessen JH, de Vries F, van Onzenoort H, et al. The use of incretins and fractures – a meta‐analysis on population‐based real life data. Br J Clin Pharmacol. 2017;83(4):923‐926. [DOI] [PMC free article] [PubMed] [Google Scholar]
- 31. Cheng TM. Taiwan's new national health insurance program: genesis and experience so far. Health Aff (Millwood). 2003;22(3):61‐76. [DOI] [PubMed] [Google Scholar]
- 32. National Health Insurance Administration . NHIA Organization. 2016; Available at: http://www.nhi.gov.tw/English/webdata/webdata.aspx?menu=11&menu_id=290&WD_ID=290&webdata_id=4916.
- 33. Ou HT, Lee TY, Li CY, Wu JS, Sun ZJ. Incidence of diabetes‐related complications in Chinese patients with type 1 diabetes: a population‐based longitudinal cohort study in Taiwan. BMJ Open. 2017;7(6):e015117. [DOI] [PMC free article] [PubMed] [Google Scholar]
- 34. Neumann PJ, Sanders GD, Russell LB, Siegel JE, Ganiats TG. Cost‐effectiveness in health and medicine. Oxford: Oxford University Press; 2016. [Google Scholar]
- 35. Suissa D, Brassard P, Smiechowski B, Suissa S. Number needed to treat is incorrect without proper time‐related considerations. J Clin Epidemiol. 2012;65(1):42‐46. [DOI] [PubMed] [Google Scholar]
- 36. Bender R. Calculating confidence intervals for the number needed to treat. Control Clin Trials. 2001;22(2):102‐110. [DOI] [PubMed] [Google Scholar]
- 37. Wen CP, Tsai SP, Chung WS. A 10‐year experience with universal health insurance in Taiwan: measuring changes in health and health disparity. Ann Intern Med. 2008;148(4):258‐267. [DOI] [PubMed] [Google Scholar]
- 38. Wu CL, Yang YC, Huang LM, Chen KT. Cost‐effectiveness of childhood rotavirus vaccination in Taiwan. Vaccine. 2009;27(10):1492‐1499. [DOI] [PubMed] [Google Scholar]
- 39. van Asselt AD, van Mastrigt GA, Dirksen CD, Arntz A, Severens JL, Kessels AG. How to deal with cost differences at baseline. Pharmacoeconomics. 2009;27(6):519‐528. [DOI] [PubMed] [Google Scholar]
- 40. Garg V, Shen X, Cheng Y, Nawarskas JJ, Raisch DW. Use of number needed to treat in cost‐effectiveness analyses. Ann Pharmacother. 2013;47(3):380‐387. [DOI] [PubMed] [Google Scholar]
- 41. Within‐trial cost‐effectiveness of lifestyle intervention or metformin for the primary prevention of type 2 diabetes. Diabetes Care. 2003;26(9):2518‐2523. [DOI] [PMC free article] [PubMed] [Google Scholar]
- 42. Teutsch S. The cost‐effectiveness of preventing diabetes. Diabetes Care. 2003;26(9):2693‐2694. [DOI] [PubMed] [Google Scholar]
- 43. Afonso M, Ryan F, Pitcher A, Lew E. Evaluating drug cost per responder and number needed to treat associated with lixisenatide on top of glargine when compared to rapid‐acting insulin intensification regimens on top of glargine, in patients with type 2 diabetes in the UK, Italy, and Spain. J Med Econ. 2017;20(6):633‐639. [DOI] [PubMed] [Google Scholar]
- 44. Jiao FF, Fung CSC, Wan EYF, et al. Five‐year cost‐effectiveness of the multidisciplinary risk assessment and management programme‐diabetes mellitus (RAMP‐DM). Diabetes Care. 2018;41(2):250‐257. [DOI] [PubMed] [Google Scholar]
- 45. Anderson D, Lehmann J, Ecker T, Vosgerau S, Donatz V. Cost effectiveness of GnRH antagonists in patients with prostate cancer and cardiovascular risk: comparative analysis against Leuprorelin by the number needed to treat. Urologe. 2017;56(7):917‐924. [DOI] [PubMed] [Google Scholar]
- 46. Massoudi M, Balk M, Yang H, et al. Number needed to treat and associated incremental costs of treatment with enzalutamide versus abiraterone acetate plus prednisone in chemotherapy‐naive patients with metastatic castration‐resistant prostate cancer. J Med Econ. 2017;20(2):121‐128. [DOI] [PubMed] [Google Scholar]
- 47. Fairman KA, Davis LE, Kruse CR, Sclar DA. Financial impact of direct‐acting oral anticoagulants in Medicaid: budgetary assessment based on number needed to treat. Appl Health Econ Health Policy. 2017;15(2):203‐214. [DOI] [PubMed] [Google Scholar]
- 48. Armstrong AW, Betts KA, Signorovitch JE, et al. Number needed to treat and costs per responder among biologic treatments for moderate‐to‐severe psoriasis: a network meta‐analysis. Curr Med Res Opin. 2018;34(7):1325‐1333. [DOI] [PubMed] [Google Scholar]
- 49. Imafuku S, Nakano A, Dakeshita H, Li J, Betts KA, Guerin A. Number needed to treat and costs per responder among biologic treatments for moderate‐to‐severe plaque psoriasis in Japan. J Dermatolog Treat. 2018;29(1):24‐31. [DOI] [PubMed] [Google Scholar]
- 50. Benucci M, Ravasio R, Damiani A. Mean cost per number needed to treat with tocilizumab plus methotrexate versus abatacept plus methotrexate in the treatment of rheumatoid arthritis in patients previously treated with methotrexate. Clinicoecon Outcomes Res. 2017;9:403‐410. [DOI] [PMC free article] [PubMed] [Google Scholar]
- 51. Glick HA, Briggs AH, Polsky D. Quantifying stochastic uncertainty and presenting results of cost‐effectiveness analyses. Expert Rev Pharmacoecon Outcomes Res. 2001;1(1):25‐36. [DOI] [PubMed] [Google Scholar]
- 52. Fenwick E, O'Brien BJ, Briggs A. Cost‐effectiveness acceptability curves‐‐facts, fallacies and frequently asked questions. Health Econ. 2004;13(5):405‐415. [DOI] [PubMed] [Google Scholar]
- 53. The world health report 2002 – Reducing Risks, Promoting Healthy Life. Geneva: World Health Organization; 2002. [DOI] [PubMed] [Google Scholar]
- 54. National Statistics . Statistical Tables. Available at: http://eng.stat.gov.tw/ct.asp?xItem=37408&CtNode=5347&mp=5. .
- 55. Kostev K, Dippel FW, Bierwirth R. Resource consumption and costs of treatment in patients with type 1 diabetes under intensified conventional therapy under German real‐life conditions. J Diabetes Sci Technol. 2013;7(3):736‐742. [DOI] [PMC free article] [PubMed] [Google Scholar]
- 56. Kristiansen IS, Gyrd‐Hansen D. Cost‐effectiveness analysis based on the number‐needed‐to‐treat: common sense or non‐sense? Health Econ. 2004;13(1):9‐19. [DOI] [PubMed] [Google Scholar]
- 57. Brookhart MA, Wyss R, Layton JB, Sturmer T. Propensity score methods for confounding control in nonexperimental research. Circ Cardiovasc Qual Outcomes. 2013;6(5):604‐611. [DOI] [PMC free article] [PubMed] [Google Scholar]
- 58. Austin PC. An Introduction to propensity score methods for reducing the effects of confounding in observational studies. Multivar Behav Res. 2011;46(3):399‐424. [DOI] [PMC free article] [PubMed] [Google Scholar]
Associated Data
This section collects any data citations, data availability statements, or supplementary materials included in this article.
Supplementary Materials
Table S1. Impact inventory for components considered in the cost‐effectiveness analysis
Table S2. CHEERS checklist
Table S3. Total medication costs and breakdown of medication costs per patient
Table S4. Adjusted medical costs per patient per year for LAIA (n = 270) and ILAHI users (n = 270) during the follow‐up period
Table S5. Adjusted medical costs per patient per year during the follow‐up period (Sensitivity analysis 1: effectiveness estimates were derived from ITT analysis and cost calculation was based on ITT analysis with consideration of the occurrence of the event of interest as the censoring variable)
Table S6. Cost‐effectiveness analysis results (Sensitivity analysis 1: effectiveness estimates were derived from ITT analysis and cost calculation was based on ITT analysis with consideration of the occurrence of the event of interest as the censoring variable)
Table S7. Disaggregated results of effectiveness for cost‐effectiveness analysis (Sensitivity analysis 2: both effectiveness and cost estimates were derived from OT analysis)
Table S8. Adjusted medical cost per patient per year during follow‐up period (Sensitivity analysis 2: both effectiveness and cost estimates were derived from OT analysis)
Table S9. Cost‐effectiveness analysis results (Sensitivity analysis 2: both effectiveness and cost estimates were derived from OT analysis)
Table S10. Adjusted medical cost per patient per year during the follow‐up period (Sensitivity analysis 3: effectiveness estimates were derived from OT analysis and cost calculation was based on OT analysis with consideration of the occurrence of the event of interest as the censoring variable)
Table S11. Cost‐effectiveness analysis results (Sensitivity analysis 3: effectiveness estimates were derived from OT analysis and cost calculation was based on OT analysis with consideration of the occurrence of the event of interest as the censoring variable)
Data Availability Statement
Research data are not shared.