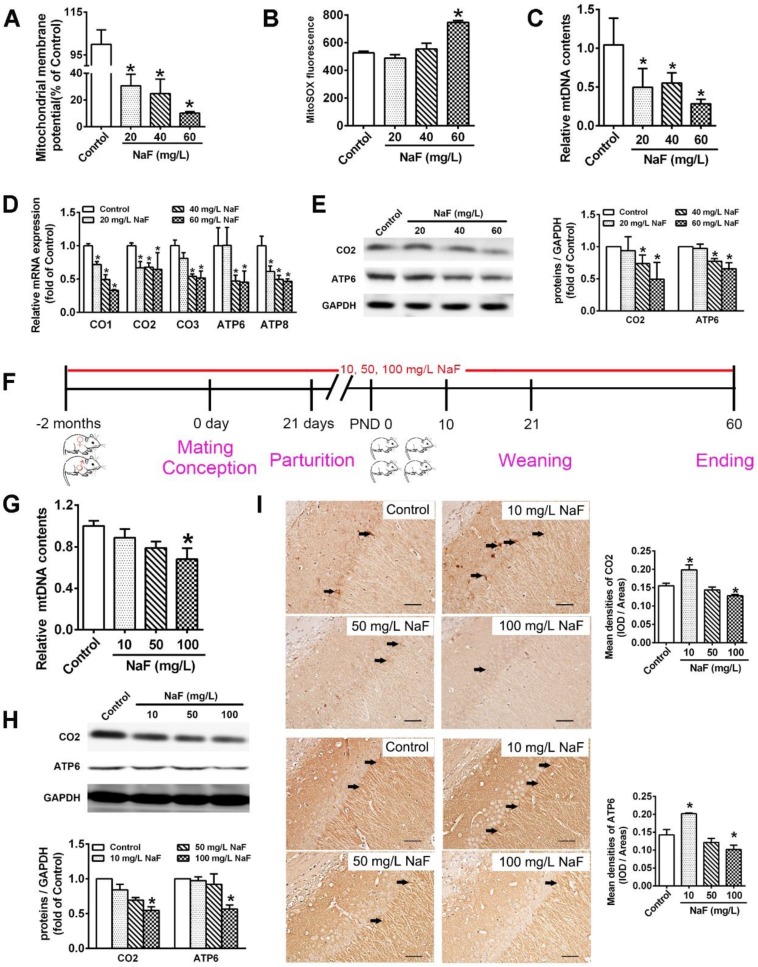
Figure 1.
NaF causes mitochondrial dysfunction and mitochondrial biogenesis impairment in vitro and in vivo. (A, B) MMP levels (A) and mitoROS production (B) in SH-SY5Y cells determined by flow cytometry. (C, D) RT-qPCR analyses of relative mtDNA contents (C) and representative mtDNA-encoded genes including CO1, CO2, CO3, ATP6, ATP8 (D) in SH-SY5Y cells. Quantification represents the levels of the indicated ND4 and mRNA normalized to GAPDH. (E) Immunoblot analyses of CO2 and ATP6 in SH-SY5Y cells. Quantification represents the levels of the indicated protein normalized to GAPDH. (F) Experimental designs of a cohort of offspring rats subjected to NaF treatments with different concentrations. (G) RT-qPCR analyses of relative mtDNA contents in hippocampal tissues (n = 6 rats per group). (H) Immunoblot analyses of CO2 and ATP6 in hippocampal tissues (n = 3 rats per group). (I) Representative images of the IHC staining for CO2-expressing (CO2+) and ATP6-expressing (ATP6+) neurons in hippocampal CA1 region. CO2+ and ATP6+ neuronal cells are demonstrated by black arrows and quantified. Scale bars represent 50 μm, n = 2 rats per group. SH-SY5Y cells were treated with different concentrations of NaF (20, 40 and 60 mg/L). Offspring SD rats were developmentally exposed to NaF (10, 50 and 100 mg/L) from pre-pregnancy until 2 months of delivery. Data information: Data are presented as mean ± SD. Data were cumulative of at least three independent experiments (A-E). * P < 0.05 is considered significant compared with Control by one-way ANOVA test.

