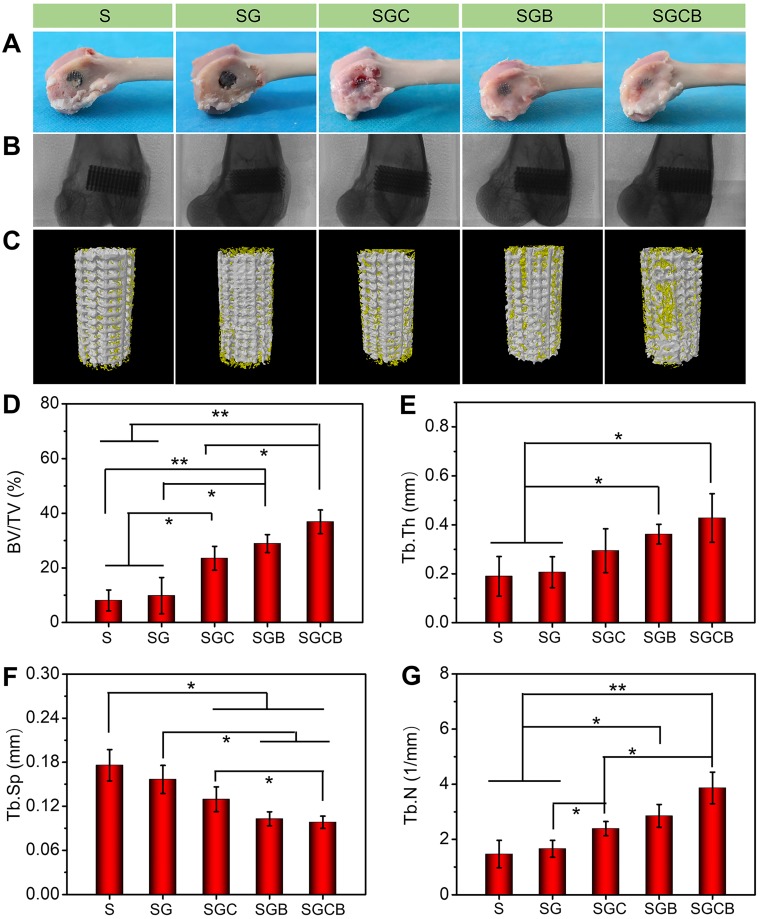
Figure 5.
(A) Visual appearance and (B) radiographic images of the distal femurs; (C) 3D reconstruction images of ROI (bone was yellow and scaffolds were white); Quantitative analysis of (D) BV/TV, (E) Tb.Th, (F) Tb.Sp, and (G) Tb.N of the S, SG, SGC, SGB, and SGCB groups derived from micro-CT (*p < 0.05, **p < 0.01).

