

Abstract
Background
Human epidermal growth factor receptor (EGFR) is an oncogenic gene and one of top targets of precision therapy in lung cancer with EGFR mutations. Although there are many reports for some individual cancers, comprehensive profiling of EGFR mutations, overexpression, amplification, DNA methylation, and their clinical associations across many different cancers simultaneously was not available. This study aimed to fill the gap and provide insights to the alteration spectrum of EGFR and its therapeutic and prognostic implications.
Methods
The Cancer Genome Atlas (TCGA) datasets for 32 cancer types involving 11,314 patients were analyzed for alterations (mutations and amplification/deletion), abnormal expression and DNA methylation in EGFR gene. Mutation frequency, genomic location distribution, functional impact, and clinical targeted therapy implication were compared among different cancer types, and their associations with patient survival were analyzed.
Results
EGFR alteration frequency, mutation sites across functional domains, amplification, overexpression, and DNA methylation patterns differed greatly among different cancer types. The overall mutation frequency in all cancers combined was relatively low. Targetable mutations, mainly in lung cancer, were primarily found in the Pkinase_Tyr domain. Glioblastoma multiforme had the highest rate of alterations, but it was dominated by gene amplification and most mutations were in the Furin‐like domain where targeted therapy was less effective. Low‐grade glioma often had gene amplification and increased EGFR expression which was associated with poor outcome. Colon and pancreatic adenocarcinoma had very few EGFR mutations; however, high EGFR expression was significantly associated with short patient survival. Squamous cell carcinoma regardless of their sites (the head and neck, lung, or esophagus) exhibited similar characteristics with an alteration frequency of about 5.0%, was dominated by gene amplification, and had increased EGFR expression generally associated with short patient survival. DNA methylation was highly associated with EGFR expression and patient outcomes in some cancers.
Conclusions
EGFR aberration type, frequency, distribution in functional domains, and expression vary from cancer to cancer. While mutations in the Pkinase_Tyr domain are more important for treatment selection, increased expression from amplification or deregulation affects more tumor types and leads to worse outcome, which calls for new treatment strategies for these EGFR‐driven tumors.
Keywords: EGFR expression, EGFR mutation, epidermal growth factor receptor, pan‐cancer profiling, patient survival, targeted therapy, The Cancer Genome Atlas (TCGA)
Abbreviations
- aa
amino acid
- ACC
adrenocortical carcinoma
- ACMG
American College of Medical Genetics and Genomics
- AML
acute myeloid lymphoma
- BLCA
bladder urothelial carcinoma
- BRCA
breast invasive carcinoma
- CCLE
Cancer Cell Line Encyclopedia
- CESC
cervical squamous cell carcinoma and endocervical adenocarcinoma
- CHOL
cholangiocarcinoma
- CNV
copy number variant
- COAD
colon adenocarcinoma
- DFS
disease‐free survival
- DLBC
lymphoid neoplasm diffuse large B‐cell lymphoma
- EGFR
epidermal growth factor receptor
- ESCA
esophageal carcinoma
- FDA
Food and Drug Administration
- GBM
glioblastoma multiforme
- GDC
Genomic Data Commons
- GTEx
Genotype‐Tissue Expression
- HNSC
head and neck squamous cell carcinoma
- ICGC
the International Cancer Genome Consortium
- Indel
insertion/deletion
- KICH
kidney chromophobe
- KIRC
kidney renal clear cell carcinoma
- KIRP
kidney renal papillary cell carcinoma
- LGG
brain lower grade glioma
- LIHC
liver hepatocellular carcinoma
- LUAD
lung adenocarcinoma
- LUSC
lung squamous cell carcinoma
- MAPK
mitogen‐activated protein kinase
- MESO
mesothelioma
- NSCLC
non‐small‐ cell lung cancer
- OS
overall survival
- OV
ovarian serous cystadenocarcinoma
- PAAD
pancreatic adenocarcinoma
- PCPG
pheochromocytoma and paraganglioma
- PI3K
phosphoinositide 3‐kinase
- PKB
protein kinase B
- PRAD
prostate adenocarcinoma
- RAF
rapidly accelerated fibrosarcoma
- RAS
rat sarcoma
- RTK
receptor tyrosine kinases
- SARC
sarcoma
- SKCM
skin cutaneous melanoma
- SNV
single nucleotide variant
- STAD
stomach adenocarcinoma
- TCGA
The Cancer Genome Atlas
- TGCT
testicular germ cell tumors
- THCA
thyroid carcinoma
- THYM
thymoma
- TKIs
tyrosine‐kinase inhibitors
- TPM
transcripts per million
- UCEC
uterine corpus endometrial carcinoma
- UCS
uterine carcinosarcoma
- UVM
uveal melanoma
1. BACKGROUND
The human epidermal growth factor receptor (EGFR) family, also known as the HER family of receptor tyrosine kinases (RTK), consists of four members—EGFR, ERBB2, ERBB3, and ERBB4 [1, 2]. Five functional domains are characterized for EGFR according to the database of protein families (Pfam, http://pfam.xfam.org/protein/P00533): Recep_L (57‐168aa), Furin‐like (177‐338aa), Recep_L (361‐481aa), GF_recep_IV (505‐637aa), and Pkinase_Tyr domains (712‐968aa). The Recep_L domains contain ligand binding sites; the Furin‐like domain is a cysteine rich region involved in signal transduction and receptor aggregation; the GF_recep_IV domain regulates the binding of a ligand to the Recep_L domains; and the Pkinase_Tyr domain performs the phosphorylation function [3].
Upon stimulation by its ligands, dimerization (both homodimerization and heterodimerization) of EGFR results in its intracellular tyrosine kinase activation and autophosphorylation at multiple tyrosine residues, which activates a number of downstream signaling cascades that not only promote proliferation, growth, and survival of normal cells but also contribute to processes that are crucial to cancer progression, including angiogenesis, metastasis, and apoptosis [4, 5]. The best known involved pathways include the rat sarcoma (Ras)/mitogen‐activated protein kinase (MAPK) and phosphoinositide 3‐kinase (PI3K)/protein kinase B (PKB) signaling pathways, whose roles in promoting tumor growth, survival, and progression are well characterized [6].
EGFR is one of the first few identified oncogenes and is a key treatment target in clinical oncology [7, 8, 9, 10]. It is frequently activated by gene mutation, amplification, or overexpression through abnormal regulation in human cancers. Among EGFR‐associated cancers, pancreatic adenocarcinoma (PAAD) has an extremely poor prognosis, which usually results in death within several months after diagnosis [11, 12]. In cancers like non‐small‐cell lung cancer (NSCLC) [13] and colon adenocarcinoma (COAD) [14], EGFR mutation status is considered as a poor prognostic factor, which is often associated with a more aggressive behavior and decreased patient survival.
Because of the critical roles of EGFR in cancers, various treatment strategies, including tyrosine kinase inhibitors (TKIs, small‐molecule inhibitors, which bind to the ligand‐binding site on the extracellular domain) [15], antibody‐based therapy [16], immunotherapy [17], and preclinical trials of RNA interference therapies [18], have been developed to inhibit its activities and thus control tumor growth and progression. When the ligand binding with EGFR is prevented by monoclonal antibodies or TKIs, it dampens signal transduction through pathways such as the RAS/rapidly accelerated fibrosarcoma (RAF)/MAPK and PI3K/PKB cascades [2, 19]. Such treatments are very effective and provide significantly improved patient outcomes, particularly for lung adenocarcinoma (LUAD) patients with EGFR mutations [20, 21]. However, successful applications of TKIs to other cancers are less certain [22]. Although many literature reports are available on EGFR mutation, overexpression, or amplification for particular cancer types [12, 13, 14, 23, 24], a simultaneous comprehensive profiling over multiple cancer types to explore their similarity and difference is not available. Such information is important to understand what other cancers are more likely to benefit from such targeted therapy and what role EGFR plays among different cancers.
Taking advantage of the large datasets from The Cancer Genome Atlas (TCGA), we systematically profiled the mutation, copy number, expression, and DNA methylation patterns of EGFR across 32 cancer types. We first examined the patterns of EGFR mutations, including single nucleotide variant (SNV) and short insertion/deletion (indel), across tumors and their implications for targeted therapies. Copy number variants (CNVs) and their impact on gene expression and clinical outcomes were investigated next. For cancers without gene amplification, we further looked into gene expression patterns, their association with clinical outcomes, contribution of DNA methylation to gene abnormal expression, and impact of DNA methylation on patient overall survival (OS).
2. DATA SOURCES AND METHODS
2.1. EGFR mutation and CNV data from TCGA provisional dataset
Mutation data from whole exome sequencing, CNVs from GISTIC for EGFR gene, and clinical data were downloaded and formatted from the cBioportal (https://www.cbioportal.org/), a web resource for exploring, visualizing, and analyzing multidimensional cancer genomics databases, such as TCGA [25], the International Cancer Genome Consortium (ICGC) [26], Cancer Cell Line Encyclopedia (CCLE) [27]. We selected the more inclusive TCGA provisional cohort, which was retrieved on Feb 26th, 2019 consisting of 11,314 patients with 11,410 samples across 32 histopathologic cancer types and representing most major classes of human adult cancers [28, 29]. The mutation data included SNVs, indels, and CNVs (defined by GISTIC 2.0 as following for log ratio value: ‐2/‐1 = deletion; 0 = diploid; 1 = gain; 2 = amplification).
2.2. EGFR expression and methylation data in normal and cancer tissues
EGFR expression in normal tissues was examined in RNA sequencing (RNA‐seq) data from The Genotype‐Tissue Expression (GTEx) (https://www.gtexportal.org/home/), which consisted of 11,688 samples from 53 tissue types/organs. Transcripts per million (TPM) was used to compare the relative expression levels of EGFR from different organs or sub‐locations of an organ. Expression and DNA methylation data in tumors and their paired normal samples were obtained from TCGA Genomic Data Commons (GDC) portal (https://portal.gdc.cancer.gov/), which included data for 32 cancer types. The expression data was pre‐processed and normalized using upper quartile of 1000. The genome‐wide profile of human DNA methylation was generated using Infinium Human Methylation 450K BeadChip (Illumina, San Diego, CA, USA).
2.3. Data analysis
For differential expression of EGFR between tumors and their paired normal samples in each cancer type, the expression data was log2 transformed, and two‐group t test was performed for those tumor types with at least two normal samples (22 out of 32 tumor types). The log2 fold change and significant P value (minus log10) were plotted by using the Volcano plot for each cancer type. As TCGA had a limited number of paired normal samples or not at all for several tumor types, we further examined the differential expression data from Gene Expression Profiling Interactive Analysis (GEPIA, http://gepia.cancer-pku.cn/index.html) [30], a web server for exploring and analyzing RNA‐seq data of 9736 tumor samples and 8,587 normal samples from TCGA and the GTEx projects using a uniform processing pipeline and normalization method.
OS and disease‐free survival (DFS), defined as the duration from diagnosis to death or recurrence, were analyzed using the Kaplan‐Meier method. The hazard ratio and 95% confidence intervals were plotted by R package ‘forestplot’. Each CpG's methylation correlation with EGFR expression was analyzed using Pearson correlation. The prognostic values of EGFR alterations and its CpG methylation were analyzed with Cox proportional hazard model.
All data analyses were conducted using the R package, version 3.5.3 (https://www.r-project.org/) unless specifically stated.
3. RESULTS
3.1. EGFR somatic mutation patterns across tumor types
The overall EGFR mutation frequency was 2.8% (320/11,410) for all tumor samples and 2.4% (268/11,314) for all patients across the 32 tumor types. The most common tumors with EGFR mutations were glioblastoma multiforme (GBM, 26.8%), LUAD (14.4%), diffuse large B‐cell lymphoma (DLBC, 8.3%), and skin cutaneous melanoma (SKCM, 6.5%). On the contrary, kidney chromophobe cell carcinoma (KICH), mesothelioma (MESO), pheochromocytoma and paraganglioma (PCPG), thymoma (THYM), thyroid carcinoma (THCA), uterine carcinosarcoma (UCS), and uveal melanoma (UVM) showed almost no EGFR mutations (Figure 1A). The total number of samples for each cancer type varied from 48 (DLBC) to 1105 (breast invasive carcinoma [BRCA]), and those with too few samples might not reflect the complete picture of EGFR mutation status (Supplementary Table S1).
FIGURE 1.

EGFR mutation distribution in different cancer types and protein functional domains. A EGFR mutation frequency in 32 TCGA provisional cancer types. B EGFR mutations in different functional domains in all and top 7 cancer types. C EGFR mutation distribution over different functional domains of EGFR for all cancers together. D EGFR mutation distribution over different functional domains of EGFR in GBM. E EGFR mutation distribution over different functional domains of EGFR in LUAD. Abbreviations: aa: amino acid; ACC: adrenocortical carcinoma; AML: acute myeloid lymphoma; BLCA: bladder urothelial carcinoma; BRCA: breast invasive carcinoma; CESC: cervical squamous cell carcinoma and endocervical adenocarcinoma; CHOL: cholangiocarcinoma; COAD: colon adenocarcinoma; DLBC: lymphoid neoplasm diffuse large B‐cell lymphoma; EGFR: epidermal growth factor receptor; ESCA: esophageal carcinoma; GBM: glioblastoma multiforme; HNSC: head and neck squamous cell carcinoma; KICH: kidney chromophobe; KIRC: kidney renal clear cell carcinoma; KIRP: kidney renal papillary cell carcinoma; LGG: brain lower‐grade glioma; LIHC: liver hepatocellular carcinoma LUAD: lung adenocarcinoma; LUSC: lung squamous cell carcinoma; MESO: mesothelioma; OV: ovarian serous cystadenocarcinoma; PAAD: pancreatic adenocarcinoma; PCPG: pheochromocytoma and paraganglioma; PRAD: prostate adenocarcinoma; SARC: sarcoma; SKCM: skin cutaneous melanoma; STAD: stomach adenocarcinoma; TCGA: The Cancer Genome Atlas; TGCT: testicular germ cell tumors; THCA: thyroid carcinoma; THYM: thymoma; UCEC: uterine corpus endometrial carcinoma; UCS: uterine carcinosarcoma; UVM: uveal melanoma
The 320 EGFR somatic mutations (from 268 tumor samples) were observed across all cancer types and were widely distributed along different functional domains of EGFR gene. The most common ones were the Pkinase_Tyr domain (88 samples) and the Furin‐like domain (85 samples), followed by the GF_recep_IV domain (45 samples). The location distribution of these EGFR mutations was dramatically different among different cancers (Figure 1B, Supplementary Table S2). Mutations in GBM and brain lower‐grade glioma (LGG) were most commonly located in the Furin‐like domain, about 5 times more than the mutations located in the Pkinase_Tyr domain. On the contrary, mutations in NSCLC were primarily in the Pkinase_Tyr domain, especially for LUAD, which amounted to four fifths of all mutations. Mutations in stomach adenocarcinoma (STAD), head and neck squamous cell carcinoma (HNSC), and SKCM were mostly in other domains whose functions were less known.
From functional impact on protein coding, these 320 EGFR mutations were classified into three categories: missense (280 mutations), truncating (21 mutations), and in‐frame insertion/deletions (19 mutations) (Figure 1C). The 289aa in the Furin‐like domain was the most frequently mutated position, which was observed in 27 samples (3 samples with A289D, 1 with A289I, 1 with A289N, 6 with A289T, 15 with A289V, and 1 with A289Rfs*9). The mutations at this position almost exclusively occurred in GBM samples (25/27) (Figure 1D). A289V is known to be oncogenic, while other mutation types (A289D/T/N/I) are likely oncogenic. None of these mutations are known to be targetable. The only other tumor with mutations at this position was HNSC (1 sample with A289T and 1 with A289Rfs*9), and their importance was little known to this cancer. The second most mutated position was 598aa in the GF_recep_IV domain: 16 GBMs had G598V, 2 GBMs had G598A, and 1 esophageal squamous cell carcinoma (ESCC) had G598E. These mutations might affect ligand‐receptor binding and are likely oncogenic. Most mutations in LUAD (35 of 45 mutations) were located in the Pkinase_Tyr domain, especially at the positions of 858aa (8 samples with L858R) and 746‐750aa (6 with E746_A750del, 2 with L747_E749del, and 1 with L747_T751del) (Figure 1E).
Each somatic gene mutation can be classified by their oncogenic effect and predictive significance [31]. As shown in Figure 2, 83 (25.9%) EGFR mutations were oncogenic, 34 (10.6%) likely oncogenic, 27 (8.4%) predicted oncogenic, 5 (1.6%) likely neutral, 3 (0.9%) inconclusive, and 168 (52.5%) unknown. Over half of them were in the unknown class, highlighting the challenge in mutation interpretation.
FIGURE 2.
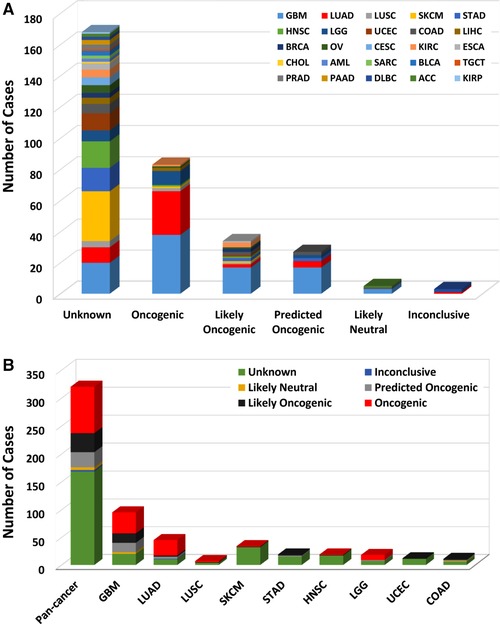
EGFR mutation classification by functional impacts. A EGFR mutations by functional impact on all tumors combined. B Functional impact class distribution of EGFR mutations for all cancer types together and for top 9 cancer types. According to the guideline of the American College of Medical Genetics and Genomics (ACMG), gene mutations are divided into 6 groups: oncogenic, likely oncogenic, predicted oncogenic, likely neutral, inconclusive, and unknown. Abbreviations as in Figure 1
According to clinical targeted therapy implication [32], the 320 EGFR mutations could be divided into 7 levels (Supplementary Table S1): Level 1 (30 mutations), Level 2B (5 mutations), Level 3A (1 mutation), Level 3B (5 mutations), Level 4 (33 mutations), Level NA (244 mutations), and Level R1 (2 mutations). Only Level 1 and Level R1 mutations were indicated for or against targeted therapy currently with a Food and Drug Administration (FDA)‐approved drug [33]. All Level 1 mutations were found in NSCLC (28 in LUAD and 2 in lung squamous cell carcinoma [LUSC]), and these mutations were concentrated in exons 19‐21, which included L858R, L861Q, G719A, S768I, L833F, E796_A750del, L747_E749del, E709_T710delinsD, L747_T751del, and T751_E758del (Figure 3). LUAD harbored the highest proportion of oncogenic/likely oncogenic mutations (66.7%), and almost all were Level 1 mutations (28 of 30 mutations). Although the oncogenic/likely oncogenic mutations accounted for 57.9% and 50.0% of GBM and LGG samples, respectively, most of them were in Level 4 and Level NA without treatment implications.
FIGURE 3.

EGFR mutation distribution by targeted treatment implications as annotated in OncoKB among all tumor types and top cancer types. A EGFR mutation distribution of OncoKB therapeutic levels of evidence in all TCGA provisional cancer types. B EGFR mutation distribution of OncoKB therapeutic levels in top 10 cancer types. OncoKB therapeutic levels: “Level 1: Food and Drug Administration (FDA)‐recognized biomarker predictive of response to an FDA‐approved drug in this indication; Level 2B: Standard care biomarker predictive of response to an FDA‐approved drug in another indication, but not standard care for this indication; Level 3A: Compelling clinical evidence supports the biomarker as being predictive of response to a drug in this indication; Level 3B: Compelling clinical evidence supports the biomarker as being predictive of response to a drug in another indication; Level 4: Compelling biological evidence supports the biomarker as being predictive of response to a drug; Level R1: Standard care biomarker predictive of resistance to an FDA‐approved drug in this indication” [32]. Abbreviations as in Figure 1
3.2. EGFR CNVs in different tumor types
The overall EGFR CNV frequency was about 5.0% (detected in 569 of 11,410 samples). Almost all were amplification (in 549 of 569 samples), only 20 samples with deletion (Figure 4A). The most common solid tumors with EGFR CNVs were GBM (43.9%), ESCA (14.1%), HNSC (10.9%), LUSC (7.6%), and LGG (7.4%). DLBC, kidney renal clear cell carcinoma (KIRC), MESO, THCA, THYM, UCS, and UVM were not affected with any CNV (Figure 4A). Among the 320 samples with EGFR mutations described above, 213 also had EGFR CNV changes (Figure 4B, Supplementary Table S1), of which 108 with amplification, 101 with gain, and 4 with deletion. GBM and LUAD were two cancer types with the highest numbers of amplification or gain (Figure 4B).
FIGURE 4.

EGFR CNV distribution across all and selected top cancer types. A EGFR CNV frequency in 32 TCGA provisional cancer types. B EGFR CNV distribution in top 9 cancer types for the cases with EGFR mutations. Abbreviations: CNV: copy number variant; other abbreviations as in Figure 1. CNV is defined by GISTIC 2.0 as following: ‐2/‐1 = deletion; 0 = diploid; 1 = gain; 2 = amplification
3.3. Combined EGFR alterations (mutation and CNV) in different cancer types
The combined EGFR mutation and CNV frequency in all tumors was about 7.0% (746 of 11,314 patients, 748 of 11,410 samples). However, the frequency among different cancers was dramatically different (Figure 5A). While KICH, MESO, THCA, THYM, USS, and UVM had neither EGFR mutation nor EGFR CNV, 273 of 591 (46.2%) GBM cases had CNV (33.2%), mutation (3.4%), or both (9.6%). Other cancers with dominantEGFR amplification but at much lower amplification rate included ESCA (13.0%), HNSC (9.4%), STAD (5.2%), LGG (5.4%), LUSC (6.4%), and BLCA (4.4%). Mutation was more common in DLBC (8.3% vs. 0.0%) and SKCM (5.2% vs. 0.2%). Although EGFR alteration frequencies of two lung cancer subtypes (LUAD and LUSC) were similar, the mutation frequency was slightly higher than that of amplification in LUAD (4.7% vs. 3.7%), while amplification was much more common than mutation in LUSC (6.4% vs. 0.6%).
FIGURE 5.

Combined EGFR alteration frequencies and their relationship. A Combined EGFR alteration (mutations and CNVs) frequency in 32 TCGA cancer types. B The relationship of EGFR mutation types and CNV types. C The distribution of CNV types along with mutations located in different domains. EGFR functional domains: Recep_L (57‐168aa), Furin‐like (177‐338aa), Recep_L (361‐481aa), GF_recep_IV (505‐637aa), and Pkinase_Tyr domains (712‐968aa). Abbreviations are the same as in Figure 1
Mutation location and CNV occurrence appeared to be associated. Over half of the mutations (47 of 82 mutations) in the Furin‐like domain were accompanied by EGFR amplification, while nearly half of mutations (40 of 85 mutations) in the Pkinase_Tyr domain had copy gain. Mutations in the Recep_L domains and other function‐unknown domains rarely had concurrent CNVs (Figure 5B).
3.4. EGFR alterations and patient survival
In order to evaluate the clinical significance of EGFR alterations, we analyzed patient survival for pan‐cancer and for each cancer type separately by alteration status (mutations and CNVs alone or in combination). When all tumors were analyzed together, patients with any EGFR alteration had significantly shorter median OS and DFS than those without EGFR alteration (both P < 0.001, Supplementary Figure S1). When analysis was performed for CNV and mutation separately, the presence of either aberration was associated with shortened patients’ OS and DFS (all P < 0.001, Supplementary Figure S2 and S3).
For survival association in individual cancer types, only those cancer types with at least 10 tumor samples containing either EGFR mutations or CNVs were included in the analysis. Among patients with HNSC, LGG, or LUAD, EGFR amplification was associated with short survival (Figure 6A). However, EGFR somatic SNV/indel mutations appeared not affecting patient survival although only 5 cancer types with at least 10 samples containing EGFR mutations could be analyzed (Figure 6B). This low mutation frequency might lead to an insufficient power to detect the small effect of mutations on survival. Not surprisingly, EGFR‐amplified tumors had significantly higher EGFR expression than those without EGFR amplification in all 9 cancers types (all P < 0.001, Figure 6C); however, there was no much EGFR expression difference between tumors with or without EGFR mutations except that EGFR mutation status was associated with significantly increased EGFR expression in GBM (P = 0.024) and LUAD (P = 0.001, Figure 6D).
FIGURE 6.

Association of EGFR amplification and somatic mutations with patient survival and EGFR expression. A Forest plot for the association between EGFR amplification and patient overall survival (OS). Only cancer types with at least 10 tumor samples containing amplification were analyzed. The sample size (number of samples without amplification | number of samples with amplification) of each cancer type is presented in parentheses. B Forest plot for the association between EGFR mutation status (SNVs and indels) and patient OS. Only cancer types with at least 10 tumor samples containing mutations were analyzed. Samples with CNVs were excluded from the analysis. The sample size (number of samples without mutations | number of samples with mutations) of each cancer type is presented in parentheses. Black boxes represent hazard ratio, and horizontal lines represent 95% confidence intervals. C EGFR expression in samples with and without EGFR amplification. Tumor types with EGFR amplification are marked with “1″, and their data are presented as red boxes; tumor types without EGFR amplification are marked with “0″, and their data are presented as green boxes. The numbers in parentheses are the sample sizes of indicated cancer types. EGFR‐amplified tumors have significantly higher EGFR expression than those without EGFR amplification in all 9 cancers types (all P < 0.001). D EGFR expression in tumors with (marked with “1″ and red box) and without (marked with “0″ and green box) EGFR mutations. The numbers in parentheses are the sample sizes of indicated cancer types. There is no significant EGFR expression difference between tumors with or without EGFR mutations except that EGFR mutations was associated with slightly increased EGFR expression in GBM (P = 0.024) and LUAD (P = 0.001)
3.5. EGFR abnormal expression and clinical implications
The low EGFR mutation frequency in most cancer types made it difficult to assess its impact on patient survival yet, and the increased expression of EGFR wide type could be oncogenic driver for tumor development and progression and have a negative impact on patient survival. For this we were interested in the tumors with abnormal EGFR expression compared with their paired normal samples across different cancer types. We first examined EGFR expression in 53 types of normal tissues in GTEx samples. As shown in Figure 7A, the expression of EGFR was quite variable across different types of tissues, with the medians ranging from 2.22 TPM (the brain‐spinal cord) to 73.91 TPM (the skin on the sun‐exposed, lower leg). EBV‐transformed lymphocytes and whole blood virtually barely had EGFR expression. The skin (both sun‐exposed and not exposed) had the highest expression.
FIGURE 7.

EGFR expression in normal and cancer tissues. A EGFR expression across 53 types of normal tissues. B Differential expression of EGFR between tumors and paired normal samples in TCGA datasets. C Differential expression of EGFR between tumors and normal samples using combined data from TCGA and GTEx datasets. EGFR expression is up‐regulated in GBM, LGG, KIRC, and THYM, but down‐regulated in ACC, BRCA, OV, SKCM, UCEC, and UCS (all P < 0.01). The sample size (number of tumor samples/number of normal samples) of each cancer type is presented in parentheses. Abbreviations: TPM, transcripts per million; other abbreviations as in Figure 1
We then compared EGFR expression between tumors and their paired normal samples profiled in TCGA. Among the 32 tumor types, 22 had at least two normal samples. Differential expression was found in 10 cancer types (all P < 0.01), with 3 cancer types up‐regulated (HNSC, LUSC, and KIRC) and 7 down‐regulated (BRCA, cholangiocarcinoma [CHOL], uterine corpus endometrial carcinoma [UCEC], liver hepatocellular carcinoma [LIHC], COAD, prostate adenocarcinoma [PRAD], and kidney renal papillary cell carcinoma [KIRP]) (Figure 7B). The most noticeable was BRCA whose EGFR expression was reduced over 8 folds (log2 fold change = ‐3). The cancer type with the most increased expression was KIRC with over 2‐fold increase. As some cancer types in TCGA did not have paired normal tissues or had too few, we further analyzed the data using GTEx normal samples as reference. Among different cancer types, GBM, LGG, KIRC, HNSC, ESCA, and LUSC all had higher EGFR expression than other cancer types (Supplementary Figure S4). Differential expression analysis from this expanded normal reference dataset showed similar results to the analysis of TCGA dataset. However, it revealed several additional cancer types with EGFR differential expression. EGFR expression was up‐regulated in GBM, LGG, KIRC, and THYM but down‐regulated in adrenocortical carcinoma (ACC), BRCA, ovarian serous cystadenocarcinoma (OV), PCPG, SKCM, UCEC, and UCS (all P < 0.01, Figure 7C). In the normal brain tissues, EGFR had minimal expression; however, its expression in GBM and LGG was dramatically increased (20‐fold increase for GBM and more than 10‐fold increase for LGG). KIRC also had nearly 4‐fold increase as compared with normal kidney tissues. Both ESCA and LUSC had a higher level of EGFR expression (about 2 folds) than their matching normal tissues. EGFR expression in SKCM was dramatically reduced relative to normal skin tissues; however, SKCM is thought to originate from melanocytes, and normal skin tissues have few such cells.
Survival association analysis using all tumors regardless of mutation or CNV status showed that increased EGFR expression was associated with short patient OS in bladder urothelial carcinoma (BLCA), cervical squamous cell carcinoma and endocervical adenocarcinoma (CESC), COAD, HNSC, LGG, PAAD, SKCM, and STAD. Interestingly, increased EGFR expression was associated with better prognosis for KIRC (Figure 8A). As gene amplification is a major driver for increased expression, we then limited analysis to those samples without amplification (tumors with unknown CNV status were also excluded). The same association held for BLCA, CESC, COAD, PAAD, SKCM, and KIRC (Figure 8B).
FIGURE 8.

Association between EGFR expression and patient OS. A Forest plot of EGFR expression association with patient OS regardless of EGFR amplification status. B Forrest plot of EGFR expression association with patient OS for tumors without EGFR amplification. Black boxes represent hazard ratio, and horizontal lines represent 95% confidence intervals. The sample size of each cancer type is presented in parentheses. Abbreviations: OS: overall survival
3.6. Associations of CpG methylation with EGFR expression and patient survival
For the tumors without EGFR amplification, we were interested in knowing if DNA methylation changes were responsible for or associated with abnormal expression of EGFR. Therefore, we extracted the methylation data of the 49 CpG sites associated with EGFR for the same set of patients. We analyzed the associations of each CpG site with EGFR RNA expression for all tumors together (7,913 samples) and for each tumor type separately. Among the 49 CpG sites, 46 were significantly associated with EGFR expression after Bonferroni multiple testing correction (P < 0.001). Interestingly, all CpGs around the promoter region of EGFR (7 CpGs in TSS+/‐1500 or 5′ UTR region) were negatively correlated with EGFR expression, while almost all (except 4) in the gene body were positively correlated with EGFR expression (Figure 9A). In individual cancer type analysis, most tumor types had the similar patterns of methylation association with gene expression in promoter and gene body, but a few others had predominant hypomethylation in both regions, such as GBM, LUSC, PRAD, THYM, KIRC, and KICH (Supplementary Figure S5). Survival analysis for all tumors with tumor type as a covariate only found 2 CpG sites (cg07311521 and cg16751451) significantly associated with OS, and both were in the promoter region (TSS1500). Association analysis for each tumor type separately found 13 tumor types with at least 2 CpGs that were significantly associated with OS (Figure 9B). LGG and UVM had the highest numbers of CpGs associated with patient survival (33 and 23 CpGs, respectively). For both cancer types, the CpGs with significant associations were mostly located in the gene body, where higher CpG methylation was associated with a better outcome. Higher methylation of one CpG in the promoter region was significantly associated with worse outcome of LGG. However, for LUAD (with 7 significant CpGs), their associations were mostly in opposite directions: hypermethylation of CpGs in the gene body was associated with worse outcome, while hypermethylation of one CpG in the promoter region was associated with better outcome (Figure 9C).
FIGURE 9.

Associations of CpG methylation with EGFR expression and patient survival. A Correlation of CpG methylation with EGFR gene expression for all tumor types. CpGs in EGFR promoter are negatively correlated with EGFR expression, while CpGs in the gene body are positively correlated with gene expression with a few exceptions. B Survival association P value (‐log10 P value) of each CpG site of EGFR gene for each tumor type. LGG and UVM have the highest numbers of CpGs significantly associated with patient survival. C Survival association direction and effect size (Cox model coefficient) for three selected tumor types (LGG, UVM, and LUAD). CpGs with P value greater than 0.05 are plotted as 0 for effect size (non‐significance)
4. DISCUSSION
Our analyses showed that EGFR mutation frequency, locations, and amplification differed greatly among different cancer types, which had important clinical implications. GBM had the highest rate of EGFR alterations, and amplification was the primary alteration. Somatic mutations generally occurred in the non‐targetable Furin‐like domain. Paradoxically, although EGFR expression in GBM was significantly increased, either by gene amplification or DNA methylation change, the expression level was not associated with patient OS. Other common tumor types with EGFR alterations include ESCA, HNSC, LGG, LUSC, and BLCA, all with similar characteristics: alteration frequency of about 5.0% and amplification as a dominant type. Except LGG, they were squamous or similar transitional cell origin. LUAD and STAD had similar frequencies of alternations, but their mutation and amplification patterns differed. On the other side of the spectrum, tumors such as DLBC and SKCM mainly had SNV mutations but rarely CNV; tumors including KIRC, MESO, THCA, THYM, UCS and UVM almost had no EGFR alterations.
Mutations in the Furin‐like and Pkinase_Tyr domains accounted for most of EGFR single nucleotide or indel mutations. However, the Pkinase_Tyr domain was far more important in terms of targeted therapy with TKIs as 90% EGFR mutations in LUAD occurred in this region, particularly the exon 19 deletion and the L858R point mutation in exon 21. Mutations in these regions are proven predictive markers for effective TKI therapy for NSCLC in clinical practice [7, 33, 34, 35], with significantly prolonged survival as compared with traditional combination chemotherapy [21, 36, 37]. The mutation rate of NSCLC in this TCGA cohort appeared consistent with the previous report that these two mutations accounted for 85% to 90% of all EGFR‐mutated NSCLC tumors [38, 39]. For other uncommon EGFR mutations in NSCLC, targeted therapy generated inconsistent results [34, 40, 41, 42]. It is clear that different EGFR mutations have very different implications, and only those resulting in destabilization of the equilibrium between the active and inactive states of EGFR kinase activity may benefit from EGFR targeted therapy [43, 44].
The clinical significance of EGFR mutations in other regions of the gene is less defined. EGFR was first linked to the oncogenesis of GBM [45]. In this large TCGA dataset, the combined alteration rate (amplification, deletion, or mutation) reached 67.3% in GBM. However, this high alteration rate was mainly driven by a high frequency of gene amplification. Compared with LUAD, most EGFR mutations in GBM were located in extracellular domain or single‐span transmembrane segment, which was known to be associated with tumorigenesis but not responsiveness to TKIs. Although EGFR amplification was a predictor of poor prognosis for several cancer types, it was not significantly associated with GBM, consistent with the paradox phenomenon reported in the literature [46]. Similarly, EGFR expression level was not prognostic in this dataset although some reports suggested otherwise [47]. The disagreement could be the results of multiple factors. The absence of well‐known responsive mutations and presence of redundant and alternative compensatory pathways were among the most important escape mechanisms [48].
The prognostic role of EGFR in LGG appears clear. Both amplification and high expression of EGFR were correlated with short patient survival in this dataset as reported previously [49, 50]. More interestingly, we found that LGG had the highest number of CpGs whose methylation level was associated with patient survival (i.e., hypermethylation of CpGs in the gene body with better survival), which has not been reported before.
COAD and PAAD had very few EGFR mutations in this TCGA dataset. However, high EGFR expression was significantly associated with short patient survival. Studies have shown that inhibition of EGFR by TKIs or antibodies either alone or in combination with chemotherapy provided extended survival for patients with these cancers [51, 52, 53]. Unfortunately, the clinical benefit is generally not big enough for routine application.
Squamous cell carcinomas in the head and neck (HNSC), lung (LUSC), and esophagus (ESCA) have some commonalities: significantly increased EGFR expression, high frequency of EGFR amplification, and low rate of SNV/indel mutations. Targeted therapy with cetuximab or necitumumab (a monoclonal antibody targeting EGFR), along with radiotherapy or chemotherapy, have demonstrated promising efficacy and prolonged OS for locally advanced or recurrent and/or metastatic HNSC [54], ESCA [55, 56, 57], and LUSC [58, 59], which is now a new first‐line treatment option in squamous NSCLC. The clear correlation between EGFR abnormal expression and treatment benefit highlights the importance of molecular profiling and predictive biomarkers for treatment selection.
This study profiled 32 cancer types. However, some rare cancer types did not have sufficient samples to capture the full EGFR alteration and expression spectrum and establish small and moderate associations. The low frequency of EGFR mutation or amplification also made analysis challenging. It was mostly a pan‐cancer global survey without deep dive on each cancer type. Several important leads revealed from this study are the directions of our future investigations.
5. CONCLUSIONS
Our analysis provides a comprehensive view of EGFR mutation, abnormal expression, DNA methylation, and their interplay and clinical implications for 32 cancer types covering over ten thousand tumor samples. While some alternations are involved more in tumorigenesis, others are more therapeutic. Some cancer types have a higher frequency of EGFR alternations where mutation, amplification, or abnormal expression is associated with outcome or indicated for clinical action. Genomic profiling may provide guidance for their use in targeted therapy.
DECLARATIONS
FUNDING
This work was supported by China Scholarship Council (No. 201806015028 to HJL), Chinese National Natural Science Foundation (No. 81101998 to HJL, No. 81872018 and No. 81372292 to BZ), Key Project from the Chinese Ministry of Science and Technology (No. 2017YFC0110200 to BZ), and the Mayo Clinic Center for Individualized Medicine (to ZFS).
AUTHORS’ CONTRIBUTIONS
HJL and ZFS conceived the study, performed the data analyses, interpreted the results, and wrote the manuscript. BZ provided suggestions and feedbacks to the design and implementation of the study. All authors read and approved the final manuscript.
ETHICS APPROVAL AND CONSENT TO PARTICIPATE
Not applicable.
CONSENT FOR PUBLICATION
Not applicable.
COMPETING INTERESTS
The authors declare that they have no competing interests.
AVAILABILITY OF DATA AND MATERIALS
The datasets analyzed for this study are all publicly available as indicated in the Method section.
Supporting information
Supplementary Table S1. The detailed information of 320 human epidermal growth factor receptor (EGFR) somatic mutations from cBioportal of The Cancer Genome Atlas (TCGA) provisional datasets for 32 cancer types.
Supplementary Table S2. Somatic mutation distribution in different functional domains of EGFR for cancers with EGFR mutations and all cancers together.
Fig. S1 The impacts of EGFR aberrations (mutations and CNVs in combination) on overall survival (a) and disease‐free survival (b) in pan‐cancer analysis. Patients with EGFR alterations had shorter median overall survival and disease‐free survival than those without EGFR alteration (both P < 0.001). Abbreviations: EGFR: epidermal growth factor receptor.
Fig. S2 The Impacts of EGFR Mutations on Overall Survival (a) and Disease‐free Survival (b) in Pan‐cancer Analysis. Patients with EGFR mutations had shorter median overall survival and disease‐free survival than those without EGFR mutations (both P < 0.001). Abbreviations: EGFR: epidermal growth factor receptor.
Fig. S3 The impacts of EGFR CNVs on overall survival (a) and disease‐free survival (b) in pan‐cancer analysis. Patients with EGFR CNVs had shorter median overall survival and disease‐free survival than those without EGFR CNVs (both P < 0.001). Abbreviations: EGFR: epidermal growth factor receptor; CNV: copy number variant.
Fig. S4 Relative EGFR expression among different cancer types (from TCGA datasets) and their respective normal samples (combined from TCGA and GTEx datasets). Among different cancer types, GBM, LGG, KIRC, HNSC, ESCA, and LUSC all had higher EGFR expression than other cancer types. Abbreviations: EGFR: epidermal growth factor receptor; ESCA: esophageal carcinoma; GBM: glioblastoma multiforme; HNSC: head and neck squamous cell carcinoma; KIRC: kidney renal clear cell carcinoma; LGG: brain lower‐grade glioma; LUSC: lung squamous cell carcinoma.
Fig. S5 The correlation of CpG methylation with EGFR expression for each cancer type and all cancer types together as viewed in Integrative Genomics Viewer (IGV). The red and green bars represent positive and negative correlation coefficients, respectively. Most tumor types have similar patterns of methylation association with gene expression in the promoter and gene body, but some others have predominant hypomethylation in both regions such as GBM, LUSC, PRAD, THYM, KIRC, and KICH. Abbreviations: KICH: KICH: kidney chromophobe; PRAD: prostate adenocarcinoma; THYM: thymoma; IGV: Integrative Genomics Viewer; other abbreviations as in Fig. S4.
ACKNOWLEDGEMENTS
The results shown here are in whole or part based upon data generated by The Cancer Genome Atlas (TCGA) Research Network: https://www.cancer.gov/tcga.
Liu H, Zhang B, Sun Z. Spectrum of EGFR aberrations and potential clinical implications: insights from integrative pan‐cancer analysis. Cancer Commun. 2020;40:43–59. 10.1002/cac2.12005
REFERENCES
- 1. Baselga J, Swain SM. Novel anticancer targets: revisiting ERBB2 and discovering ERBB3. Nat Rev Cancer. 2009;9:463 10.1038/nrc2656 [DOI] [PubMed] [Google Scholar]
- 2. Lemmon MA, Schlessinger J. Cell signaling by receptor tyrosine kinases. Cell. 2010;141(7):1117–34. 10.1016/j.cell.2010.06.011 [DOI] [PMC free article] [PubMed] [Google Scholar]
- 3. El‐Gebali S, Mistry J, Bateman A, Eddy SR, Luciani A, Potter SC, et al. The Pfam protein families database in 2019. Nucleic Acids Res. 2019;47(D1):D427–D32. 10.1093/nar/gky995 [DOI] [PMC free article] [PubMed] [Google Scholar]
- 4. Yarden Y, Sliwkowski MX. Untangling the ErbB signalling network. Nat Rev Mol Cell Biol. 2001;2:127 10.1038/35052073 [DOI] [PubMed] [Google Scholar]
- 5. Mitsudomi T, Yatabe Y. Epidermal growth factor receptor in relation to tumor development: EGFR gene and cancer. FEBS J. 2010;277(2):301–8. 10.1111/j.1742-4658.2009.07448.x [DOI] [PubMed] [Google Scholar]
- 6. De Luca A, Maiello MR, D'Alessio A, Pergameno M, Normanno N. The RAS/RAF/MEK/ERK and the PI3K/AKT signalling pathways: role in cancer pathogenesis and implications for therapeutic approaches. Expert Opin Ther Targets. 2012;16(sup2):S17–S27. 10.1517/14728222.2011.639361 [DOI] [PubMed] [Google Scholar]
- 7. Roskoski R, Jr. Small molecule inhibitors targeting the EGFR/ErbB family of protein‐tyrosine kinases in human cancers. Pharmacol Res. 2019;139:395‐411. 10.1016/j.phrs.2018.11.014 [DOI] [PubMed] [Google Scholar]
- 8. Kancha RK, von Bubnoff N, Peschel C, Duyster J. Functional analysis of epidermal growth factor receptor (EGFR) mutations and potential implications for EGFR targeted therapy. Clin Cancer Res. 2009;15(2):460–7. 10.1158/1078-0432.CCR-08-1757 [DOI] [PubMed] [Google Scholar]
- 9. Shah RB, Ghosh D, Elder JT. Epidermal growth factor receptor (ErbB1) expression in prostate cancer progression: correlation with androgen independence. Prostate. 2006;66(13):1437–44. 10.1002/pros.20460 [DOI] [PubMed] [Google Scholar]
- 10. Wang Z. ErbB Receptors and Cancer. Methods Mol Biol. 2017;1652:3–35. 10.1007/978-1-4939-7219-7_1 [DOI] [PubMed] [Google Scholar]
- 11. Ueda S, Ogata S, Tsuda H, Kawarabayashi N, Kimura M, Sugiura Y, et al. The correlation between cytoplasmic overexpression of epidermal growth factor receptor and tumor aggressiveness: poor prognosis in patients with pancreatic ductal adenocarcinoma. Pancreas. 2004;29(1):e1–8 [DOI] [PubMed] [Google Scholar]
- 12. Nahm CB, Turchini J, Jamieson N, Moon E, Sioson L, Itchins M, et al. Biomarker panel predicts survival after resection in pancreatic ductal adenocarcinoma: A multi‐institutional cohort study. Eur J Surg Oncol. 2019;45(2):218–24. 10.1016/j.ejso.2018.10.050 [DOI] [PubMed] [Google Scholar]
- 13. Russo A, Franchina T, Ricciardi GR, Picone A, Ferraro G, Zanghi M, et al. A decade of EGFR inhibition in EGFR‐mutated non small cell lung cancer (NSCLC): Old successes and future perspectives. Oncotarget. 2015;6(29):26814–25. 10.18632/oncotarget.4254 [DOI] [PMC free article] [PubMed] [Google Scholar]
- 14. Cancer Genome Atlas N. Comprehensive molecular characterization of human colon and rectal cancer. Nature. 2012;487(7407):330–7. 10.1038/nature11252 [DOI] [PMC free article] [PubMed] [Google Scholar]
- 15. Allen BK, Mehta S, Ember SW, Schonbrunn E, Ayad N, Schurer SC. Large‐Scale Computational Screening Identifies First in Class Multitarget Inhibitor of EGFR Kinase and BRD4. Sci Rep. 2015;5:16924 10.1038/srep16924 [DOI] [PMC free article] [PubMed] [Google Scholar]
- 16. Huang S, Li C, Armstrong EA, Peet CR, Saker J, Amler LC, et al. Dual targeting of EGFR and HER3 with MEHD7945A overcomes acquired resistance to EGFR inhibitors and radiation. Cancer Res. 2013;73(2):824–33. 10.1158/0008-5472.CAN-12-1611 [DOI] [PMC free article] [PubMed] [Google Scholar]
- 17. Guardiola S, Diaz‐Lobo M, Seco J, Garcia J, Nevola L, Giralt E. Peptides Targeting EGF Block the EGF‐EGFR Interaction. ChemBioChem. 2016;17(8):702–11. 10.1002/cbic.201500525 [DOI] [PubMed] [Google Scholar]
- 18. Danhier F, Messaoudi K, Lemaire L, Benoit JP, Lagarce F. Combined anti‐Galectin‐1 and anti‐EGFR siRNA‐loaded chitosan‐lipid nanocapsules decrease temozolomide resistance in glioblastoma: in vivo evaluation. Int J Pharm. 2015;481(1‐2):154–61. 10.1016/j.ijpharm.2015.01.051 [DOI] [PubMed] [Google Scholar]
- 19. Mendelsohn J, Baselga J. Epidermal growth factor receptor targeting in cancer. Semin Oncol. 2006;33(4):369–85. 10.1053/j.seminoncol.2006.04.003 [DOI] [PubMed] [Google Scholar]
- 20. Lynch TJ, Bell DW, Sordella R, Gurubhagavatula S, Okimoto RA, Brannigan BW, et al. Activating mutations in the epidermal growth factor receptor underlying responsiveness of non‐small‐cell lung cancer to gefitinib. N Engl J Med. 2004;350(21):2129–39. 10.1056/NEJMoa040938 [DOI] [PubMed] [Google Scholar]
- 21. Rosell R, Carcereny E, Gervais R, Vergnenegre A, Massuti B, Felip E, et al. Erlotinib versus standard chemotherapy as first‐line treatment for European patients with advanced EGFR mutation‐positive non‐small‐cell lung cancer (EURTAC): a multicentre, open‐label, randomised phase 3 trial. Lancet Oncol. 2012;13(3):239–46. 10.1016/S1470-2045(11)70393-X [DOI] [PubMed] [Google Scholar]
- 22. An Z, Aksoy O, Zheng T, Fan QW, Weiss WA. Epidermal growth factor receptor and EGFRvIII in glioblastoma: signaling pathways and targeted therapies. Oncogene. 2018;37(12):1561–75. 10.1038/s41388-017-0045-7 [DOI] [PMC free article] [PubMed] [Google Scholar]
- 23. Hatanpaa KJ, Burma S, Zhao D, Habib AA. Epidermal growth factor receptor in glioma: signal transduction, neuropathology, imaging, and radioresistance. Neoplasia. 2010;12(9):675–84 [DOI] [PMC free article] [PubMed] [Google Scholar]
- 24. Spasic M, Chow F, Tu C, Nagasawa DT, Yang I. Molecular characteristics and pathways of Avastin for the treatment of glioblastoma multiforme. Neurosurg Clin N Am. 2012;23(3):417–27. 10.1016/j.nec.2012.05.002 [DOI] [PubMed] [Google Scholar]
- 25. Cancer Genome Atlas Research N , Weinstein JN, Collisson EA, Mills GB, Shaw KRM, Ozenberger BA, et al. The Cancer Genome Atlas Pan‐Cancer analysis project. Nat Genet. 2013;45(10):1113–20. 10.1038/ng.2764 [DOI] [PMC free article] [PubMed] [Google Scholar]
- 26. International Cancer Genome C , Hudson TJ, Anderson W, Artez A, Barker AD, Bell C, et al. International network of cancer genome projects. Nature. 2010;464(7291):993–8. 10.1038/nature08987 [DOI] [PMC free article] [PubMed] [Google Scholar]
- 27. Barretina J, Caponigro G, Stransky N, Venkatesan K, Margolin AA, Kim S, et al. The Cancer Cell Line Encyclopedia enables predictive modelling of anticancer drug sensitivity. Nature. 2012;483(7391):603–7. 10.1038/nature11003 [DOI] [PMC free article] [PubMed] [Google Scholar]
- 28. Cerami E, Gao J, Dogrusoz U, Gross BE, Sumer SO, Aksoy BA, et al. The cBio cancer genomics portal: an open platform for exploring multidimensional cancer genomics data. Cancer Discov. 2012;2(5):401–4. 10.1158/2159-8290.CD-12-0095 [DOI] [PMC free article] [PubMed] [Google Scholar]
- 29. Gao J, Aksoy BA, Dogrusoz U, Dresdner G, Gross B, Sumer SO, et al. Integrative analysis of complex cancer genomics and clinical profiles using the cBioPortal. Sci Signal. 2013;6(269):l1 10.1126/scisignal.2004088 [DOI] [PMC free article] [PubMed] [Google Scholar]
- 30. Tang Z, Li C, Kang B, Gao G, Li C, Zhang Z. GEPIA: a web server for cancer and normal gene expression profiling and interactive analyses. Nucleic Acids Res. 2017;45(W1):W98–W102. 10.1093/nar/gkx247 [DOI] [PMC free article] [PubMed] [Google Scholar]
- 31. Richards S, Aziz N, Bale S, Bick D, Das S, Gastier‐Foster J, et al. Standards and guidelines for the interpretation of sequence variants: a joint consensus recommendation of the American College of Medical Genetics and Genomics and the Association for Molecular Pathology. Genet Med. 2015;17(5):405–24. 10.1038/gim.2015.30 [DOI] [PMC free article] [PubMed] [Google Scholar]
- 32. Chakravarty D, Gao J, Phillips SM, Kundra R, Zhang H, Wang J, et al. OncoKB: A Precision Oncology Knowledge Base. JCO Precis Oncol. 2017;2017 10.1200/PO.17.00011 [DOI] [PMC free article] [PubMed] [Google Scholar]
- 33. Wang F, Diao XY, Zhang X, Shao Q, Feng YF, An X, et al. Identification of genetic alterations associated with primary resistance to EGFR‐TKIs in advanced non‐small‐cell lung cancer patients with EGFR sensitive mutations. Cancer Commun (Lond). 2019;39(1):7 10.1186/s40880-019-0354-z [DOI] [PMC free article] [PubMed] [Google Scholar]
- 34. Watanabe S, Minegishi Y, Yoshizawa H, Maemondo M, Inoue A, Sugawara S, et al. Effectiveness of gefitinib against non‐small‐cell lung cancer with the uncommon EGFR mutations G719X and L861Q. J Thorac Oncol. 2014;9(2):189–94. 10.1097/JTO.0000000000000048 [DOI] [PMC free article] [PubMed] [Google Scholar]
- 35. Yu X, Zhang X, Zhang Z, Lin Y, Wen Y, Chen Y, et al. First‐generation EGFR tyrosine kinase inhibitor therapy in 106 patients with compound EGFR‐mutated lung cancer: a single institution's clinical practice experience. Cancer Commun (Lond). 2018;38(1):51 10.1186/s40880-018-0321-0 [DOI] [PMC free article] [PubMed] [Google Scholar]
- 36. Maemondo M, Inoue A, Kobayashi K, Sugawara S, Oizumi S, Isobe H, et al. Gefitinib or chemotherapy for non‐small‐cell lung cancer with mutated EGFR. N Engl J Med. 2010;362(25):2380–8. 10.1056/NEJMoa0909530 [DOI] [PubMed] [Google Scholar]
- 37. Wu YL, Zhou C, Hu CP, Feng J, Lu S, Huang Y, et al. Afatinib versus cisplatin plus gemcitabine for first‐line treatment of Asian patients with advanced non‐small‐cell lung cancer harbouring EGFR mutations (LUX‐Lung 6): an open‐label, randomised phase 3 trial. Lancet Oncol. 2014;15(2):213–22. 10.1016/S1470-2045(13)70604-1 [DOI] [PubMed] [Google Scholar]
- 38. Wei B, Ren P, Zhang C, Wang Z, Dong B, Yang K, et al. Characterization of common and rare mutations in EGFR and associated clinicopathological features in a large population of Chinese patients with lung cancer. Pathol Res Pract. 2017;213(7):749–58. 10.1016/j.prp.2017.04.007 [DOI] [PubMed] [Google Scholar]
- 39. Zhang Y‐L, Yuan J‐Q, Wang K‐F, Fu X‐H, Han X‐R, Threapleton D, et al. The prevalence of EGFR mutation in patients with non‐small cell lung cancer: a systematic review and meta‐analysis. Oncotarget. 2016;7(48):78985–93. 10.18632/oncotarget.12587 [DOI] [PMC free article] [PubMed] [Google Scholar]
- 40. Wu JY, Yu CJ, Chang YC, Yang CH, Shih JY, Yang PC. Effectiveness of tyrosine kinase inhibitors on “uncommon” epidermal growth factor receptor mutations of unknown clinical significance in non‐small cell lung cancer. Clin Cancer Res. 2011;17(11):3812–21. 10.1158/1078-0432.CCR-10-3408 [DOI] [PubMed] [Google Scholar]
- 41. Yang JC, Sequist LV, Geater SL, Tsai CM, Mok TS, Schuler M, et al. Clinical activity of afatinib in patients with advanced non‐small‐cell lung cancer harbouring uncommon EGFR mutations: a combined post‐hoc analysis of LUX‐Lung 2, LUX‐Lung 3, and LUX‐Lung 6. Lancet Oncol. 2015;16(7):830–8. 10.1016/S1470-2045(15)00026-1 [DOI] [PubMed] [Google Scholar]
- 42. Tu HY, Ke EE, Yang JJ, Sun YL, Yan HH, Zheng MY, et al. A comprehensive review of uncommon EGFR mutations in patients with non‐small cell lung cancer. Lung Cancer. 2017;114:96–102. 10.1016/j.lungcan.2017.11.005 [DOI] [PubMed] [Google Scholar]
- 43. Eck MJ, Yun CH. Structural and mechanistic underpinnings of the differential drug sensitivity of EGFR mutations in non‐small cell lung cancer. Biochim Biophys Acta. 2010;1804(3):559–66. 10.1016/j.bbapap.2009.12.010 [DOI] [PMC free article] [PubMed] [Google Scholar]
- 44. Zhang S, Zhu L, Xia B, Chen E, Zhao Q, Zhang X, et al. Epidermal growth factor receptor (EGFR) T790M mutation identified in plasma indicates failure sites and predicts clinical prognosis in non‐small cell lung cancer progression during first‐generation tyrosine kinase inhibitor therapy: a prospective observational study. Cancer Commun (Lond). 2018;38(1):28 10.1186/s40880-018-0303-2 [DOI] [PMC free article] [PubMed] [Google Scholar]
- 45. Downward J, Yarden Y, Mayes E, Scrace G, Totty N, Stockwell P, et al. Close similarity of epidermal growth factor receptor and v‐erb‐B oncogene protein sequences. Nature. 1984;307(5951):521–7 [DOI] [PubMed] [Google Scholar]
- 46. Hobbs J, Nikiforova MN, Fardo DW, Bortoluzzi S, Cieply K, Hamilton RL, et al. Paradoxical relationship between the degree of EGFR amplification and outcome in glioblastomas. Am J Surg Pathol. 2012;36(8):1186–93. 10.1097/PAS.0b013e3182518e12 [DOI] [PMC free article] [PubMed] [Google Scholar]
- 47. Li J, Liang R, Song C, Xiang Y, Liu Y. Prognostic significance of epidermal growth factor receptor expression in glioma patients. Onco Targets Ther. 2018;11:731–42. 10.2147/OTT.S155160 [DOI] [PMC free article] [PubMed] [Google Scholar]
- 48. Roth P, Weller M. Challenges to targeting epidermal growth factor receptor in glioblastoma: escape mechanisms and combinatorial treatment strategies. Neuro Oncol. 2014;16(Suppl 8):viii14–9. 10.1093/neuonc/nou222 [DOI] [PMC free article] [PubMed] [Google Scholar]
- 49. Andersson U, Guo D, Malmer B, Bergenheim AT, Brännström T, Hedman H, et al. Epidermal growth factor receptor family (EGFR, ErbB2‐4) in gliomas and meningiomas. Acta Neuropathol. 2004;108(2):135–42. 10.1007/s00401-004-0875-6 [DOI] [PubMed] [Google Scholar]
- 50. Muracciole X, Romain S, Dufour H, Palmari J, Chinot O, Ouafik LH, et al. PAI‐1 and EGFR expression in adult glioma tumors: toward a molecular prognostic classification. Int J Radiat Oncol Biol Phys. 2002;52(3):592–98. 10.1016/s0360-3016(01)02699-2 [DOI] [PubMed] [Google Scholar]
- 51. Yewale C, Baradia D, Vhora I, Patil S, Misra A. Epidermal growth factor receptor targeting in cancer: a review of trends and strategies. Biomaterials. 2013;34(34):8690–707. 10.1016/j.biomaterials.2013.07.100 [DOI] [PubMed] [Google Scholar]
- 52. Arnold D, Lueza B, Douillard JY, Peeters M, Lenz HJ, Venook A, et al. Prognostic and predictive value of primary tumour side in patients with RAS wild‐type metastatic colorectal cancer treated with chemotherapy and EGFR directed antibodies in six randomized trials. Ann Oncol. 2017;28(8):1713–29. 10.1093/annonc/mdx175 [DOI] [PMC free article] [PubMed] [Google Scholar]
- 53. Sheahan AV, Biankin AV, Parish CR, Khachigian LM. Targeted therapies in the management of locally advanced and metastatic pancreatic cancer: a systematic review. Oncotarget. 2018;9(30):21613–27. 10.18632/oncotarget.25085 [DOI] [PMC free article] [PubMed] [Google Scholar]
- 54. Saada‐Bouzid E, Le Tourneau C. Beyond EGFR Targeting in SCCHN: Angiogenesis, PI3K, and Other Molecular Targets. Front Oncol. 2019;9:74 10.3389/fonc.2019.00074 [DOI] [PMC free article] [PubMed] [Google Scholar]
- 55. Brenner B, Purim O, Gordon N, Goshen‐Lago T, Idelevich E, Kashtan H, et al. The addition of cetuximab to preoperative chemoradiotherapy for locally advanced esophageal squamous cell carcinoma is associated with high rate of long term survival: Mature results from a prospective phase Ib/II trial. Radiother Oncol. 2019;134:74–80. 10.1016/j.radonc.2019.01.013 [DOI] [PubMed] [Google Scholar]
- 56. Jing W, Yan W, Liu Y, Li J, Yu J, Zhu H. Slight advantages of nimotuzumab versus cetuximab plus concurrent chemoradiotherapy in locally advanced esophageal squamous cell carcinoma. Cancer Biol Ther. 2019:1–6. 10.1080/15384047.2019.1598760 [DOI] [PMC free article] [PubMed] [Google Scholar]
- 57. Zhu H, Wang C, Wang J, Chen D, Deng J, Deng J, et al. A subset of esophageal squamous cell carcinoma patient‐derived xenografts respond to cetuximab, which is predicted by high EGFR expression and amplification. J Thorac Dis. 2018;10(9):5328–38. 10.21037/jtd.2018.09.18 [DOI] [PMC free article] [PubMed] [Google Scholar]
- 58. Diaz‐Serrano A, Sanchez‐Torre A, Paz‐Ares L. Necitumumab for the treatment of advanced non‐small‐cell lung cancer. Future Oncol. 2019;15(7):705–16. 10.2217/fon-2018-0594 [DOI] [PubMed] [Google Scholar]
- 59. Paz‐Ares L, Socinski MA, Shahidi J, Hozak RR, Soldatenkova V, Kurek R, et al. Correlation of EGFR‐expression with safety and efficacy outcomes in SQUIRE: a randomized, multicenter, open‐label, phase III study of gemcitabine‐cisplatin plus necitumumab versus gemcitabine‐cisplatin alone in the first‐line treatment of patients with stage IV squamous non‐small‐cell lung cancer. Ann Oncol. 2016;27(8):1573–9. 10.1093/annonc/mdw214 [DOI] [PMC free article] [PubMed] [Google Scholar]
Associated Data
This section collects any data citations, data availability statements, or supplementary materials included in this article.
Supplementary Materials
Supplementary Table S1. The detailed information of 320 human epidermal growth factor receptor (EGFR) somatic mutations from cBioportal of The Cancer Genome Atlas (TCGA) provisional datasets for 32 cancer types.
Supplementary Table S2. Somatic mutation distribution in different functional domains of EGFR for cancers with EGFR mutations and all cancers together.
Fig. S1 The impacts of EGFR aberrations (mutations and CNVs in combination) on overall survival (a) and disease‐free survival (b) in pan‐cancer analysis. Patients with EGFR alterations had shorter median overall survival and disease‐free survival than those without EGFR alteration (both P < 0.001). Abbreviations: EGFR: epidermal growth factor receptor.
Fig. S2 The Impacts of EGFR Mutations on Overall Survival (a) and Disease‐free Survival (b) in Pan‐cancer Analysis. Patients with EGFR mutations had shorter median overall survival and disease‐free survival than those without EGFR mutations (both P < 0.001). Abbreviations: EGFR: epidermal growth factor receptor.
Fig. S3 The impacts of EGFR CNVs on overall survival (a) and disease‐free survival (b) in pan‐cancer analysis. Patients with EGFR CNVs had shorter median overall survival and disease‐free survival than those without EGFR CNVs (both P < 0.001). Abbreviations: EGFR: epidermal growth factor receptor; CNV: copy number variant.
Fig. S4 Relative EGFR expression among different cancer types (from TCGA datasets) and their respective normal samples (combined from TCGA and GTEx datasets). Among different cancer types, GBM, LGG, KIRC, HNSC, ESCA, and LUSC all had higher EGFR expression than other cancer types. Abbreviations: EGFR: epidermal growth factor receptor; ESCA: esophageal carcinoma; GBM: glioblastoma multiforme; HNSC: head and neck squamous cell carcinoma; KIRC: kidney renal clear cell carcinoma; LGG: brain lower‐grade glioma; LUSC: lung squamous cell carcinoma.
Fig. S5 The correlation of CpG methylation with EGFR expression for each cancer type and all cancer types together as viewed in Integrative Genomics Viewer (IGV). The red and green bars represent positive and negative correlation coefficients, respectively. Most tumor types have similar patterns of methylation association with gene expression in the promoter and gene body, but some others have predominant hypomethylation in both regions such as GBM, LUSC, PRAD, THYM, KIRC, and KICH. Abbreviations: KICH: KICH: kidney chromophobe; PRAD: prostate adenocarcinoma; THYM: thymoma; IGV: Integrative Genomics Viewer; other abbreviations as in Fig. S4.
Data Availability Statement
The datasets analyzed for this study are all publicly available as indicated in the Method section.