

Abstract
The amygdala is a part of neural networks that contribute to the regulation of emotional behaviours and emotional learning, stress response, and olfactory, pheromonal and reproductive functions. All these various functions are processed by the three main functional systems, frontotemporal, autonomic and olfactory, which are derived from different telencephalic sources (claustrum, striatum and olfactory cortex) and are represented, respectively, by the basolateral complex (BLC), the central complex (CC) and corticomedial complex (CMC) of the amygdala. The question arises of how these three functional systems evolved during mammalian phylogeny to fit the amygdala to specific needs of various animals. In the present study, we provide quantitative information regarding the individual volumes and neuron numbers in the BLC, CC and CMC of the common shrew, guinea pig, rabbit, fox and pig, a series of animals arranged according to increasing size and complexity of the brain. The results show that, in this series of animals, the BLC underwent a gradual size increase in volume and number of neurons, whereas the CMC was gradually reduced with regard to both these measures. The CC was more or less conserved across studied species. For example, the volume of the amygdala in pigs is ~250 times larger than that in shrews and it also has almost 26 times as many neurons as the amygdala of shrews. However, the volumes of the BLC, CC and CMC were ~380, 208 and 148 times larger, respectively, in pigs than in shrews. The number of neurons in these three regions was ~38, 23 and 20 times greater, respectively, in pigs than in shrews. The results also show striking morphometric similarities of the amygdala in the guinea pig and rabbit as well as fox and pig. For example, the percentages of neurons in the fox and pig are 42.23% and 42.78%, respectively, for the BLC, 16.64% and 16.58%, respectively, for the CC, and 41.12% and 40.64%, respectively, for the CMC. In conclusion, our results indicate that the amygdala does not evolve as a single unit but, instead, the three main functional systems evolved independently, which suggests that brain structures with major functional links evolve together independently of evolutionary changes in other unrelated structures. The size progression of the BLC parallels the size progression of the neocortex with which it is strongly functionally linked, whereas the CMC is strongly connected to olfactory regions, and all these structures follow the same regression course. Remarkable morphometric similarity of the amygdala in the guinea pig and rabbit as well as in the fox and pig, however, suggest that there must also be another mechanism shaping the morphology of the amygdala and the brain during evolution. The gradual nature of size changes in the BLC and CMC support this hypothesis as well.
Keywords: amygdala, comparative neuroanatomy, mammalian evolution, neuron number, stereology, volume
Results show that the amygdala did not evolve as a single unit during phylogeny but was reorganized in mosaic‐like fashion by independent evolution of three distinct regions: the basolateral, corticomedial and central regions. However, the remarkable morphometric similarity of the amygdala in the guinea pig and rabbit, as well as in the fox and pig (all from different clades) suggest that there must be also another mechanism shaping the morphology of the amygdala and whole brain during the course of evolution.

Introduction
The amygdala is a set of nuclei and cortical regions within the temporal lobe of the brain which is involved in various aspects of emotional behaviour and emotional learning (LeDoux, 2003; Pape & Pare, 2010; Janak & Tye, 2015), particularly fear (LeDoux, 2003; Feinstein et al. 2011), anxiety (Rauch et al. 2003; Pape & Pare, 2010), stress (Roozendaal et al. 2009) and appetitive and aversive conditioning (Shabel & Janak, 2009). In addition, the amygdala has been shown to be engaged in mediation of olfactory, pheromonal and reproductive functions (Kevetter & Winans, 1981a, 1981b; Lanuza et al. 2008; Baum, 2009; Gutiérrez‐Castellanos et al. 2010). Although the amygdala was essentially designed to serve as a danger detector, facilitating the survival of the individual animal, it was substantially reorganised during mammalian phylogeny to serve additional functions. For example, in primates and humans, although survival functions are essentially conserved, the amygdala can integrate additional contextual information which can further lead to the regulation of more complex behaviours, such as the modulation of social interactions (Adolphs, 2003; Amaral et al. 2003).
The amygdala is a highly differentiated brain structure comprising about 13 different cell groups (Pabba, 2013), which together form three larger regions. Accumulating evidence indicates that structurally, these three regions are actually differentiated parts of the telencephalon with different embryological origins (Swanson & Petrovich, 1998; Martínez‐García et al. 2002; Pabba, 2013), representing in the amygdala the three main functional systems: the frontotemporal cortical, autonomic and olfactory systems, respectively (Swanson & Petrovich, 1998). The first region of the amygdala, which represents the frontotemporal functional system, is the basolateral complex (BLC) comprising the lateral (LA), basolateral (BL), and basomedial (BM) nuclei (Swanson & Petrovich, 1998). Although there is general consent in the literature that components of the BLC are pallial derivatives, the exact origin of this region is still under debate (Swanson & Petrovich, 1998; Puelles et al. 2000; Puelles, 2017). The components may be the embryonic claustrum, the lateral pallium or the ventral pallium (Swanson & Petrovich, 1998; Puelles et al. 2000; Puelles, 2017). Notwithstanding this unresolved embryological origin, the BLC nuclei form a compact nuclear complex and are organized in a very similar way. For example, they have similar cellular structure (Równiak et al. 2003), are interconnected (Pitkänen et al. 2000; Sah et al. 2003) and, although the cells do not exhibit a laminar or columnar organisation, their anatomical and electrophysiological characteristics are remarkably similar to those of their counterparts in the cerebral cortex (McDonald, 1992; Washburn & Moises, 1992; Rainnie et al. 1993). In addition, the BLC nuclei are characterised by especially rich bidirectional connections with various regions of the neocortex, including the frontal and temporal cortices, as well as strong connections with hippocampal formation and the thalamus (Pitkänen et al. 2000). In contrast, except the BM, connections with the hypothalamus and brainstem are rather scarce in this region (Pitkänen et al. 2000). At present the BLC is considered to be the main sensory gateway for non‐olfactory cues in the amygdala and the main region for emotional processing and emotional learning (LeDoux, 2003; Sah et al. 2003; Pape & Pare, 2010).
The second region, the central complex (CC) of the amygdala, is composed of striatal (subpallial) derivatives and is represented primarily by the central nucleus (CE), which is considered to be a specialized autonomic‐projecting motor region of the striatum (Swanson & Petrovich, 1998; Puelles et al. 2000). Although, according to various authors, there are many other striatal‐like regions in the amygdala such as the medial nucleus (ME), anterior amygdaloid area (AAA) and intercalated cell mases (Swanson & Petrovich, 1998; Puelles et al. 2000; Martínez‐García et al. 2002), these are functionally different from the CE and are engaged in other functional systems of the amygdala (Swanson & Petrovich, 1998). The CE is characterised by very selective efferent projections to the autonomic and visceral brainstem and hypothalamic centres (Pitkänen et al. 2000), which evoke species‐specific emotional sensations and behaviours, being the ‘essence of emotion’ (LeDoux, 2000). As the CE receives convergent information from almost all nuclei of the amygdala (Pitkänen et al. 2000) without sending information back to any of them, it is also considered to be the primary effector region of the amygdala (LeDoux, 2003; Sah et al. 2003).
The third large region of the amygdala, representing the olfactory functional system, is the corticomedial complex (CMC), which has a dual embryological origin. According to Swanson & Petrovich (1998) and Puelles et al. (2000), part of the CMC is composed of derivatives of the olfactory cortex forming the caudal end of the piriform lobe, which includes the cortical (CO), lateral olfactory tract (NLOT) and accessory olfactory tract (BAOT) nuclei (Swanson & Petrovich, 1998). Another part of the CMC is formed by the ME, which has a mainly striatal (subpallial) origin (Swanson & Petrovich, 1998; Puelles et al. 2000; Bupesh et al. 2011). Although the ME is considered part of the striatal‐like amygdala owing to its medial location and similarity with regard to neurotransmitter content (Swanson & Petrovich, 1998; Puelles et al. 2000; Martínez‐García et al. 2002), there is sufficient evidence, such as cellular structure, cortical‐like (laminar) organisation and specialised connections (Kevetter & Winans, 1981a, 1981b; Pitkänen et al. 2000), which place the ME among the olfactory structures. The CMC, composed of the CO, NLOT and ME, as adopted in the present study, was often analysed as a consistent concept in various neuroanatomical studies (Kevetter & Winans, 1981a, 1981b). These three regions of the amygdala all have a laminated cellular arrangement more or less similar to that of the piriform cortex, are interconnected, and have strong bidirectional connections with the main and accessory olfactory bulbs (Kevetter & Winans, 1981a, 1981b; Pitkänen et al. 2000). At present the CMC is considered to be the main sensory gateway for olfactory cues and it is the main region in the amygdala for processing reproductive and defensive behaviours (Sah et al. 2003; Maras & Petrulis, 2008; Gutiérrez‐Castellanos et al. 2010; Hong et al. 2014). It is worth mentioning that within the CMC there are actually two co‐operating subsystems (Swanson & Petrovich, 1998; Gutiérrez‐Castellanos et al. 2010). The first of these is engaged in processing pheromonal cues from the accessory olfactory bulb and is composed of the ME and the posterior cortical nucleus (Cop) (Kevetter & Winans, 1981a; Gutiérrez‐Castellanos et al. 2010). The second subsystem processes pure olfactory cues coming from the main olfactory bulb using the anterior cortical nucleus and periamygdaloid cortex (Kevetter & Winans, 1981b; Gutiérrez‐Castellanos et al. 2010).
Taken together, there are three main functional systems, frontotemporal, autonomic and olfactory, in the mammalian amygdala, derived from different telencephalic sources to process non‐olfactory and olfactory cues and generate coherent and appropriate emotional responses to environmental stimuli (Swanson & Petrovich, 1998). The importance of various cues differs across mammalian species, and emotional responses generated by the amygdala of various animals are also diversified. The question therefore arises of how these three functional systems evolved in various animals during mammalian phylogeny to fit the amygdala to the specific needs of various animals and finally reach the level seen in the human amygdala, which is quite different from a simple danger detector and became the centre of complex emotional behaviours and subtle social interactions (Amaral et al. 2003; Chareyron et al. 2011). To answer this question, volume and neuron numbers in the BLC (composed of the LA, BL and BM), the CC (represented by the CE) and the CMC (formed by the CO, ME and NLOT), which constitute the three main functional systems in the amygdala, were compared in representatives of five different rows of placental mammals with a different degree of brain development. The following species were analysed: the common shrew (Sorex araneus) from Insectivora, guinea pig (Cavia porcellus) from Rodentia, rabbit (Oryctolagus cuniculus) from Lagomorpha, silver fox (Vulpes vulpes) from Carnivora, and domestic pig (Sus scrofa) from Artiodactyla (Fig. 1). The animals used in the present study were carefully chosen. The common shrew was chosen because this animal represents basic and very primitive mammals with completely lissencephalic brains and very small proportions of neocortex in the whole brain volume (Frahm et al. 1982) which makes it a good reference point for interspecific comparisons. The guinea pig and rabbit were selected because they have more advanced brains than shrews (Roth & Dicke, 2005), are relatively closely related phylogenetically (Springer et al. 2004) and have a similar strategy to survive predators (herbivores; Fig. 1). The fox and pig were proposed because they have more advanced brains than the guinea pig and rabbit (Roth & Dicke, 2005), are more distantly related phylogenetically (Springer et al. 2004) and have a quite different strategy to survive (predator vs. victim; Fig. 1). It is of interest to assess whether the conditions presented above, such as similar survival strategy and/or vicinity in the phylogenetic tree, have any impact on the morphological characteristics of the amygdala.
Figure 1.

Relationships of the orders of crown Eutheria as revealed by molecular phylogenetics, derived and modified from Springer et al. (2004). The established higher‐level clades are Afrotheria (in red), Xenarthra (in green), Euarchontoglires (in blue) and Laurasiatheria (in brown). Species examined in the present study were assigned to appropriate mammalian clades.
Material and methods
Experimental animals
The present study was performed using 30 series of 50‐μm thick, Nissl‐stained paraffin sections from the large brain collection of the Department of Comparative Anatomy of the University of Warmia and Mazury in Olsztyn. The sections selected for this study were obtained from adult animals which were representatives of five different rows of placental mammals with a different degree of phylogenetic brain development. There were no signs of damage to the nervous system in any of these brains according to the annotations attached. The following species were tested: the common shrew (Sorex araneus) from Insectivora, guinea pig (Cavia porcellus) from Rodentia, rabbit (Oryctolagus cuniculus) from Lagomorpha, silver fox (Vulpes vulpes) from Carnivora, and domestic pig (Sus scrofa) from Artiodactyla. The brain weights of the species tested were as follows: common shrew 0.164 ± 0.011 g; guinea pig 3.96 ± 0.24 g; rabbit 9.87 ± 0.68 g; silver fox 49.76 ± 3.17 g; and domestic pig 178.34 ± 14.32 g. Six individuals from each species were analysed.
Histology
To prepare the Nissl‐stained paraffin sections, each brain was immersed in 10% buffered formalin for at least 12 weeks prior to further processing. After that time, the whole brains of the common shrews, guinea pigs and rabbits as well as left and right hemispheres from the foxes and pigs were dehydrated in a graded series of ethanol, embedded in paraffin and coronally sectioned at a thickness of 50 μm using a microtome (Leica, Wetzlar, Germany). The sections were then processed for routine Nissl staining, i.e. all sections were deparaffinized, fully rehydrated prior to the Nissl staining, stained with a 0.1% solution of cresyl violet brought to pH 4 with glacial acetic acid, dehydrated again in alcohol, cleared in xylene, and coverslipped with Canadian balsam. Stained sections were analysed cytoarchitectonically and morphometrically with a calibrated image analysis system, consisting of a computer equipped with morphometric software and a microscope (BX51; Olympus, Japan) coupled with a digital camera (CC‐12; Soft Imaging System, Germany). The morphometric software included Cell‐F software (Olympus) and Reconstruct software (http://synapses.clm.utexas.edu/; Fiala & Harris, 2001; Fiala, 2005). The sequence of the successive operations in a single animal is described in detail below.
Delineation of the amygdala
The anatomical boundaries of the amygdala and its nuclei can be reliably defined across various species in Nissl‐stained material (Równiak et al. 2004, 2008; Równiak, 2013; Fig. 2). In all studied species the NLOT formed the rostral pole of the amygdala and it was easy to distinguish from neighbouring brain structures by its unique morphology, cellular structure and very darkly stained cells. This nucleus displays a clearly laminated structure with a broad molecular layer, a broad and very compact pyramidal layer with very darkly stained cells and a superficial layer composed of large multipolar cells. Each of these features strictly distinguishes the NLOT from medially located the ME with very small neurons, dorsally located the AAA with striatal‐like lightly stained cells and laterally located the anterior cortical nucleus with its blurred three layered structure and lighter and more loosely arranged neurons. The BLC forms a distinct and compact nuclear region in the amygdala and was sharply demarcated from neighbouring neurons by the external capsule laterally and the intermediate capsule medially in all studied species (Fig. 2). In the caudal portion the intermediate capsule is replaced by the ventral horn of the lateral ventricle. The borders between the BLC nuclei are also easy to recognize. In the rostral and middle portions of the amygdala, the BL is characterized by very large and darkly stained cells, which differ clearly from the smaller and more lightly stained cells in the dorsally located the LA and ventrally located the BM nucleus. In the caudal portion where cells in the BL become smaller and neurons in the LA become larger, both nuclei are more or less separated by transversally running bundles of fibres. The CE is demarcated sharply from the BLC by the intermediate capsule medially and by the internal capsule laterally (Fig. 2). Dorsally, the CE borders the putamen which has similar cellular structure but is easily to distinguish by a different cell arrangement and density. Ventrally the CE borders the ME, with much smaller and more tightly packed cells, and in the caudal portions both nuclei are sharply separated by fibres of the stria terminals. The ME has a unique cellular structure, characterized by very small and tightly packed cells. It is clearly demarcated from the medially located hypothalamus by the optic tract and from the laterally located BLC by the intermediate capsule (Fig. 2). The CO forms the ventral borders of both the amygdala and the hemisphere. It is easily recognized from the medially located the ME because of striking differences in the cellular structure and from the laterally located piriform cortex by its very distinct and darkly stained pyramidal layer. Dorsally, the CO borders the BM and the boundary between both nuclei is sometimes not easy to trace. These minor difficulties in delineating the boundary between the CO and BM, as well as other problems such as the rostral borders of the ME and CE were overcome by taking into consideration the borders in the adjacent sections. Moreover, since all the sections are serially aligned, the additional support in delineating the obscure portions in the amygdala provided thick digital sections (200–300 μm thick) composed from single 50‐μm digital sections (Fig. 3).
Figure 2.
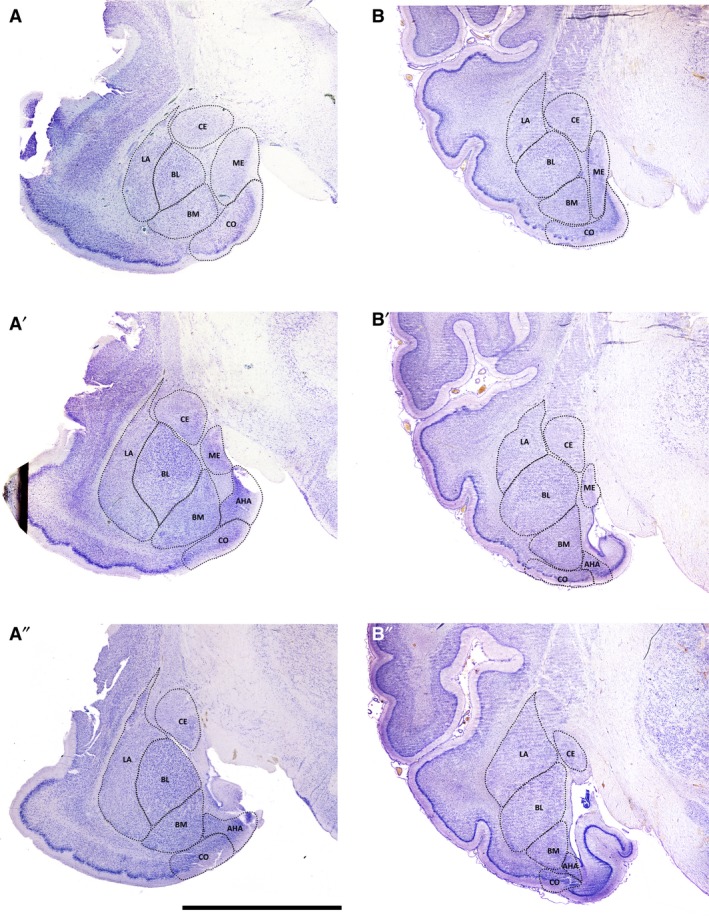
Low‐magnification photomicrographs of representative coronal sections through the fox and pig amygdala, illustrating the locations and boundaries of the main nuclei. A–A″, fox; B–B″, pig. Letter codes represent nuclei as follows: AHA, amygdalo‐hippocampal area; BL, basolateral; BM, basomedial; CE, central; CO, cortical; LA, lateral; ME, medial. Scale bar = 5 mm for A–A″ and 8 mm for B–B″.
Figure 3.

Process of the amygdala reconstruction. (A) A registered, digital slice with imposed contours of individual amygdala nuclei, (B) Boissonnat (1988) surface of ‘stack’ composed of five digital slices after conversion of the 2‐D contours to the 3D slabs in WRML format, (C) reconstructed basolateral complex (BLC), central complex (CC) and corticomedial complex (CMC) of the amygdala of the common shrew in WRML format, and (D) 200‐μm thick digital section after alignment of four 50‐μm thick digital slices of the common shrew brain. Letter codes represent nuclei as follows: BL, basolateral; BM, basomedial; CE, central, CO, cortical; LA, lateral; ME, medial. NLOT, nucleus of the lateral olfactory tract.
Three‐dimensional reconstructions
We performed three‐dimensional (3D) reconstructions of the BLC, CC and CMC in order to better appreciate the morphological and topological differences among the five mammalian species studied (Figs 3 and 4). The sections were viewed at low magnification 4× lens using an Olympus BX51 microscope. The partial microscopic images of a single section were digitally recorded by means of a camera and then subsequently joined together to form larger images comprising the whole amygdala and adjoining areas with various characteristic points (so‐called ‘digital slices’). In the case of the common shrew, every section in the series was analysed, in the case of the guinea pig and rabbit, every second section was analysed, in the case of the fox and pig, every fourth section was analysed.
Figure 4.

Relationships among the basolateral complex (BLC, blue), central complex (CC, yellow) and corticomedial complex (CMC, green) of the amygdala in the common shrew, guinea pig, rabbit, silver fox and pig. Top row: three‐dimensional reconstructions of the BLC, CC and CMC in the series of animals studied. Back view. Middle row: Proportions among the BLC, CC and CMC according to the percentage of volume occupied by each of these regions in the total volume of the amygdala. Bottom row: Proportions among the BLC, CC and CMC according to the percentage of neurons from these regions in the total cell population of the amygdala. Note progression of BLC volume and population and size regression of CMC according to both these variables in the animal series. Note also that the CC is more or less conserved across the species studied.
All the digital slices recorded from a single animal were finally imported into the Reconstruct software, where they were transformed into one multi‐sliced 3D image (a so‐called ‘stack’). In this kind of 3D dataset the digital slices were the consecutive serial sections oriented perpendicular to the long axis of the amygdala and covering the whole rostrocaudal extent of it. In the next step, all digital slices in the stack were aligned according to the Generalized Procrustes Analysis (GPA) by means of the Reconstruct procedure that superimposes the landmark configurations using the least‐squares estimates for the translation and rotation parameters (Bookstein, 1986; Rohlf & Slice, 1990; Rohlf, 1999). To achieve maximum precision, the slices were registered in pairs. The first image in the pair was the reference slice for the second slice. The landmark configurations were generated manually on both slices in the pair. The data consisted then of the point’s coordinates in the reference slice and the corresponding landmarks in the unregistered target slice. The second slice in the pair was translated and rotated into alignment based on these landmarks with the help of the built‐in Reconstruct GPA procedure. After registration the second slice in the pair was the reference slice in the next pair. The sequence was then as follows: 1–2, 2–3, 3–4 ….45–46.
After registration, on each digital slice the boundaries of the seven individual amygdaloid nuclei were manually outlined with three different colours using a mouse‐driven cursor (Fig. 3). The LA, BL and BM comprising the BLC were outlined in blue, the CE, which represents the CC was marked as yellow and the CO, ME and NLOT forming the CMC were contoured in green (Fig. 3). All the outlines were drawn under the control of the light microscope. The definite stack was then composed of the serially aligned raw images, and blue, yellow and green contours, i.e. the outlined structures of the amygdala, were incorporated. In the last step, the Reconstruct software transformed the two‐dimensional (2D) contours into the 3D slabs and, on the basis of these slabs, it generated a surface reconstruction of the BLC, CC and CMC using the Boissonnat (1988) method (Figs 3 and 4). The 3D slabs are 3D representations in which each 2D contour is given a single section thickness. In this representation, a contour forms a coloured slab in space. A Boissonnat surface is generated from the 3D slabs and is a 3D representation of the surface of an object (nucleus) formed by a set of 3D slabs with a given name and colour. The final 3D reconstruction images presented in this study were rendered in blender software v. 2.63 (open‐source freeware, http://www.blender.org). The 3D reconstructions of the amygdala, BLC, CC or CMC for a single animal was simply a sum of all the serially aligned slabs (Figs 3 and 4).
Stereological analyses
Volume measurements and neuron counts were carried out using an Olympus BX51 microscope equipped with microcator and Reconstruct and Cell‐F software.
Volume measurements
Volumetric measurements were generated using the calibrated Reconstruct software during the process of 3D reconstruction. To evaluate the volume of a single amygdaloid nucleus (Vo), the volumes of 3D slabs (Vn) with the same name were totalled using the Cavalieri formula (West & Gundersen, 1990).
Each 3D slab contributes the product of its enclosed area (as computed in the Trace List) times the section thickness:
The total volume of the BLC was the sum of the volumes of the LA, BL and BM. The total volume of the CC was the volume of the CE. The total volume of the CMC was the sum of the volumes of the CO, ME and NLOT. The total volume of the amygdala presented in this study was the sum of the volumes of the BLC, CC and CMC.
Estimation of numerical density
The numerical density of cells in a single amygdaloid nucleus was estimated using the optical dissector method described in detail by West and Gundersen (1990). According to a systematic random scheme, the optical dissector sampling was performed on optical sections (obtained with a ×40 objective) onto which the unbiased counting frame of known area (347.6 µm × 260.7 µm) was superimposed. Only the neurons with distinct nuclei which did not intersect the forbidden boundary lines of the counting frame were included in counts. To obtain the best accuracy, at least 2000 neurons in each of the amygdaloid nuclei per specimen (animal) were counted. The average density of neurons in the amygdala of the species demonstrated in the present study was the mean of values obtained in the seven individual amygdaloid nuclei.
Estimation of the total number of neurons
The total number of neurons in a single nucleus was calculated by multiplying estimates of the nuclear volume by the numerical density in it (West & Gundersen, 1990).
where Vo is the total volume of the structure and is the numerical density of this structure. The total number of neurons in the whole amygdala was achieved by adding the numbers from seven single amygdaloid nuclei. The same idea was adopted for calculating neuronal numbers in the BLC, CC and CMC. Thus, the total number of neurons in the BLC was the sum of neuron numbers in the LA, BL and BM. The total number of neurons in the CC was the neuron number in the CE. The total number of neurons in the CMC was the sum of the neuron numbers in the CO, ME and NLOT.
Data evaluation
The changes in size values (volume and total number of neurons) of the whole amygdala, BLC, CC and CMC were analysed with three different systems of reference: (1) the size values of the whole amygdala, BLC, CC and CMC in the species were evaluated in relation to corresponding values in the common shrew (scaling factors in Tables 1, 2 and 3); (2) the size values of the BLC, CC and CMC in the species were evaluated in relation to the values for the whole amygdala in this species (percentages in Tables 2 and 3; Fig. 4); and (3) the size values of the whole amygdala, BLC, CC and CMC were evaluated in relation to total brain weight (Fig. 5). In this case the system of double logarithmic coordinates had to be adopted to save space (log volume/total number of neurons ~ log brain weight).
Table 1.
Morphometric parameters of the whole amygdala in the studied mammalian species.
| Species | Volume, mm3 | Δ | Density of neurons, N mm−3 | Δ | Total number of neurons, N | Δ |
|---|---|---|---|---|---|---|
| Common shrew | 0.66 ± 0.08 | 1 | 241931.9 ± 10210.85 | 1 | 161248 ± 18111.13 | 1 |
| Guinea pig | 9.89 ± 0.88 | 14.98 | 94889.62 ± 5804.13 | 0.39 | 851535.6 ± 69593.96 | 5.28 |
| Rabbit | 21.19 ± 2.22 | 32.11 | 59076.88 ± 4843.43 | 0.24 | 1176029.3 ± 123982 | 7.29 |
| Silver fox | 70.2 ± 5.46 | 106.36 | 39267.96 ± 2535.75 | 0.16 | 2215933 ± 164957.8 | 13.74 |
| Pig | 165.2 ± 14.89 | 250.30 | 28475.78 ± 2173.10 | 0.12 | 4149779 ± 324085 | 25.74 |
Table 2.
The volumetric values of basolateral complex, central complex and corticomedial complex of the amygdala in the studied mammalian species.
| Species | Volume, mm3 | Percentage of volume1, % | ||||||||||
|---|---|---|---|---|---|---|---|---|---|---|---|---|
| BLC | Δ | CC | Δ | CMC | Δ | BLC | Δ | CC | Δ | CMC | Δ | |
| Common shrew | 0.26 ± 0.03 | 1 | 0.12 ± 0.02 | 1 | 0.29 ± 0.03 | 1 | 38.66 ± 3.46 | 1 | 17.97 ± 1.65 | 1 | 43.37 ± 3.32 | 1 |
| Guinea pig | 5.25 ± 0.46 | 20.46* | 1.4 ± 0.11 | 11.67** | 3.24 ± 0.24 | 11.29** | 53.06 ± 4.02 | 1.37 | 14.13 ± 1.19 | 0.79 | 32.81 ± 2.42 | 0.76 |
| Rabbit | 10.55 ± 1.02 | 41.09* | 3.8 ± 0.32 | 31.67 | 6.83 ± 0.51 | 23.81** | 49.8 ± 2.37 | 1.29 | 17.96 ± 2.14 | 1 | 32.25 ± 2.73 | 0.74 |
| Silver fox | 42.19 ± 3.67 | 164.31* | 9.66 ± 1.04 | 80.50** | 18.34 ± 1.55 | 63.92** | 60.11 ± 3.68 | 1.55 | 13.75 ± 1.07 | 0.77 | 26.14 ± 1.86 | 0.60 |
| Pig | 97.49 ± 8.26 | 379.66* | 24.97 ± 2.13 | 208.08 | 42.74 ± 3.49 | 148.94** | 59.04 ± 3.52 | 1.53 | 15.07 ± 1.24 | 0.84 | 25.89 ± 2.19 | 0.60 |
Δ, scaling factor showing increment in relation to the values in the common shrew; BLC, basolateral complex; CC, central complex; CMC, corticomedial complex.
Note that scaling factors for the BLC were significantly higher than those for the whole amygdala in the species. Note also that scaling factors for the CMC were significantly below the mean.
Value above the mean for the whole amygdala.
Value below the mean for the whole amygdala.
1 P < 0.05.
Table 3.
The total number of neurons in basolateral complex, central complex and corticomedial complex of the amygdala in the studied mammalian species.
| Species | Total number of neurons (N) | Percentage of neurons (%) | ||||||||||
|---|---|---|---|---|---|---|---|---|---|---|---|---|
| BLC | Δ | CC | Δ | CMC | Δ | BLC | Δ | CC | Δ | CMC | Δ | |
| Common shrew | 48519.7 ± 3769.9 | 1 | 30249.4 ± 3136.9 | 1 | 82478.8 ± 7099.2 | 1 | 30.01 ± 2.37 | 1 | 18.72 ± 2.12 | 1 | 51.27 ± 4.61 | 1 |
| Guinea pig | 347027.3 ± 26189.3 | 7.15* | 127667.8 ± 9853.4 | 4.22** | 376840.5 ± 31700.5 | 4.57** | 40.73 ± 3.30 | 1.36 | 15.01 ± 1.34 | 0.80 | 44.26 ± 3.87 | 0.86 |
| Rabbit | 408660.2 ± 34615.7 | 8.42* | 236519.3 ± 19294.1 | 7.82 | 530849.9 ± 42654.4 | 6.44** | 34.77 ± 1.93 | 1.16 | 20.09 ± 1.64 | 1.07 | 45.14 ± 2.25 | 0.88 |
| Silver fox | 934658.5 ± 76638.8 | 19.26* | 369243.0 ± 41620.2 | 12.21 | 912031.4 ± 86300.5 | 11.06** | 42.23 ± 2.59 | 1.41 | 16.64 ± 1.09 | 0.89 | 41.12 ± 3.29 | 0.80 |
| Pig | 1770904.8 ± 132961.9 | 36.50* | 691645.2 ± 58119.2 | 22.86 | 1687229.0 ± 123978.1 | 20.46** | 42.78 ± 3.18 | 1.43 | 16.58 ± 1.57 | 0.89 | 40.64 ± 3.41 | 0.79 |
Δ, scaling factor showing increment in relation to the variables in the common shrew. BLC, basolateral complex; CC, central complex; CMC, corticomedial complex.
Note that scaling factors for the BLC were significantly higher than those for the whole amygdala in the species. Note also that scaling factors for the CC and the CMC were respectively similar and significantly lower than the mean.
Value above the mean for the whole amygdala.
Value below the mean for the whole amygdala.
Figure 5.

Size values (volume and total number of neurons) plotted against brain weight. (A) Volumes of the whole amygdala, the basolateral complex (BLC), central complex (CC) and corticomedial complex (CMC) in relation to brain weight, (B) total numbers of neurons in the whole amygdala, BLC, CC and CMC in relation to brain weight. Note the difference between the slopes of the trend lines represented by the BLC, CC and CMC in (A) and (B). Note also that values on the x‐axis are arranged according to increasing brain weight, starting from common shrew through guinea pig and rabbit to fox and pig.
Statistical analysis
Statistical differences among various groups of data (scaling factors, percentages etc.) were analysed by one‐way anova followed by Tukey's post hoc test. If significant variation was present the Mann–Whitney U‐test was used. statistica v. 6.0 software was chosen to prepare the analyses (Statsoft, USA) and a P value < 0.05 was considered to be statistically significant. To evaluate the precision of all measurements, the coefficient of error was calculated. Values below 0.1 were achieved for all the variables examined.
Results
The morphometric data concerning the whole amygdala as well as the BLC, CC and CMC in the five studied species are listed in Tables 1, 2 and 3. In these tables, data from the common shrew are the reference points and all increments (scaling factors) seen in the tables are the ratio between the value in the common shrew and the value in the species being compared. The common shrew was chosen as a reference because this animal represents basic and very primitive mammals with very small proportions of neocortex in the whole brain volume (Frahm et al. 1982) which makes it a good reference point for interspecific comparisons. It is also important to note that data on the volumes, neuron density and neuron numbers in the whole amygdala and individual amygdaloid nuclei for the common shrew, guinea pig and rabbit have been previously published and are available in Równiak et al. (2004, 2005, 2007), whereas these data from the fox and pig have not been presented previously. Data on the volumes, neuron density and neuron numbers in the whole amygdala of the common shrew, guinea pig and rabbit were also used in the present study to calculate scaling factors in the five studied animals, data which have not been presented previously (Table 1).
Volume
Estimates of the amygdala volume revealed that the guinea pig amygdala is ~15 times larger than that of the common shrew, and the amygdala in the pig is ~2.5 times larger than in the fox (Table 1). Importantly, these size differences were not homogeneous among amygdala regions, and distinct amygdala parts defined in the present study exhibited different scaling factors (Table 2). For example, the BLC, CC and CMC were ~380, 208 and 149 times larger, respectively, in pigs than in shrews. Similar patterns of differences among scaling factors were also observed in the remaining animals (Table 2). In the rabbit, fox and pig, the scaling factor values for the BLC, CC and CMC were significantly different from each other (P < 0.05). In the guinea pig only, the scaling factor of the CC did not differ significantly from that of the CMC (P > 0.47). It is important to note that in all examined animals, scaling factors for the BLC were significantly higher than the mean scaling factors for the amygdala in these species (P < 0.05), while scaling factors values for the CMC were significantly below that mean (P < 0.05; Table 2). Scaling factors for the CC in the rabbit and domestic pig were close to the mean amygdala volume increase in these species (P > 0.91 and P > 0.10, respectively), while in the guinea pig and fox, they were significantly below the mean (P < 0.05).
Uneven scaling factors for the BLC, CC and CMC resulted in corresponding changes in volumetric proportions between these parts in the amygdala of studied species (Table 2; Fig. 4). For example, the percentages of the BLC volume in the amygdala systematically increased in the animals studied from ~39% in the common shrew to ~60% in the fox and pig (Table 2; Fig. 4). These percentages differed significantly from each other among the animals studied (P < 0.05), with the exception of these values in the amygdala of the fox and pig (P > 0.21). A positive correlation was found between the amygdala volume increase and the BLC volume, measured as a percentage of the total amygdala volume (r = 0.94, P < 0.014). In contrast, the BLC volume, measured as a percentage of the total amygdala volume in the amygdala systematically decreased in the series of animals studied (Table 2; Fig. 4). These percentages differed significantly from each other (P < 0.05), except for values in the guinea pig and rabbit (P > 0.41) as well as in the fox and pig (P > 0.71). A negative correlation was found between the amygdala volume and the percentage of CMC volume (r = −0.98, P < 0.003). The percentages of CC volume in the amygdala did not change significantly in this animal series, ranging between 14% and 18% (Table 2; Fig. 4). Moreover, these percentages did not differ significantly from each other in the series (P < 0.05); these values were similar in the common shrew vs. the rabbit (P > 0.97), the guinea pig vs. the fox (P > 0.43), and the guinea pig vs. domestic pig (P > 0.06). There was also no correlation between the amygdala volume and the percentage of CC volume (r = 0.58, P > 0.32).
Density of neurons
Density of neurons in the amygdala across studied species was inversely related to the volume of the amygdala (Table 1; r = −0.99, P < 0.001). For example, neuron density was approximately four times lower in the rabbit than in the common shrew, and approximately two times lower in the pig than in the rabbit (Table 1). Scaling factors were in a range from 1 in the common shrew to 0.12 in the pig (Table 1). The density of neurons also precisely differentiated the BLC, CC and CMC, with these parts differing significantly from each other with regard to this variable (P < 0.05). In all studied species, the density of neurons in the BLC was significantly lower than the mean cell density in the amygdala of these species (P < 0.05), whereas in the CMC it was always significantly higher than that mean (P < 0.05). The density of neurons in the CC was similar to the mean cell density in the amygdala of the species in most studied cases, except in the rabbit in which this value significantly exceeded the mean (P < 0.05) and the guinea pig in which this value was lower than the mean (P < 0.05).
Neuron numbers
The average number of neurons in the amygdala increased with increasing volume of the amygdala (r = 0.99, P < 0.001, Table 3). For example, the neuron number in the amygdala was more than eight times higher in the rabbit than in the common shrew, and approximately four times higher in the pig than in the rabbit (Table 3). The average number of neurons in the amygdala of the pig was almost 26 times larger than in the common shrew (Table 3). Again, size differences were not homogeneous among amygdala regions, and distinct amygdala parts exhibited different scaling factors (Table 3): the average number of neurons in the BLC, CC and CMC was ~37, 23 and 20 times larger, respectively, in pigs than in shrews. Similar differences among scaling factors were also observed in the remaining animals (Table 3). Moreover, in all studied animals, the scaling factor values for the BLC were significantly different from each other and those of the CC and CMC (P < 0.05), except for the rabbit which had a BLC value close to that of the CC (P > 0.50). In all animals studied, the scaling factors values for the CC did not differ significantly from those of the CMC (P > 0.47, P > 0.06, P > 0.13 and P > 0.39). Again, it is important to note that in all animals studied, scaling factor values for the BLC were significantly higher than the mean values for the amygdala in these species (P < 0.05), except for the rabbit in which the value was close to the mean (P > 0.11). In contrast, scaling factor values for the CMC were significantly lower in all studied species than the mean (P < 0.05). Scaling factor values for the CC in the rabbit, fox and domestic pig were similar to the mean values for the amygdala in these species (P > 0.32, P > 0.06 and P > 0.45, respectively), with the exception of the guinea pig, in which the value was significantly lower than the mean (P < 0.05).
Diversified increases in cell numbers in the BLC, CC and CMC in the animals studied are reflected in the different proportions in the amygdala of individual species (Table 3; Fig. 4). For example, the percentages of cell population of the BLC in the amygdala systematically increased in animals studied from ~30% in the common shrew to ~43% in the pig (Table 3; Fig. 4). These percentages differed significantly from each other among the animals studied (P < 0.05), with the exception of these values in the amygdala of the guinea pig vs. the fox (P > 0.16), the guinea pig vs. the pig (P > 0.06) and the fox vs. the pig (P > 0.60). No correlation was found between the percentage of the BLC cell population and the amygdala volume. In contrast, the percentages of CMC population in the amygdala clearly decreased in the series of animals studied (Table 3; Fig. 4). These percentages differed significantly from each other in all animals studied (P < 0.05), except for the guinea pig vs. the rabbit (P > 0.36) and the fox vs. the pig (P > 0.61). A negative correlation was found between the amygdala volume and the cell population of the CMC as a percentage (r = −0.97; P < 0.005). The percentages of CC population in the amygdala among the studied animals ranged between 15% and 20% (Table 3). These percentages differed significantly from each other among the animals studied (P < 0.05), except for these values in the fox vs. the pig (P > 0.92). There was no correlation between the amygdala volume and the percentage of CC population (r = 0.53, P > 0.47).
Allometric comparisons
Analysis of the changes in size values (volume and total number of neurons) of the whole amygdala, BLC, CC and CMC in relation to the total brain weight confirmed the results revealed by the scaling factors and percentages (Fig. 5). Thus, according to allometric scaling, all studied structures underwent size progression during phylogeny. However, within the amygdala the BLC showed significant size progression, the CMC had regressive tendencies, and the CC developed in a way similar to that of the whole amygdala (Fig. 5).
Discussion
To our knowledge, the present study provides quantitative information for the first time regarding the morphological characteristics of the three main amygdala regions (the BL, CC and CMC) in five mammalian species from insectivores through rodents and lagomorphs to carnivores and artiodactyls, arranged according to increasing size and complexity of the brain, to understand the basic principles of the evolution of the amygdala. The results show that in the present series of animals, the BLC underwent a gradual size increase in volume and number of neurons, whereas the CMC was gradually reduced according to both these variables. The CC was more or less conserved across the species studied. As the BLC, CC and CMC roughly represent three main functional systems (frontotemporal, autonomic and olfactory), respectively, in the amygdala (Swanson & Petrovich, 1998) it seems that this brain region does not evolve as a single unit but rather these three functional systems evolved independently. Such a mechanism suggests mosaic‐like evolution and is consistent with the view that brain structures with major anatomical and functional links evolve together independently of evolutionary changes in other unrelated structures (Barton & Harvey, 2000). For example, the gradual size progression of the BLC parallels the size progression of the neocortex (Frahm et al. 1982), with which it is strongly anatomically and functionally linked (Swanson & Petrovich, 1998; Pitkänen et al. 2000). The CMC is strongly connected to the olfactory brain regions (Swanson & Petrovich, 1998; Pitkänen et al. 2000) and all these structures follow the same regression course (Baron et al. 1987). The CC is connected mainly to the visceral and autonomic systems (Swanson & Petrovich, 1998) which are presumed to be conserved throughout the phylogeny (Stephan et al. 1987), and the CC follows the same pattern. By contrast, striking similarity of the amygdala in the guinea pig and the rabbit, which are members of Euarchonta (Springer et al. 2004), as well as in the fox and pig, members of Laurasiatheria (Springer et al. 2004), suggests that there must be another and more general mechanism shaping the morphology of the amygdala and whole brain (Finlay & Darlington, 1995).
The results of the present study show that, in this series of animals, the BLC undergoes gradual size progression in volume and number of neurons, which causes a mosaic‐like reorganisation of the amygdala such that the BLC volume and neuron percentages systematically increase during phylogeny. The size progression of the BLC and re‐modelling of the amygdala in mosaic‐like fashion was previously reported by Stephan et al. (1987), who compared Insectivora and Primates, and by Chareyron et al. (2011) in rats, monkeys and humans. Moreover, mosaic‐like re‐modelling of the BLC was also described in a study comparing monkeys and humans (Barger et al. 2012). The present results fill the gap between Insectivora and Primates and cover the middle part of the phylogenetic tree with regard to amygdala and brain evolution. There is accumulating evidence that the evolutionary success of the BLC parallels the dramatic size progression of the neocortex during mammalian phylogeny (Stephan et al. 1987; Chareyron et al. 2011), and that both the BLC and neocortex evolved together because of their common anatomical (McDonald, 1992; Washburn & Moises, 1992; Rainnie et al. 1993) and functional (Swanson & Petrovich, 1998; Pitkänen et al. 2000; Sah et al. 2003) links. Indeed, cellular structure is similar in the BLC, claustrum and neocortex. For example, similarly to the neocortex, in the BLC there are two major cell classes: spiny pyramidal‐like projection neurons, which use glutamate as an excitatory neurotransmitter (Fuller et al. 1987; McDonald, 1996; Sah et al. 2003) and spine‐sparse non‐pyramidal interneurons, which use γ‐aminobutyric acid (GABA) as an inhibitory neurotransmitter (McDonald & Pearson, 1989; Kemppainen & Pitkänen, 2000). Although these cells do not exhibit a laminar or columnar organisation in the BLC, their anatomical and electrophysiological characteristics are remarkably similar to those of their counterparts in the neocortex (McDonald, 1992; Washburn & Moises, 1992; Rainnie et al. 1993). Moreover, in rats, cats and monkeys, the LA, BL and BM are the main recipients and originators of neocortical‐amygdala connections (Krettek & Price, 1977; McDonald, 1998; Pitkänen et al. 2000). However, although cortical projections to the amygdala are organised similarly in all mammalian species, there are important species differences in the extent of convergence of cortical projections in the primate vs. the non‐primate amygdala (McDonald, 1998). Similarly, the efferent projections from the amygdala to the neocortex are more substantial in primates. For example, the amygdala projects to primary sensory areas in monkeys (Amaral & Price, 1984; Yukie, 2002) and in humans (Catani et al. 2003), but similar projections are apparently not present in rats (Krettek & Price, 1977). Thus, it is quite reasonable to state that the expansion of neocortical areas and the greater complexity of neocortical information reaching the BLC may be responsible for a greater development of the BLC interconnected with the neocortex. It is worth mentioning that according to Swanson & Petrovich (1998) both the BLC and neocortex may also have a common embryological origin and that at least a large part of BLC and claustrum are actually a ventromedial extension of the temporal and frontal cortex. This concept, although interesting, has several limitations. Studies in reptiles suggest that the BLC could not evolve from the deep layers of the temporal cortex (Lanuza et al. 1998; Martínez‐Marcos et al. 1999). Moreover, according to Puelles et al. (2000) and Martínez‐García et al. (2002) the LA and BM, which are the most developed in monkeys and humans (Chareyron et al. 2011; Barger et al. 2012), similarly to the CO, are derivatives of the ventral/lateral pallium (olfactory cortex) rather than the dorsal pallium (neocortex).
In contrast, in the present study, the CMC showed gradual size regression in volume and number of neurons, with the volume and neurons percentages systematically decreasing in the amygdala during phylogeny. Reductions of the ME and NLOT with increasing complexity of the brain have been reported (Stephan et al. 1987; Chareyron et al. 2011), but the CO was never previously directly compared. According to embryological and cytoarchitectonic studies the CO and NLOT are in fact part of the olfactory cortex (forming the caudal end of the piriform lobe) (Swanson & Petrovich, 1998; Puelles et al. 2000; Martínez‐García et al. 2002), partly because they lie on the surface of the hemispheres ventrally to the rhinal sulcus and have a three‐layered organisation (Kevetter & Winans, 1981a, 1981b) with radially oriented pyramidal cells, and partly because they receive direct inputs from the main and accessory olfactory bulbs (Pitkänen et al. 2000). Although, the ME, according to homeobox gene expression patterns, is considered to be a ventral extension of the striatum (Swanson & Petrovich, 1998; Puelles et al. 2000), it is anatomically and functionally linked to the CO and NLOT because it has a laminated cellular structure and strong interconnections with the accessory olfactory bulb and CO (Kevetter & Winans, 1981a; Stephan et al. 1987). Functionally, the CMC forms association part of the olfactory system (accessory and main) (Swanson & Petrovich, 1998), managing pheromonal cues from the accessory olfactory bulb via the ME and COp (Kevetter & Winans, 1981a), and processing pure olfactory cues from the main olfactory bulb via the anterior cortical nucleus and periamygdaloid cortex (Kevetter & Winans, 1981b). As the olfactory regions (main olfactory bulb and other paleocortical areas) become smaller during phylogeny (Baron et al. 1983, 1987; Kavoi & Jameela, 2011) and projections from these regions are essentially organised in the same way in rodents and primates (Carmichael et al. 1994; Pitkänen et al. 2000; Ache & Young, 2005), except that they represent a smaller fraction of the total sensory inputs to the amygdala in primates than in rodents, it is not surprising that the relative proportion of CMC volume and neurons in the amygdala decreases in the course of mammalian evolution. Thus, similarly to the BLC, the relative reduction of the CMC parallels the regression tendencies of the main olfactory bulb (Baron et al. 1983) and other paleocortical areas (Baron et al. 1987) with which it is strongly interconnected. However, the ME and COp are a part of the vomeronasal system so the difference in size of the CMC should also be related at least in a part to the different degree of development of the vomeronasal system in the different species studied. Unfortunately, such interspecific comparisons were never conducted so data are lacking and interdependence is not possible or difficult to evaluate. In microsmatic humans and Old World simians, which have a reduced vomeronasal system and are devoid of the accessory olfactory bulbs, the CMC and ME are strongly reduced although still well preserved (Stephan et al. 1982, 1987; Chareyron et al. 2011). A similar situation was reported in the anosmatic porpoise (Breathnach & Goldby, 1954). In both these species the main olfactory system is also substantially reduced (Breathnach & Goldby, 1954; Baron et al. 1983), which may have also had a huge impact on CMC reduction. All the species in the present study are macrosmatic, however, and have well developed vomeronasal and main olfactory systems (Negus, 1956; Kostov, 2007; Salazar & Sánchez Quinteiro, 2009) and a much better developed CMC than that of humans or porpoises.
The CC seems to be fairly constant in volume and number of neurons in the present study, with the proportions more or less similar across studied species. Similar impressions were previously reported by Stephan et al. (1987) comparing the CE + ME + AAA complex in Insectivora and Primates, however, the ME was reduced according to these authors, so the CE nucleus seems to be the only stabilizing component. Chareyron et al. (2011) reported reduction of the CE nucleus in volume and neuron number when comparing rats, monkeys and humans. There is general consensus in the literature that the CE is a ventral extension of the striatum (Swanson & Petrovich, 1998; Puelles et al. 2000; Martínez‐García et al. 2002), with striatal‐like, GABAergic neurons (Swanson & Petrovich, 1998) and specialised projections to the visceral and autonomic centres in the hypothalamus and brainstem (Pitkänen et al. 2000). Because major targets of the CE, hypothalamic and brainstem nuclei are themselves quite stable during phylogeny, the fairly constant size of the CE in terms of volume and neuron number scaling in various mammalian species is not surprising (Stephan et al. 1987; Carlo et al. 2010). There are other stabilizing factors which keep the size of the CE quite constant. For example, similarly to the BLC, this nucleus receives a substantial amount of sensory information from a large variety of neocortical areas, such as the visual, auditory and somatosensory cortices as well as the medial and lateral prefrontal cortices, including the infralimbic cortex and dorsal agranular insula (Pitkänen et al. 2000). It also receives inputs from the BLC, and specifically the LA (Pitkänen et al. 2000), which, similarly to the neocortex, became enlarged during mammalian phylogeny (Stephan et al. 1987; Chareyron et al. 2011).
Although the present results indicate that the amygdala evolves in mosaic‐like fashion (Barton & Harvey, 2000; Montgomery et al. 2016) there is also a strong indication that this mechanism is accompanied by another mechanism with more general rules shaping the morphology of the amygdala and the brain during mammalian phylogeny (Finlay & Darlington, 1995; Herculano‐Houzel et al. 2014). This impression is drawn from remarkable morphometric similarities of the amygdala in the guinea pig and rabbit as well as in the fox and pig. For example, the BLC volume percentages in the guinea pig and rabbit are 53.06% and 49.8%, respectively, while in the CMC they are 32.81% and 32.25%, respectively. When the percentages of neurons are compared similarity is less evident, however, values for the CMC are very similar (44.26% and 45.14%). When the fox and pig are compared, the percentage values for the BLC, CC and CMC for both volume and neurons are remarkably similar. For example, volumetric percentages for BLC, CC and CMC, respectively, in the fox and pig are as follows: 60.11% and 59.04%, 13.75% and 15.07%, 26.14% and 25.89%. With regard to number of neurons, the percentages in the fox and pig are 42.23% and 42.78% for the BLC, 16.64% and 16.58% for the CC and 41.12% and 40.64% for the CMC. The guinea pig and rabbit are members of the Euarchonta (Springer et al. 2004), they are close related phylogenetically and they have similar strategy for survival (herbivores), so similarity in the morphology of the amygdala was to be expected; however, in the case of the fox and pig, which are distantly related phylogenetically and members of the Laurasiatheria (Springer et al. 2004) with quite different survival strategies, the remarkable similarity in the morphology of the amygdala is quite surprising. The explanation may be drawn from the conclusions of Finlay and Darlington (1995) who compared 131 species of primates, bats and insectivores and stated that there are linked regularities in the development and evolution of mammalian brains. Such linked regularities, which may partially explain remarkable morphometric similarities of the amygdala in animals from different clades, were recently proposed by Herculano‐Houzel et al. (2014). These authors, who performed direct analysis of the numbers of neurons in each structure and their relationship to the mass of these structures across 41 mammalian species from six clades, suggested that the diversity in mammalian brain organisation in regard to the relative and absolute size (mass or volume) of its structures can be explained by clade‐specific mosaic evolution in the context of otherwise concerted scaling (Herculano‐Houzel et al. 2014).
In conclusion, the present results indicate that the amygdala does not evolve as a single unit but rather that the three main functional systems evolved independently, confirming the theory that brain structures with major anatomical and functional links evolve together independently of evolutionary changes in other unrelated structures. However, the remarkable morphometric similarity of the amygdala in the guinea pig and rabbit as well as in the fox and pig (all of them from different clades) suggests that there must be also another and more general mechanism shaping the morphology of the amygdala and the whole brain during the course of evolution. The gradual nature of size changes of BLC and CMC strengthen this impression.
Conflict of interest
None declared.
Data availability statement
Data are available from the authors on request.
References
- Ache BW, Young JM (2005) Olfaction: diverse species, conserved principles. Neuron 48, 417–430. [DOI] [PubMed] [Google Scholar]
- Adolphs R (2003) Is the human amygdala specialized for processing social information? Ann N Y Acad Sci 985, 326–340. [DOI] [PubMed] [Google Scholar]
- Amaral DG, Price JL (1984) Amygdalo‐cortical projections in the monkey (Macaca fascicularis). J Comp Neurol 230, 465–496. [DOI] [PubMed] [Google Scholar]
- Amaral DG, Bauman MD, Capitanio JP, et al. (2003) The amygdala: is it an essential component of the neural network for social cognition? Neuropsychologia 41, 517–522. [DOI] [PubMed] [Google Scholar]
- Barger N, Stefanacci L, Schumann CM, et al. (2012) Neuronal populations in the basolateral nuclei of the amygdala are differentially increased in humans compared with apes: a stereological study. J Comp Neurol 520, 3035–3054. [DOI] [PMC free article] [PubMed] [Google Scholar]
- Baron G, Frahm HD, Bhatnagar KP, et al. (1983) Comparison of brain structure volumes in insectivora and primates. III. Main olfactory bulb (MOB). J Hirnforsch 24, 551–568. [PubMed] [Google Scholar]
- Baron G, Stephan H, Frahm HD (1987) Comparison of brain structure volumes in Insectivora and primates. VI. Paleocortical components. J Hirnforsch 28, 463–477. [PubMed] [Google Scholar]
- Barton RA, Harvey PH (2000) Mosaic evolution of brain structure in mammals. Nature 405, 1055. [DOI] [PubMed] [Google Scholar]
- Baum MJ (2009) Sexual differentiation of pheromone processing: links to male‐typical mating behavior and partner preference. Horm Behav 55, 579–588. [DOI] [PMC free article] [PubMed] [Google Scholar]
- Boissonnat J‐D (1988) Shape reconstruction from planar cross sections. Comput Vis Graph Image Process 44, 1–29. [Google Scholar]
- Bookstein FL (1986) Size and shape spaces for landmark data in two dimensions. Stat Sci 1, 181–222. [Google Scholar]
- Breathnach AS, Goldby F (1954) The amygdaloid nuclei, hippocampus and other parts of the rhinencephalon in the porpoise (Phocaena phocaena). J Anat 88, 267–291. [PMC free article] [PubMed] [Google Scholar]
- Bupesh M, Legaz I, Abellán A, et al. (2011) Multiple telencephalic and extratelencephalic embryonic domains contribute neurons to the medial extended amygdala. J Comp Neurol 519, 1505–1525. [DOI] [PubMed] [Google Scholar]
- Carlo CN, Stefanacci L, Semendeferi K, et al. (2010) Comparative analyses of the neuron numbers and volumes of the amygdaloid complex in old and new world primates. J Comp Neurol 518, 1176–1198. [DOI] [PubMed] [Google Scholar]
- Carmichael ST, Clugnet MC, Price JL (1994) Central olfactory connections in the macaque monkey. J Comp Neurol 346, 403–434. [DOI] [PubMed] [Google Scholar]
- Catani M, Jones DK, Donato R, et al. (2003) Occipito‐temporal connections in the human brain. Brain 126, 2093–2107. [DOI] [PubMed] [Google Scholar]
- Chareyron LJ, Lavenex PB, Amaral DG, et al. (2011) Stereological analysis of the rat and monkey amygdala. J Comp Neurol 519, 3218–3239. [DOI] [PMC free article] [PubMed] [Google Scholar]
- Feinstein JS, Adolphs R, Damasio A, et al. (2011) The human amygdala and the induction and experience of fear. Curr Biol 21, 34–38. [DOI] [PMC free article] [PubMed] [Google Scholar]
- Fiala JC (2005) Reconstruct: a free editor for serial section microscopy. J Microsc 218, 52–61. [DOI] [PubMed] [Google Scholar]
- Fiala JC, Harris KM (2001) Extending unbiased stereology of brain ultrastructure to three‐dimensional volumes. J Am Med Inform Assoc 8, 1–16. [DOI] [PMC free article] [PubMed] [Google Scholar]
- Finlay BL, Darlington RB (1995) Linked regularities in the development and evolution of mammalian brains. Science 268, 1578–1584. [DOI] [PubMed] [Google Scholar]
- Frahm HD, Stephan H, Stephan M (1982) Comparison of brain structure volumes in Insectivora and Primates. I. Neocortex. J Hirnforsch 23, 375–389. [PubMed] [Google Scholar]
- Fuller TA, Russchen FT, Price JL (1987) Sources of presumptive glutamergic/aspartergic afferents to the rat ventral striatopallidal region. J Comp Neurol 258, 317–338. [DOI] [PubMed] [Google Scholar]
- Gutiérrez‐Castellanos N, Martínez‐Marcos A, Martínez‐García F, et al. (2010) Chemosensory function of the amygdala. Vitam Horm 83, 165–196. [DOI] [PubMed] [Google Scholar]
- Herculano‐Houzel S, Manger PR, Kaas JH (2014) Brain scaling in mammalian evolution as a consequence of concerted and mosaic changes in numbers of neurons and average neuronal cell size. Front Neuroanat 8, 77. [DOI] [PMC free article] [PubMed] [Google Scholar]
- Hong W, Kim D‐W, Anderson DJ (2014) Antagonistic control of social versus repetitive self‐grooming behaviors by separable amygdala neuronal subsets. Cell 158, 1348–1361. [DOI] [PMC free article] [PubMed] [Google Scholar]
- Janak PH, Tye KM (2015) From circuits to behaviour in the amygdala. Nature 517, 284–292. [DOI] [PMC free article] [PubMed] [Google Scholar]
- Kavoi BM, Jameela H (2011) Comparative morphometry of the olfactory bulb, tract and stria in the human, dog and goat. Int J Morphol 29, 939–946. [Google Scholar]
- Kemppainen S, Pitkänen A (2000) Distribution of parvalbumin, calretinin, and calbindin‐D(28k) immunoreactivity in the rat amygdaloid complex and colocalization with gamma‐aminobutyric acid. J Comp Neurol 426, 441–467. [DOI] [PubMed] [Google Scholar]
- Kevetter GA, Winans SS (1981a) Connections of the corticomedial amygdala in the golden hamster. I. Efferents of the ‘vomeronasal amygdala’. J Comp Neurol 197, 81–98. [DOI] [PubMed] [Google Scholar]
- Kevetter GA, Winans SS (1981b) Connections of the corticomedial amygdala in the golden hamster. II. Efferents of the ‘olfactory amygdala’. J Comp Neurol 197, 99–111. [DOI] [PubMed] [Google Scholar]
- Kostov DL (2007) Vomeronasal organ in domestic animals (a short survey). Bulg J Vet Med 10, 53–57. [Google Scholar]
- Krettek JE, Price JL (1977) Projections from the amygdaloid complex to the cerebral cortex and thalamus in the rat and cat. J Comp Neurol 172, 687–722. [DOI] [PubMed] [Google Scholar]
- Lanuza E, Belekhova M, Martínez‐Marcos A, et al. (1998) Identification of the reptilian basolateral amygdala: an anatomical investigation of the afferents to the posterior dorsal ventricular ridge of the lizard Podarcis hispanica. Eur J Neurosci 10, 3517–3534. [DOI] [PubMed] [Google Scholar]
- Lanuza E, Novejarque A, Martínez‐Ricós J, et al. (2008) Sexual pheromones and the evolution of the reward system of the brain: the chemosensory function of the amygdala. Brain Res Bull 75, 460–466. [DOI] [PubMed] [Google Scholar]
- LeDoux JE (2000) Emotion circuits in the brain. Annu Rev Neurosci 23, 155–184. [DOI] [PubMed] [Google Scholar]
- LeDoux J (2003) The emotional brain, fear, and the amygdala. Cell Mol Neurobiol 23, 727–738. [DOI] [PMC free article] [PubMed] [Google Scholar]
- Maras PM, Petrulis A (2008) The posteromedial cortical amygdala regulates copulatory behavior, but not sexual odor preference, in the male Syrian hamster (Mesocricetus auratus). Neuroscience 156, 425–435. [DOI] [PMC free article] [PubMed] [Google Scholar]
- Martínez‐García F, Martínez‐Marcos A, Lanuza E (2002) The pallial amygdala of amniote vertebrates: evolution of the concept, evolution of the structure. Brain Res Bull 57, 463–469. [DOI] [PubMed] [Google Scholar]
- Martínez‐Marcos A, Lanuza E, Halpern M (1999) Organization of the ophidian amygdala: chemosensory pathways to the hypothalamus. J Comp Neurol 412, 51–68. [DOI] [PubMed] [Google Scholar]
- McDonald AJ (1992) Projection neurons of the basolateral amygdala: a correlative Golgi and retrograde tract tracing study. Brain Res Bull 28, 179–185. [DOI] [PubMed] [Google Scholar]
- McDonald AJ (1996) Glutamate and aspartate immunoreactive neurons of the rat basolateral amygdala: colocalization of excitatory amino acids and projections to the limbic circuit. J Comp Neurol 365, 367–379. [DOI] [PubMed] [Google Scholar]
- McDonald AJ (1998) Cortical pathways to the mammalian amygdala. Prog Neurogibol 55, 257–332. [DOI] [PubMed] [Google Scholar]
- McDonald AJ, Pearson JC (1989) Coexistence of GABA and peptide immunoreactivity in non‐pyramidal neurons of the basolateral amygdala. Neurosci Lett 100, 53–58. [DOI] [PubMed] [Google Scholar]
- Montgomery SH, Mundy NI, Barton RA (2016) Brain evolution and development: adaptation, allometry and constraint. Proc Biol Sci 283, pii: 20160433. 10.1098/rspb.2016.0433 [DOI] [PMC free article] [PubMed] [Google Scholar]
- Negus VE (1956) The organ of Jacobson. J Anat 90, 515–519. [PMC free article] [PubMed] [Google Scholar]
- Pabba M (2013) Evolutionary development of the amygdaloid complex. Front Neuroanat 7, 27. [DOI] [PMC free article] [PubMed] [Google Scholar]
- Pape H‐C, Pare D (2010) Plastic synaptic networks of the amygdala for the acquisition, expression, and extinction of conditioned fear. Physiol Rev 90, 419–463. [DOI] [PMC free article] [PubMed] [Google Scholar]
- Pitkänen A, Jolkkonen E, Kemppainen S (2000) Anatomic heterogeneity of the rat amygdaloid complex. Folia Morphol 59, 23. [PubMed] [Google Scholar]
- Puelles L (2017) Comments on the updated tetrapartite pallium model in the mouse and chick, featuring a homologous claustro‐insular complex. Brain Behav Evol 90, 171–189. [DOI] [PubMed] [Google Scholar]
- Puelles L, Kuwana E, Puelles E, et al. (2000) Pallial and subpallial derivatives in the embryonic chick and mouse telencephalon, traced by the expression of the genes Dlx‐2, Emx‐1, Nkx‐2.1, Pax‐6, and Tbr‐1. J Comp Neurol 424, 409–438. [DOI] [PubMed] [Google Scholar]
- Rainnie DG, Asprodini EK, Shinnick‐Gallagher P (1993) Intracellular recordings from morphologically identified neurons of the basolateral amygdala. J Neurophysiol 69, 1350–1362. [DOI] [PubMed] [Google Scholar]
- Rauch SL, Shin LM, Wright CI (2003) Neuroimaging studies of amygdala function in anxiety disorders. Ann N Y Acad Sci 985, 389–410. [DOI] [PubMed] [Google Scholar]
- Rohlf FJ (1999) Shape statistics: procrustes superimpositions and tangent spaces. J Classif 16, 197–223. [Google Scholar]
- Rohlf FJ, Slice D (1990) Extensions of the procrustes method for the optimal superimposition of landmarks. Syst Zool 39, 40–59. [Google Scholar]
- Roozendaal B, McEwen BS, Chattarji S (2009) Stress, memory and the amygdala. Nat Rev Neurosci 10, 423–433. [DOI] [PubMed] [Google Scholar]
- Roth G, Dicke U (2005) Evolution of the brain and intelligence. Trends Cogn Sci (Regul Ed) 9, 250–257. [DOI] [PubMed] [Google Scholar]
- Równiak M (2013) The amygdala in the guinea pig is sexually dimorphic—a morphometric study. Brain Res 1524, 44–53. [DOI] [PubMed] [Google Scholar]
- Równiak M, Szteyn S, Robak A (2003) A comparative study of the mammalian amygdala: a Golgi study of the basolateral amygdala. Folia Morphol 62, 331–339. [PubMed] [Google Scholar]
- Równiak M, Szteyn S, Robak A (2004) A morphometric study of the amygdala in the common shrew. Folia Morphol (Warsz) 63, 387–396. [PubMed] [Google Scholar]
- Równiak M, Robak A, Szteyn S, et al. (2005) A morphometric study of the amygdala in the guinea pig. Folia Morphol (Warsz) 64, 151–160. [PubMed] [Google Scholar]
- Równiak M, Robak A, Szteyn S, et al. (2007) The morphometric study of the amygdala in the rabbit. Folia Morphol (Warsz) 66, 44–53. [PubMed] [Google Scholar]
- Równiak M, Robak A, Bogus‐Nowakowska K, et al. (2008) Somatostatin‐like immunoreactivity in the amygdala of the pig. Folia Histochem Cytobiol 46, 229–238. [DOI] [PubMed] [Google Scholar]
- Sah P, Faber ESL, Lopez De Armentia M, et al. (2003) The amygdaloid complex: anatomy and physiology. Physiol Rev 83, 803–834. [DOI] [PubMed] [Google Scholar]
- Salazar I, Sánchez Quinteiro P (2009) The risk of extrapolation in neuroanatomy: the case of the mammalian vomeronasal system. Front Neuroanat 3, 22. [DOI] [PMC free article] [PubMed] [Google Scholar]
- Shabel SJ, Janak PH (2009) Substantial similarity in amygdala neuronal activity during conditioned appetitive and aversive emotional arousal. PNAS 106, 15031–15036. [DOI] [PMC free article] [PubMed] [Google Scholar]
- Springer MS, Stanhope MJ, Madsen O, et al. (2004) Molecules consolidate the placental mammal tree. Trends Ecol Evol 19, 430–438. [DOI] [PubMed] [Google Scholar]
- Stephan H, Baron G, Frahm HD (1982) Comparison of brain structure volumes in Insectivora and Primates. II. Accessory olfactory bulb (AOB). J Hirnforsch 23, 575–591. [PubMed] [Google Scholar]
- Stephan H, Frahm HD, Baron G (1987) Comparison of brain structure volumes in Insectivora and primates. VII. Amygdaloid components. J Hirnforsch 28, 571–584. [PubMed] [Google Scholar]
- Swanson LW, Petrovich GD (1998) What is the amygdala? Trends Neurosci 21, 323–331. [DOI] [PubMed] [Google Scholar]
- Washburn MS, Moises HC (1992) Muscarinic responses of rat basolateral amygdaloid neurons recorded in vitro. J Physiol 449, 121–154. [DOI] [PMC free article] [PubMed] [Google Scholar]
- West MJ, Gundersen HJG (1990) Unbiased stereological estimation of the number of neurons in the human hippocampus. J Comp Neurol 296, 1–22. [DOI] [PubMed] [Google Scholar]
- Yukie M (2002) Connections between the amygdala and auditory cortical areas in the macaque monkey. Neurosci Res 42, 219–229. [DOI] [PubMed] [Google Scholar]
Associated Data
This section collects any data citations, data availability statements, or supplementary materials included in this article.
Data Availability Statement
Data are available from the authors on request.