

Abstract
The purpose of this study was to examine whether immigrant parental stress predicts the risk of child maltreatment better than previously identified risk factors. Data were collected from 366 Korean immigrant parents who have at least one unmarried child (migrant or U.S. born child). Participants completed the Conflict Tactics Scales: Parent-Child version (CTSPC) and Immigrant Parental Stress Inventory (IPSI). A series of hierarchical multiple regression analyses were conducted to identify significant predictors for the risk of child maltreatment. The final model with immigrant parental stress significantly predicted the risk of child maltreatment better than the initial model including only previously identified risk factors. Immigrant parental stress was the strongest predictor of psychologically aggressive and neglectful behaviors. Implications for practice and recommendations for future research are suggested.
Keywords: Child maltreatment, Immigrant parents, Immigrant parental stress, Korean immigrants
Child welfare and child protective service agencies focus on the identification of risk factors that contribute to child maltreatment to determine whether the child is at risk of child maltreatment. These risk factors have been extensively studied and include the following: (1) Parent or caregiver factors: personality and psychological well-being, history of maltreatment, substance/drug abuse, attitudes and knowledge, age, whether or not parents are biological parents, whether or not a parent was reported to the CPS before; (2) Child factors: child’s age, child’s disabilities; (3) Family factors: family structure, marital conflict and domestic violence, stress, parent-child interaction; (4) Environmental factors: poverty, unemployment, social isolation, community characteristics (U.S. Department of Health and Human Services 2003).
Parental stress is central among the risk factors mentioned above, and stress can be considered as a broad construct that includes other risk factors. Hillson and Kupier (1994) argued that every factor identified as contributing to the risk of child maltreatment could be considered as a potential stressor. Webster-Stratton (1990) emphasized the need to consider stress as a broad construct that includes other factors (e.g., conflict, frustration, anxiety, depression, and emotional distress). Lazarus (2007) argued that previously used divergent and overlapping terms, “which reflected the adaptational problems imposed by difficult conditions of life, were brought together under the rubric of stress. Stress became the dominant concept uniting them” (p. 35). Under this viewpoint, stress can be understood as a term integrating individual factors identified as contributing to the risk of child maltreatment in isolation from other factors.
Many theoretical models that attempt to explain the etiology of child maltreatment highlight that stress is very important in predicting the risk of child maltreatment. In the transitional model, Wolfe (1999) maintained, “a parent’s response to the child is a function of the interaction between level of external stress and level of internal tolerance/coping” (p. 71). In the ecological model, Belsky (1993) argued that “There is no one pathway to these disturbances in parenting; rather, maltreatment seems to arise when stressors outweigh supports and risks are greater than protective factors” (p. 427). In the stress and coping model, Hillson and Kupier (1994) stated, “levels of caregiver stress may play a critical role in determining child maltreatment” (p. 261). In the social information processing model, Milner (1993) repeatedly suggested that a more comprehensive examination of factors relating to levels of caregiver stress may be a key element in formulating more explanatory models of child maltreatment.
Many empirical studies have also demonstrated a positive correlation between stress experienced by parents and child maltreatment (Rodriguez and Green 1997; Rodriguez and Richardson 2007; Spicer and Franklin 1994; Taylor et al. 2009). McDaniel and Slack (2005) found that major life events, such as moving to a new home, having a baby, or being arrested, increase the risk of a CPS investigation for child maltreatment. Some studies have suggested that higher levels of parenting stress were associated with child abuse potential (Burrell et al. 1994; Chan 1994; Crouch and Behl 2001). Similarly, Pinderhughes et al. (2000) found that family stress was associated with the parents’ use of physical or harsh punishment, which has been demonstrated to be related to the risk of child maltreatment (Koenig et al. 2000).
Immigrant Parental Stress
Examining parental stress is essential in assessing the risk of child maltreatment. Parental stress experienced by immigrant parents is different from that experienced by non-immigrant parents. Immigrant parents experience various difficulties caused by acculturative stress, the increase of acculturative gaps between immigrant parents and their children, the increase of marital conflicts, financial hardships, and lack of social support (Berry 2001; Dinh and Nguyen 2006; Levitt et al. 2005; Tseng and Fuglini 2000; Ying and Tracy 2004). Yoo and Vonk (2012) developed the Immigrant Parental Stress Inventory (IPSI) to comprehensively assess additional and unique stress experienced by immigrant parents within their two distinctively different language and cultural contexts. According to this study, immigrant parental stress can be largely categorized into two factors: (1) immigrant life stress and (2) parent-child acculturative gap stress. Immigrant life stress indicates various adaptational difficulties caused by immigration. Parent-child acculturative gap stress stands for immigrant parents’ difficulties in the interaction with their child caused by parent-child acculturative gap. The specific examples of immigrant parental stress are provided in Table 1.
Table 1.
Examples of immigrant parental stress
| Immigrant Parental Stress Inventory (IPSI) | Immigrant Life Stress (ILS) | Parent-Child Acculturative Gap Stress (P-CAGS) |
|---|---|---|
| Example items in the IPSI | - I feel looked down on because of my poor English. | - My child complains that I demand him or her to follow my traditional values. |
| - Taking care of everyday chores for public/social service agencies is difficult for me. | - My child’s cultural values conflict with my own cultural values. | |
| - Getting a job as an immigrant is difficult. | - I feel like my child does not respect me as a parent. | |
| - I feel that I am not treated equally because of my different ethnic and cultural backgrounds. | - I feel my child is embarrassed of me in front of his/her friends. | |
| - Raising my child is hard because I cannot get help from my parents or relatives. | - It is difficult for me to have deep communication with my child because of language barriers. |
This study aims to examine whether immigrant parental stress is a significant predictor of the risk factors of child maltreatment after controlling for the other risk factors contributing to child maltreatment, which have been identified in existing studies. The conceptual framework for this study is illustrated in Fig. 1.
Fig. 1.
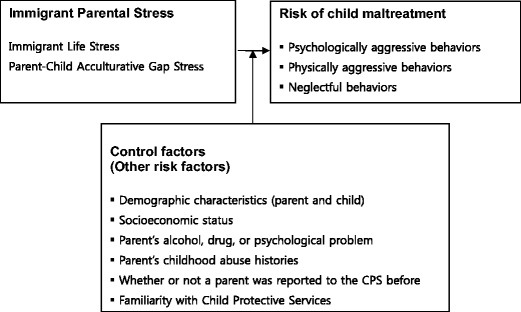
Conceptual framework for the study
Methods
Sample and Procedure
After receiving the approval from the institutional review board (IRB), 366 Korean immigrant parents were recruited using a nonprobability sampling method. The study sample included only those parents who have at least one child living with them (migrant or U.S. born child). They were asked to participated in the study through Korean schools, Korean churches, and Korean companies located in the Southeastern Metropolitan area. The parents ranged in age from 29 to 64 years (M = 42.30, SD = 6.44), and the child ranged in age from 0 to 30 years (M = 12.32, SD = 6.14). Table 2 describes the characteristics of sample.
Table 2.
Demographic and socioeconomic Characteristics of sample (N = 366)
| Characteristic | n | % |
|---|---|---|
| Gender | ||
| Male | 93 | 25.8 |
| Female | 267 | 74.2 |
| Marital Status | ||
| Married (including cohabitation) | 344 | 96.1 |
| Widowed | 3 | .8 |
| Separated | 2 | .6 |
| Divorced | 8 | 2.2 |
| Other | 1 | .3 |
| Biological Parent | ||
| Biological Parent | 305 | 97.4 |
| Non-Biological Parent | 8 | 2.6 |
| Education Level | ||
| Below high school | 6 | 1.7 |
| High school graduate | 44 | 12.3 |
| College (2-year or 4-year) graduate | 231 | 64.3 |
| Graduate school and beyond | 78 | 21.7 |
| Employment Status | ||
| Business Owner (Self-employed) | 66 | 18.4 |
| Employed (Full-time) | 105 | 29.3 |
| Employed (Part-time) | 31 | 8.7 |
| Homemaker | 120 | 33.5 |
| Unemployed | 7 | 2.0 |
| Other | 29 | 8.1 |
| Household Yearly Income | ||
| < $20,000 | 15 | 4.3 |
| $20,000 - $39,999 | 73 | 20.9 |
| $40,000 - $59,999 | 102 | 29.2 |
| $60,000 - $79,999 | 69 | 19.8 |
| $80,000 and higher | 90 | 25.8 |
| Child’s Gender | ||
| Male | 180 | 58.1 |
| Female | 130 | 41.9 |
| Child’s Disabilities | ||
| Presence of disabilities | 6 | 1.9 |
| Nativity of the Child | ||
| U.S. born | 155 | 49.7 |
| Foreign born | 157 | 50.3 |
Measures
Conflict Tactics Scales: Parent-Child version (CTSPC)
The risk of child maltreatment was measured through the Conflict Tactics Scales: Parent-Child version (CTSPC, Straus et al. 1998). The CTSPC was developed to assess psychological and physical child maltreatment and neglect behaviors of parents. The CTSPC subscales are (1) Nonviolent Discipline, (2) Psychological Aggression, (3) Physical Assault, and (4) Neglect. The CTSPC consists of 22 items that are rated on an 8-point Likert scale with the following response options: 1 = Once in the past year, 2 = Twice in the past year, 3 = 3–5 times in the past year, 4 = 6–10 times in the past year, 5 = 11–20 times in the past year, 6 = more that 20 times in the past year, 7 = Not in the past year, but it happened before, and 0 = This has never happened. To obtain total frequency scores, the midpoints for the response categories were summed (e.g., the midpoint of category 3 (3–5 times) is 4; the midpoint of category 4 (6–10 times) is 8). In addition to total frequency scores, annual or lifetime prevalence rates can be obtained through identifying respondents who reported engaging in a behavior at least once in the past year or previosuly in their lifetime. A study of American parents (Straus et al. 1998) supports the validity of the CTSPC. However, Straus et al. (1998) reported that the internal consistency reliability of the severe physical aggression scale’s frequency scores is low because parent behaviors within this category occur rarely.
Immigrant Parental Stress Inventory (IPSI)
Immigrant parental stress was measured through Immigrant Parental Stress Inventory (IPSI, Yoo and Vonk 2012). The IPSI was developed to assess stress experienced by immigrant parents within their two distinctively different language and cultural contexts. The IPSI is a parent self-report measure and consists of 33 items that are rated on a five-point Likert scale (1 = not at all, 2 = mildly, 3 = moderately, 4 = much, and 5 = very much). The subscales of the IPSI are (1) Immigrant Life Stress (ILS) and (2) Parent-Child Acculturative Gap Stress (P-GAGS). A high score indicates a greater level of immigrant parental stress. In an earlier study with Korean immigrant parents (Yoo and Vonk 2012) the average score was 72.69. If the score is higher than this score, it can be regarded as above average level of immigrant parental stress. This study showed that the IPSI has good psychometric properties. The internal consistency reliability (Cronbach’s alpha) for total IPSI (33 items) was .96. and construct validity was supported through a series of discriminant analyses and correlation analyses.
Data Analysis
First, Table 4 shows minimum, maximum, mean, standard deviation, and internal consistency reliability (Cronbach’s alpha) of the prevalence of aggressive and neglectful behaviors by parents and the degree of immigrant parental stress. The mean scores for the CTSPC subscales were 21.13 (SD = 17.35) for nonviolent discipline, 14.96 (SD = 17.62) for psychological aggression, 8.37 (SD = 17.95) for physical assault, and 6.51 (SD = 11.45) for neglect. This indicates that Korean immigrant parents engaged in nonviolent disciplines, psychological aggression, physical assault, and neglect an average of 21.13, 14.96, 8.37, and 6.51 times respectively during the previous 12 months. As these means are based on the entire sample of parents, these are lower than average scores solely of parents who reported engaging in the behaviors. Also, the mean scores for the IPSI subscales were 59.60 (SD = 20.09) for Immigrant Life Stress, and 17.61 (SD = 7.20) for Parent-Child Acculturative Gap Stress.
Table 4.
Risk Factors for Psychological Aggression by Korean Immigrant Parents (N = 229)
| B | Std. Error | Beta | t | Tolerance | VIF | |
|---|---|---|---|---|---|---|
| Step 1 | ||||||
| (Constant) | 13.01 | 4.32 | 3.01 | |||
| Male (0) vs. female (1) | −1.92 | 3.29 | −0.04 | −0.59 | 0.74 | 1.35 |
| Married (0) vs. other (1) | 6.85 | 5.80 | 0.08 | 1.18 | 0.85 | 1.17 |
| Biological (0) vs. non biological parent (1) | 0.66 | 7.20 | 0.01 | 0.09 | 0.93 | 1.08 |
| College and beyond (0) vs. high school and below (1) | 3.04 | 3.52 | 0.06 | 0.86 | 0.89 | 1.12 |
| Job (0) vs. no job (1) | 8.68 | 2.77 | 0.22 | 3.14** | 0.78 | 1.29 |
| 40,000 and over (0) vs. below 40,000 (1) | −4.20 | 2.89 | −0.10 | −1.45 | 0.88 | 1.14 |
| Boy (0) vs. girl (1) | −2.52 | 2.48 | −0.07 | −1.01 | 0.94 | 1.07 |
| Child’s Age | −0.03 | 0.22 | −0.01 | −0.15 | 0.87 | 1.15 |
| No (0) vs. disability (1) | −8.54 | 9.48 | −0.06 | −0.90 | 0.92 | 1.08 |
| No (0) vs. alcohol problem (1) | 2.75 | 4.59 | 0.04 | 0.60 | 0.78 | 1.29 |
| No (0) vs. drug problem (1) | −12.13 | 9.71 | −0.09 | −1.25 | 0.71 | 1.41 |
| No (0) vs. psychological problem (1) | 9.88 | 3.38 | 0.19 | 2.92** | 0.90 | 1.11 |
| No (0) vs. abuse history (1) | 9.62 | 2.72 | 0.23 | 3.54*** | 0.90 | 1.11 |
| Know (0) vs. do not know CPS (1) | −2.03 | 2.68 | −0.05 | −0.76 | 0.92 | 1.09 |
| No (0) vs. reported to CPS (1) | 4.58 | 11.50 | 0.03 | 0.40 | 0.83 | 1.20 |
| F | 2.82*** | |||||
| R2 | 0.17 | |||||
| Adjusted R2 | 0.11 | |||||
| Step 2 | ||||||
| (Constant) | 5.35 | 4.91 | 1.09 | |||
| Male (0) vs. female (1) | −2.20 | 3.23 | −0.05 | −0.68 | 0.74 | 1.35 |
| Married (0) vs. other (1) | 7.44 | 5.69 | 0.09 | 1.31 | 0.85 | 1.18 |
| Biological (0) vs. non biological parent (1) | 1.93 | 7.07 | 0.02 | 0.27 | 0.92 | 1.08 |
| College and beyond (0) vs. high school and below (1) | 2.01 | 3.46 | 0.04 | 0.58 | 0.88 | 1.13 |
| Job (0) vs. no job (1) | 7.75 | 2.73 | 0.20 | 2.84** | 0.77 | 1.31 |
| 40,000 and over (0) vs. below 40,000 (1) | −5.17 | 2.85 | −0.12 | −1.81 | 0.87 | 1.15 |
| Boy (0) vs. girl (1) | −3.00 | 2.44 | −0.08 | −1.23 | 0.93 | 1.07 |
| Child’s Age | −0.29 | 0.23 | −0.09 | −1.26 | 0.76 | 1.32 |
| No (0) vs. disability (1) | −8.62 | 9.30 | −0.06 | −0.93 | 0.92 | 1.08 |
| No (0) vs. alcohol problem (1) | 1.44 | 4.52 | 0.02 | 0.32 | 0.77 | 1.30 |
| No (0) vs. drug problem (1) | −7.81 | 9.62 | −0.06 | −0.81 | 0.69 | 1.44 |
| No (0) vs. psychological problem (1) | 8.63 | 3.34 | 0.17 | 2.59** | 0.89 | 1.13 |
| No (0) vs. abuse history (1) | 8.27 | 2.70 | 0.20 | 3.06** | 0.88 | 1.14 |
| Know (0) vs. do not know CPS (1) | −1.97 | 2.63 | −0.05 | −0.75 | 0.92 | 1.09 |
| No (0) vs. reported to CPS (1) | −1.79 | 11.46 | −0.01 | −0.16 | 0.81 | 1.24 |
| IPSI total raw score | 0.17 | 0.05 | 0.22 | 3.10** | 0.76 | 1.32 |
| F | 3.36 *** | |||||
| R2 | 0.20 | |||||
| Adjusted R2 | 0.14 | |||||
| R2 Change | 0.04** | |||||
Note. * p < .05, ** p < .01, *** p < .001
Second, Cronbach’s alpha was calculated to assess for internal consistency reliabilities (refer to Table 3). The CTSPC internal consistency estimates for the Korean immigrant parent sample were .61 for nonviolent discipline, .69 for psychological aggression, .84 for physical assault, and .52 for neglect. These alpha estimates were similar to those found in a study by Straus et al. (1998). In addition, the IPSI internal consistency estimates for the Korean immigrant parent sample were .95 for Immigrant Life Stress and .90 for Parent-Child Acculturative Gap Stress.
Table 3.
Descriptive Statistics and Internal Consistency of the CTSPC and the IPSI
| Minimum | Maximum | Mean | SD | Alphas | |
|---|---|---|---|---|---|
| Nonviolent Discipline | 0 | 83 | 21.13 | 17.35 | .6077 |
| Psychological aggression | 0 | 100 | 14.96 | 17.62 | .6860 |
| Physical Assault | 0 | 150 | 8.37 | 17.95 | .8392 |
| Neglect | 0 | 75 | 6.51 | 11.45 | .5197 |
| Total IPSI | 33.00 | 144.15 | 72.69 | 24.82 | .96 |
| Immigration Stress (IS) | 24.00 | 116.00 | 59.60 | 20.09 | .95 |
| Parent-Child Acculturative Gap Stress (PCAGS) | 9.00 | 44.00 | 17.61 | 7.20 | .90 |
Lastly, a series of hierarchical multiple analyses were conducted to identify significant risk factors. The assumption of independent errors was met because the Durbin-Watson is close to 2 (1.95 for psychological aggression, 1.97 for physical assault, 1.77 for neglect). Also, the assumption of no multicollinearity was met because the VIF values are all well below 10 and the tolerance statistics all well above .2. Also, the average VIF is close to 1; accordingly, collinearity is not a problem for each model (Bowerman and O'Connell 1990; Menard 1995).
Results
A series of hierarchical multiple regression analyses were conducted to predict the risk of child maltreatment: psychological aggression, physical assault, neglect, and CTSPC total. For each analysis, the first step includes the risk factors contributing to child maltreatment, which have been identified in existing studies. These factors are demographic characteristics, socioeconomic status, parental alcohol, drug, or psychological problems, parental childhood maltreatment history, whether or not a parent knows CPS, and previous CPS reports. The second step was conducted to evaluate whether immigrant parental stress predicts psychological aggression, physical assault, and neglect better than previously identified risk factors. Table 4, Table 5, Table 6, and Table 7 presents the results of hierarchical multiple regression analyses for psychological aggression, physical assault, neglect, and CTSPC total.
Table 5.
Risk Factors for Physical Assault by Korean Immigrant Parents (N = 231)
| B | Std. Error | Beta | t | Tolerance | VIF | |
|---|---|---|---|---|---|---|
| Step 1 | ||||||
| (Constant) | 8.80 | 4.16 | 2.11 | |||
| Male (0) vs. female (1) | 0.49 | 3.14 | 0.01 | 0.16 | 0.74 | 1.35 |
| Married (0) vs. other (1) | 1.22 | 5.59 | 0.01 | 0.22 | 0.85 | 1.17 |
| Biological (0) vs. non biological parent (1) | 1.90 | 6.94 | 0.02 | 0.27 | 0.93 | 1.08 |
| College and beyond (0) vs. high school and below (1) | −0.82 | 3.36 | −0.02 | −0.25 | 0.88 | 1.13 |
| Job (0) vs. no job (1) | 4.15 | 2.67 | 0.11 | 1.56 | 0.77 | 1.30 |
| 40,000 and over (0) vs. below 40,000 (1) | −0.13 | 2.78 | 0.00 | −0.05 | 0.88 | 1.13 |
| Boy (0) vs. girl (1) | −1.94 | 2.39 | −0.05 | −0.81 | 0.94 | 1.07 |
| Child’s Age | −0.34 | 0.21 | −0.11 | −1.64 | 0.86 | 1.16 |
| No (0) vs. disability (1) | −8.25 | 9.13 | −0.06 | −0.90 | 0.92 | 1.08 |
| No (0) vs. alcohol problem (1) | 2.30 | 4.31 | 0.04 | 0.54 | 0.79 | 1.27 |
| No (0) vs. drug problem (1) | −7.46 | 9.34 | −0.06 | −0.80 | 0.71 | 1.41 |
| No (0) vs. psychological problem (1) | 11.28 | 3.23 | 0.23 | 3.50** | 0.90 | 1.11 |
| No (0) vs. abuse history (1) | 9.57 | 2.62 | 0.24 | 3.66*** | 0.90 | 1.11 |
| Know (0) vs. do not know CPS (1) | −3.84 | 2.57 | −0.10 | −1.49 | 0.92 | 1.09 |
| No (0) vs. reported to CPS (1) | −0.78 | 11.09 | 0.00 | −0.07 | 0.83 | 1.20 |
| F | 2.89*** | |||||
| R2 | 0.17 | |||||
| Adjusted R2 | 0.11 | |||||
| Step 2 | ||||||
| (Constant) | 3.89 | 4.78 | 0.81 | |||
| Male (0) vs. female (1) | 0.32 | 3.12 | 0.01 | 0.10 | 0.74 | 1.35 |
| Married (0) vs. other (1) | 1.60 | 5.56 | 0.02 | 0.29 | 0.85 | 1.18 |
| Biological (0) vs. non biological parent (1) | 2.72 | 6.90 | 0.03 | 0.39 | 0.92 | 1.08 |
| College and beyond (0) vs. high school and below (1) | −1.49 | 3.35 | −0.03 | −0.44 | 0.87 | 1.14 |
| Job (0) vs. no job (1) | 3.54 | 2.66 | 0.09 | 1.33 | 0.76 | 1.31 |
| 40,000 and over (0) vs. below 40,000 (1) | −0.75 | 2.78 | −0.02 | −0.27 | 0.87 | 1.15 |
| Boy (0) vs. girl (1) | −2.25 | 2.37 | −0.06 | −0.95 | 0.93 | 1.07 |
| Child’s Age | −0.50 | 0.22 | −0.16 | −2.27* | 0.75 | 1.34 |
| No (0) vs. disability (1) | −8.30 | 9.07 | −0.06 | −0.92 | 0.92 | 1.08 |
| No (0) vs. alcohol problem (1) | 1.43 | 4.30 | 0.02 | 0.33 | 0.78 | 1.28 |
| No (0) vs. drug problem (1) | −4.68 | 9.38 | −0.04 | −0.50 | 0.69 | 1.44 |
| No (0) vs. psychological problem (1) | 10.47 | 3.23 | 0.21 | 3.24** | 0.88 | 1.13 |
| No (0) vs. abuse history (1) | 8.72 | 2.63 | 0.22 | 3.31** | 0.88 | 1.14 |
| Know (0) vs. do not know CPS (1) | −3.81 | 2.55 | −0.10 | −1.49 | 0.92 | 1.09 |
| No (0) vs. reported to CPS (1) | −4.87 | 11.19 | −0.03 | −0.44 | 0.81 | 1.24 |
| IPSI total raw score | 0.11 | 0.05 | 0.15 | 2.04* | 0.75 | 1.33 |
| F | 3.00*** | |||||
| R2 | 0.18 | |||||
| Adjusted R2 | 0.12 | |||||
| R2 Change | 0.02* | |||||
Note. * p < .05, ** p < .01, *** p < .001
Table 6.
Risk Factors for Neglect by Korean Immigrant Parents (N = 231)
| B | Std. Error | Beta | t | Tolerance | VIF | |
|---|---|---|---|---|---|---|
| Step 1 | ||||||
| (Constant) | 0.24 | 2.82 | 0.09 | |||
| Male (0) vs. female (1) | 0.78 | 2.13 | 0.03 | 0.37 | 0.74 | 1.35 |
| Married (0) vs. other (1) | 5.01 | 3.79 | 0.09 | 1.32 | 0.85 | 1.17 |
| Biological (0) vs. non biological parent (1) | 2.15 | 4.70 | 0.03 | 0.46 | 0.93 | 1.08 |
| College and beyond (0) vs. high school and below (1) | −3.87 | 2.28 | −0.11 | −1.70 | 0.88 | 1.13 |
| Job (0) vs. no job (1) | −0.60 | 1.80 | −0.02 | −0.33 | 0.77 | 1.30 |
| 40,000 and over (0) vs. below 40,000 (1) | 2.52 | 1.88 | 0.09 | 1.34 | 0.88 | 1.13 |
| Boy (0) vs. girl (1) | 1.76 | 1.62 | 0.07 | 1.09 | 0.94 | 1.07 |
| Child’s Age | 0.39 | 0.14 | 0.19 | 2.75** | 0.86 | 1.16 |
| No (0) vs. disability (1) | 14.50 | 6.18 | 0.15 | 2.35* | 0.92 | 1.08 |
| No (0) vs. alcohol problem (1) | −2.57 | 2.91 | −0.06 | −0.88 | 0.79 | 1.27 |
| No (0) vs. drug problem (1) | −6.13 | 6.33 | −0.07 | −0.97 | 0.71 | 1.41 |
| No (0) vs. psychological problem (1) | 4.22 | 2.18 | 0.13 | 1.93 | 0.90 | 1.11 |
| No (0) vs. abuse history (1) | 0.41 | 1.77 | 0.02 | 0.23 | 0.90 | 1.11 |
| Know (0) vs. do not know CPS (1) | 0.01 | 1.74 | 0.00 | 0.00 | 0.92 | 1.09 |
| No (0) vs. reported to CPS (1) | −10.98 | 7.51 | −0.10 | −1.46 | 0.83 | 1.20 |
| F | 2.26** | |||||
| R2 | 0.14 | |||||
| Adjusted R2 | 0.08 | |||||
| Step 2 | ||||||
| (Constant) | −5.79 | 3.17 | −1.83 | |||
| Male (0) vs. female (1) | 0.57 | 2.06 | 0.02 | 0.28 | 0.74 | 1.35 |
| Married (0) vs. other (1) | 5.47 | 3.68 | 0.10 | 1.49 | 0.85 | 1.18 |
| Biological (0) vs. non biological parent (1) | 3.16 | 4.56 | 0.04 | 0.69 | 0.92 | 1.08 |
| College and beyond (0) vs. high school and below (1) | −4.68 | 2.22 | −0.14 | −2.11* | 0.87 | 1.14 |
| Job (0) vs. no job (1) | −1.34 | 1.76 | −0.05 | −0.76 | 0.76 | 1.31 |
| 40,000 and over (0) vs. below 40,000 (1) | 1.76 | 1.84 | 0.06 | 0.95 | 0.87 | 1.15 |
| Boy (0) vs. girl (1) | 1.39 | 1.57 | 0.06 | 0.88 | 0.93 | 1.07 |
| Child’s Age | 0.19 | 0.15 | 0.09 | 1.28 | 0.75 | 1.34 |
| No (0) vs. disability (1) | 14.45 | 6.00 | 0.15 | 2.41* | 0.92 | 1.08 |
| No (0) vs. alcohol problem (1) | −3.64 | 2.84 | −0.09 | −1.28 | 0.78 | 1.28 |
| No (0) vs. drug problem (1) | −2.71 | 6.20 | −0.03 | −0.44 | 0.69 | 1.44 |
| No (0) vs. psychological problem (1) | 3.22 | 2.14 | 0.10 | 1.51 | 0.88 | 1.13 |
| No (0) vs. abuse history (1) | −0.65 | 1.74 | −0.02 | −0.37 | 0.88 | 1.14 |
| Know (0) vs. do not know CPS (1) | 0.04 | 1.69 | 0.00 | 0.03 | 0.92 | 1.09 |
| No (0) vs. reported to CPS (1) | −16.00 | 7.40 | −0.15 | −2.16* | 0.81 | 1.24 |
| IPSI total raw score | 0.13 | 0.04 | 0.27 | 3.78*** | 0.75 | 1.33 |
| F | 3.14*** | |||||
| R2 | 0.19 | |||||
| Adjusted R2 | 0.13 | |||||
| R2 Change | 0.05*** | |||||
Note. * p < .05, ** p < .01, *** p < .001
Table 7.
Risk Factors for CTSPC Total (Psychological aggression, physical assault, and neglect) (N = 229)
| B | Std. Error | Beta | t | Tolerance | VIF | |
|---|---|---|---|---|---|---|
| Step 1 | ||||||
| (Constant) | 22.07 | 8.61 | 2.56 | |||
| Male (0) vs. female (1) | −0.55 | 6.55 | −0.01 | −0.08 | 0.74 | 1.35 |
| Married (0) vs. other (1) | 13.02 | 11.55 | 0.08 | 1.13 | 0.85 | 1.17 |
| Biological (0) vs. non biological parent (1) | 4.54 | 14.33 | 0.02 | 0.32 | 0.93 | 1.08 |
| College and beyond (0) vs. high school and below (1) | −1.54 | 7.00 | −0.01 | −0.22 | 0.89 | 1.12 |
| Job (0) vs. no job (1) | 12.48 | 5.51 | 0.16 | 2.26* | 0.78 | 1.29 |
| 40,000 and over (0) vs. below 40,000 (1) | −2.06 | 5.76 | −0.02 | −0.36 | 0.88 | 1.14 |
| Boy (0) vs. girl (1) | −2.97 | 4.95 | −0.04 | −0.60 | 0.94 | 1.07 |
| Child’s Age | 0.00 | 0.43 | 0.00 | 0.01 | 0.87 | 1.15 |
| No (0) vs. disability (1) | −2.26 | 18.88 | −0.01 | −0.12 | 0.92 | 1.08 |
| No (0) vs. alcohol problem (1) | 3.96 | 9.14 | 0.03 | 0.43 | 0.78 | 1.29 |
| No (0) vs. drug problem (1) | −26.51 | 19.33 | −0.10 | −1.37 | 0.71 | 1.41 |
| No (0) vs. psychological problem (1) | 26.08 | 6.73 | 0.25 | 3.88*** | 0.90 | 1.11 |
| No (0) vs. abuse history (1) | 19.33 | 5.42 | 0.23 | 3.57*** | 0.90 | 1.11 |
| Know (0) vs. do not know CPS (1) | −5.50 | 5.35 | −0.07 | −1.03 | 0.92 | 1.09 |
| No (0) vs. reported to CPS (1) | −6.83 | 22.90 | −0.02 | −0.30 | 0.83 | 1.20 |
| F | 2.92*** | |||||
| R2 | 0.17 | |||||
| Adjusted R2 | 0.11 | |||||
| Step 2 | ||||||
| (Constant) | 3.39 | 9.65 | 0.35 | |||
| Male (0) vs. female (1) | −1.22 | 6.35 | −0.01 | −0.19 | 0.74 | 1.35 |
| Married (0) vs. other (1) | 14.45 | 11.20 | 0.08 | 1.29 | 0.85 | 1.18 |
| Biological (0) vs. non biological parent (1) | 7.65 | 13.91 | 0.03 | 0.55 | 0.92 | 1.08 |
| College and beyond (0) vs. high school and below (1) | −4.03 | 6.81 | −0.04 | −0.59 | 0.88 | 1.13 |
| Job (0) vs. no job (1) | 10.21 | 5.38 | 0.13 | 1.90 | 0.77 | 1.31 |
| 40,000 and over (0) vs. below 40,000 (1) | −4.44 | 5.61 | −0.05 | −0.79 | 0.87 | 1.15 |
| Boy (0) vs. girl (1) | −4.15 | 4.80 | −0.05 | −0.86 | 0.93 | 1.07 |
| Child’s Age | −0.62 | 0.45 | −0.10 | −1.37 | 0.76 | 1.32 |
| No (0) vs. disability (1) | −2.44 | 18.30 | −0.01 | −0.13 | 0.92 | 1.08 |
| No (0) vs. alcohol problem (1) | 0.75 | 8.90 | 0.01 | 0.08 | 0.77 | 1.30 |
| No (0) vs. drug problem (1) | −15.98 | 18.93 | −0.06 | −0.84 | 0.69 | 1.44 |
| No (0) vs. psychological problem (1) | 23.04 | 6.57 | 0.23 | 3.51** | 0.89 | 1.13 |
| No (0) vs. abuse history (1) | 16.04 | 5.32 | 0.19 | 3.02** | 0.88 | 1.14 |
| Know (0) vs. do not know CPS (1) | −5.36 | 5.18 | −0.07 | −1.04 | 0.92 | 1.09 |
| No (0) vs. reported to CPS (1) | −22.35 | 22.56 | −0.07 | −0.99 | 0.81 | 1.24 |
| IPSI total raw score | 0.42 | 0.11 | 0.27 | 3.84*** | 0.76 | 1.32 |
| F | 3.84*** | |||||
| R2 | 0.22 | |||||
| Adjusted R2 | 0.17 | |||||
| R2 Change | 0.05*** | |||||
Note. * p < .05, ** p < .01, *** p < .001
For the first step of each model, a series of predictors (risk factors) accounted for a significant amount of psychological aggression (R2 = .17, F(15, 213) = 2.82, p < .001), physical assault (R2 = .17, F(15, 215) = 2.89, p < .001), and neglect (R2 = .14, F(15, 215) = 2.26, p < .01). For the second step of each model, the factor of immigrant parental stress was added to determine whether this improved the models’ ability to predict psychological aggression, physical assault, and neglect. The addition of the new predictor, immigrant parental stress, caused R2 to increase by .04 (F(16, 212) = 3.36, p < .001) for psychological aggression, .02 (F(16, 214) = 3.01, p < .001) for physical assault, and .05 (F(16, 214) = 3.14, p < .001) for neglect.
As shown above, in the second step of each model, the value of F was higher than in the first step, which is also statistically significant (p < .001). This means that the final model with immigrant parental stress predicted psychological aggression, physical assault, and neglect better than the initial model. According to the t-tests of the final models of each analysis, parental employment (t(212) = 2.84, p < .01), psychological problem (t(212) = 2.59, p < .01), abuse history (t(212) = 3.06, p < .01), and IPSI score (t(212) = 3.10, p < .01) were significant predictors of psychological aggression by Korean immigrant parents; child’s age (t(214) = −2.27, p < .05), psychological problem (t(214) = 3.24, p < .01), abuse history (t(214) = 3.31, p < .01), and IPSI score (t(214) = 2.04, p < .05) were significant predictors of physical assault; education level (t(214) = −2.11, p < .05), child disability status (t(214) = 2.41, p < .05), previous CPS reports (t(214) = −2.16, p < .05), and IPSI score (t(214) = 3.78, p < .001) were significant predictors of neglect. In particular, in the models predicting psychological aggression and neglect, the standardized beta values for IPSI are largest among the other predictors; accordingly, it can be said that the IPSI is the most accurate predictor in predicting psychological aggression and neglect. The above evidence supports the use of the IPSI to infer the risk of child maltreatment from the IPSI scores.
Table 8 summarizes the results of the above hierarchical multiple regression analyses. The results showed that immigrant parental stress measured by the IPSI was a significant predictor of psychological aggression, physical assault, neglect, and total CTSPC score, after controlling for the other risk factors. That is, the effect of immigrant parental stress was much stronger than the effects of any other risk factors in predicting the risk of child maltreatment by immigrant parents.
Table 8.
Significant Predictors for the Risk of Child Maltreatment by Immigrant Parents
| The risk of Child maltreatment | Psychological aggression | Physical assault | Neglect | CTSPC Total |
|---|---|---|---|---|
| Predictors |
- Job - Psychological problem - Abuse history - Immigrant parental stress (IPSI) |
- Child age - Psychological problem - Abuse history - Immigrant parental stress (IPSI) |
- Education level - Disability of child - Whether or not parent was reported to CPS before - Immigrant parental stress (IPSI) |
- Psychological problem - Abuse history - Immigrant parental stress (IPSI) |
Discussion
One of the most important findings in the study was that immigrant parental stress was a significant predictor of psychological aggression, physical assault, and neglect by immigrant parents, after controlling for the other risk factors. That is, it may be assumed that immigrant parental stress is one of the most important risk factors of child maltreatment by Korean immigrant parents. In particular, it is worth noting that immigrant parental stress was the best predictor of psychological aggression and neglect over other risk factors. This finding can be understood as follows: First, as the IPSI was designed to measure a psychological construct, stress, it is likely to be more closely linked to psychological aggression than to physical aggression by immigrant parents. Second, the IPSI was designed to measure the deficiency of resources and social supports of immigrant parents, which has been more associated with neglect than other types of child maltreatment (Crosson-Tower 2005). The result that immigrant parental stress was the best predictor of neglect can be best understood within this context.
The result that immigrant parental stress measured by the IPSI is an important predictor of psychological aggression and neglect warrants attention in that psychological aggression and neglect are the most common and most harmful forms of child maltreatment, as well as having long-term negative effects on cognitive, behavioral, and psychological dysfunctions (Hart et al. 1998; Higgins and McCabe 2000; Miller-Perrin et al. 2009; Spertus et al. 2003).
Despite the meaningful findings discussed above, the controversial issue of defining the risk of child maltreatment still remains. Child maltreatment has been defined differently across studies and measured in different ways because there is no standardized definition of child maltreatment. Also, in many child maltreatment cases, a range of forms of aggressive behaviors occurs simultaneously. Besides, some types of aggressive behaviors by parents have often been considered as culturally acceptable disciplinary practices. Essentially, it is difficult to set the borderline between physical punishment and aggressive behaviors by parents. In this study, because of the ambiguity and complexity of defining and measuring child maltreatment, the continuum of risk for child maltreatment based on the frequency of aggressive or neglectful behaviors by parents was employed as an approximation of child maltreatment. Furthermore, the author took the viewpoint that any type of aggressive behavior by parents can have a detrimental impact on children based on studies showing that physical punishment negatively affects children (Afifi et al. 2006; Benjet and Kazdin 2003; Gershoff 2002; Straus and Kantor 1994). However, the question of what level of risk can be considered as high risk for child maltreatment still remains. To solve this issue, it is necessary to establish the clinically significant range of the IPSI, which should be derived from a clinical sample, immigrant parents at high risk for child maltreatment involved with child welfare systems.
Application
The IPSI might have practical advantages for assessing immigrant parents involved with the child welfare system. Some immigrant parents might consider child welfare agencies as potentially threatening because they think that the child welfare agencies may take their children away from them or report them to immigration authorities. For this reason, immigrant families may not honestly answer questions directly inquiring about child maltreatment such as “Have you hit your child?” Unlike some other instruments, the IPSI was designed not to directly ask about parents’ aggressive or neglectful behaviors, and what’s more, it has been verified to have the ability to predict the risk of child maltreatment. Immigrant parents not being able to infer that the risk of child maltreatment is being measured by the IPSI may reduce resistance to child welfare involvement and ensure the continued involvement of immigrant families, which can prevent the risk of child maltreatment from getting worse.
In addition, in light of the finding that immigrant parental stress measured by the IPSI (Immigrant life Stress & Parent-Child Acculturative Gap Stress) is an important predictor of the risk of child maltreatment by immigrant parents, there is a need for community-based child maltreatment prevention and intervention programs for immigrant families aimed at not only helping immigrant parents to manage their stress caused by immigration, but also reducing conflicts with their child caused by the acculturative gap. Ying's (1999) Strengthening of Intergenerational–Intercultural Ties in Immigrant Chinese American Families (SITICAF) program can be a good example for reducing intergenerational-intercultural conflicts between immigrant parents and their children.
One of important things to do at the community level is to empower immigrant parents. Support groups to facilitate connections with other immigrant parents and to build social supports may be a good way to empower immigrant parents. Support groups for immigrant parents can provide a place where immigrant parents can interact, can feel understood and supported, and can share their common experiences related to immigration or the acculturative gap with their child. This experience may have the benefit of reducing immigrant parental stress and, in the end, decreasing the risk of child maltreatment by immigrant parents.
Also, immigrant parents can be empowered through community-based education programs for immigrant parents. Through such programs, immigrant parents can become aware that their stress may increase the risk of child maltreatment; can increase their knowledge about community resources; and can learn skills to cope with their stressors, to manage their stress, to communicate with their child, and to resolve conflicts within their family. By taking a step forward, empowered immigrant parents might collectively lead social change, not only for themselves, but also for the good of other immigrant families in similar circumstances.
Compliance with ethical standards
Conflict of Interest
None.
Funding
N/A
References
- Afifi TO, Brownridge DA, Cox BJ, Jitender S. Physical punishment, childhood abuse and psychiatric disorders. Child Abuse & Neglect. 2006;30(10):1093–1103. doi: 10.1016/j.chiabu.2006.04.006. [DOI] [PubMed] [Google Scholar]
- Belsky J. Etiology of Child Maltreatment: A developmental-ecological analysis. Psychological Bulletin. 1993;114(3):413. doi: 10.1037/0033-2909.114.3.413. [DOI] [PubMed] [Google Scholar]
- Benjet C, Kazdin AE. Spanking children: The controversies, findings, and new directions. Clinical Psychology Review. 2003;23:197–224. doi: 10.1016/S0272-7358(02)00206-4. [DOI] [PubMed] [Google Scholar]
- Berry JW. A psychology of immigration. Journal of Social Issues. 2001;57(3):615–631. doi: 10.1111/0022-4537.00231. [DOI] [Google Scholar]
- Bowerman BL, O'Connell RT. Linear Statistical Models: An Applied Approach. 2. Belmont: Duxbury; 1990. [Google Scholar]
- Burrell B, Thompson B, Sexton D. Predicting child abuse potential across family types. Child Abuse & Neglect. 1994;18(12):1039–1049. doi: 10.1016/0145-2134(94)90130-9. [DOI] [PubMed] [Google Scholar]
- Chan YC. Parenting stress and social support of mothers who physically abuse their children in Hong Kong. Child Abuse and Neglect. 1994;18:261–269. doi: 10.1016/0145-2134(94)90110-4. [DOI] [PubMed] [Google Scholar]
- Crosson-Tower C. Understanding Child Abuse and Neglect. 6. Boston: Pearson/A&B; 2005. [Google Scholar]
- Crouch JL, Behl LE. Relationships among parental beliefs in corporal punishment, reported stress, and physical child abuse potential. Child Abuse & Neglect. 2001;25(3):413–419. doi: 10.1016/S0145-2134(00)00256-8. [DOI] [PubMed] [Google Scholar]
- Dinh KT, Nguyen HH. The effects of acculturative variables on Asian American parent–child relationships. Journal of Social and Personal Relationships. 2006;23(3):407–426. doi: 10.1177/0265407506064207. [DOI] [Google Scholar]
- Gershoff ET. Corporal punishment by parents and associated child behaviors and experiences: Ameta-analytic and theoretical review. Psychological Bulletin. 2002;128:539–579. doi: 10.1037/0033-2909.128.4.539. [DOI] [PubMed] [Google Scholar]
- Hart SN, Binggeli NJ, Brassard MR. Evidence for the effects of psychological maltreatment. Journal of Emotional Abuse. 1998;1:27–58. doi: 10.1300/J135v01n01_03. [DOI] [Google Scholar]
- Higgins DJ, McCabe MP. Relationships between different types of maltreatment during childhood and adjustment in adulthood. Child Maltreatment. 2000;5:261–272. doi: 10.1177/1077559500005003006. [DOI] [PubMed] [Google Scholar]
- Hillson JMC, Kupier NA. A stress and coping model of child maltreatment. Clinical Psychology Review. 1994;14(4):261–285. doi: 10.1016/0272-7358(94)90025-6. [DOI] [Google Scholar]
- Koenig A, Cicchetti D, Rogosch F. Child compliance/noncompliance and maternal contributors to internalization in maltreating and nonmaltreating dyads. Child Development. 2000;71(4):1018–1032. doi: 10.1111/1467-8624.00206. [DOI] [PubMed] [Google Scholar]
- Lazarus RS. Stress and emotion: A new synthesis. In: Monat A, Lazarus RS, Reevy G, editors. The Praeger Handbook on Stress and Coping. Westport: Praeger; 2007. pp. 33–51. [Google Scholar]
- Levitt MJ, Lane JD, Levitt J. Immigration stress, social support, and adjustment in the first postmigration year: An intergenerational analysis. Research in Human Development. 2005;2(4):159–177. doi: 10.1207/s15427617rhd0204_1. [DOI] [Google Scholar]
- McDaniel M, Slack KS. Major life events and the risk of a child maltreatment investigation. Children and Youth Services Review. 2005;27(2):171–195. doi: 10.1016/j.childyouth.2004.08.015. [DOI] [Google Scholar]
- Menard S. Applied Logistic Regression Analysis. Sage university paper series on quantitative applications in the social sciences, 07–106. Thousand Oaks: Sage; 1995. [Google Scholar]
- Miller-Perrin CL, Perrin RD, Kocurb JL. Parental physical and psychological aggression: Psychological symptoms in young adults. Child Abuse & Neglect. 2009;33:1–11. doi: 10.1016/j.chiabu.2008.12.001. [DOI] [PubMed] [Google Scholar]
- Milner JS. Social information processing and physical child abuse. Clinical Psychology Review. 1993;13:275–294. doi: 10.1016/0272-7358(93)90024-G. [DOI] [Google Scholar]
- Pinderhughes E, Dodge K, Bates J, Pettit G, Zelli A. Discipline responses: influences of parents’ socioeconomic status, ethnicity, beliefs about parenting, stress, and cognitive-emotional processes. Journal of Family Psychology. 2000;14(3):380–400. doi: 10.1037/0893-3200.14.3.380. [DOI] [PMC free article] [PubMed] [Google Scholar]
- Rodriguez CM, Green AJ. Parenting stress and anger expression as predictors of child abuse potential. Child Abuse & Neglect. 1997;21(4):367–377. doi: 10.1016/S0145-2134(96)00177-9. [DOI] [PubMed] [Google Scholar]
- Rodriguez CM, Richardson MJ. Stress and anger as contextual factors and preexisting cognitive schemas: Predicting parental child maltreatment risk. Child Maltreatment. 2007;12(4):325–337. doi: 10.1177/1077559507305993. [DOI] [PubMed] [Google Scholar]
- Spertus IL, Yehuda R, Wong CM, Halligan S, Seremetis SV. Childhood emotional abuse and neglect as predictors of psychological and physical symptoms in women presenting to a primary care practice. Child Abuse & Neglect. 2003;27:1247–1258. doi: 10.1016/j.chiabu.2003.05.001. [DOI] [PubMed] [Google Scholar]
- Spicer S, Franklin C. Exploratory effects of social support, stress and locus of control on the conflict tactics of parents at-risk for child maltreatment. Journal of Social Service Research. 1994;19(3/4):1–22. [Google Scholar]
- Straus MA, Kantor GK. Corporal punishment of adolescents by parents: A risk factor in the epidemiology of depression, suicide, alcohol abuse, child abuse, and wife beating. Adolescence. 1994;29:543–561. [PubMed] [Google Scholar]
- Straus MA, Hamby SL, Finkelhor D, Moore DW, Runyan D. Identification of child maltreatment with the parent-child conflict tactics scales: Development and psychometric data for a national sample of American parents. Child Abuse and Neglect. 1998;22:249–270. doi: 10.1016/S0145-2134(97)00174-9. [DOI] [PubMed] [Google Scholar]
- Taylor CA, Guterman NB, Lee SJ, Rathouz PJ. Intimate partner violence, maternal stress, nativity, and risk for maternal maltreatment of young children. Journal Information. 2009;99(1):175–183. doi: 10.2105/AJPH.2007.126722. [DOI] [PMC free article] [PubMed] [Google Scholar]
- Tseng V, Fuglini AJ. Parent–adolescent language use and relationships among immigrant families with East Asian, Filipino, and Latin American backgrounds. Journal of Marriage and the Family. 2000;62:465–477. doi: 10.1111/j.1741-3737.2000.00465.x. [DOI] [Google Scholar]
- U.S. Department of Health and Human Services. (2003). A Coordinated Response to Child Abuse and Neglect: The Foundation for Practice.http://www.childwelfare.gov/pubs/usermanuals/foundation/foundation.pdf. Accessed 20 May 2008.
- Webster-Stratton C. Stress: A potential disrupter of parent perceptions and family interactions. Journal of Clinical Child Psychology. 1990;19:302–312. doi: 10.1207/s15374424jccp1904_2. [DOI] [Google Scholar]
- Wolfe DA. Child Abuse: Implications for Child Development and Psychopathology. 2. Thousands Oaks: Sage; 1999. [Google Scholar]
- Ying Y. Strengthening intergenerational/intercultural ties in migrant families: A new intervention for parents. Journal of Community Psychology. 1999;27(1):89–96. doi: 10.1002/(SICI)1520-6629(199901)27:1<89::AID-JCOP6>3.0.CO;2-O. [DOI] [Google Scholar]
- Ying Y, Tracy LC. Psychometric properties of the intergenerational congruence in immigrant families-parent scale in Chinese Americans. Social Work Research. 2004;28(1):56–62. doi: 10.1093/swr/28.1.56. [DOI] [Google Scholar]
- Yoo S-Y, Vonk ME. The development and initial validation of the Immigrant Parental Stress Inventory (IPSI) in a sample of Korean immigrant parents. Children and Youth Services Review. 2012;34(5):989–998. doi: 10.1016/j.childyouth.2012.01.049. [DOI] [Google Scholar]