

Abstract
Development of novel antivirals, which requires knowledge of the viral life cycle in molecular detail, is a daunting task, involving extensive investments, and frequently resulting in failure. As there exist significant commonalities among virus families in the manner of host interaction, identifying and targeting common rather than specific features may lead to the development of broadly useful antivirals. Here, we have targeted the 3C protease of Hepatitis A Virus (HAV), a feco‐orally transmitted virus of the family Picornaviridae, for identification of potential antivirals. The 3C protease is a viable drug target as it is required by HAV, as well as by other picornaviruses, for post‐translational proteolysis of viral polyproteins and for inhibiting host innate immune pathways. Computational screening, followed by chemical synthesis and experimental validation resulted in identification of a few compounds which, at low micromolar concentrations, could inhibit HAV 3C activity. These compounds were further tested experimentally against the 3C protease of Human Rhinovirus, another member of the Picornaviridae family, with comparable results. Computational studies on 3C proteases from other members of the picornavirus family have indicated that the compounds identified could potentially be generic inhibitors for picornavirus 3C proteases.
Keywords: enzymatic assays, hepatitis A virus and rhinovirus 3C protease, picornavirus, screening of isatins, structure‐based drug design
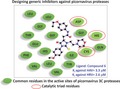
The active site residues of 3C proteases show a significant intraspecies overlap among most common members of the picornavirus family. The similarity of the interacting residues could be utilized for designing broad‐range generic inhibitors against the 3C proteases of the picornavirus family.
Abbreviations
- AADS
automated active site docking and scoring
- ADME Absorption
distribution, metabolism, and excretion
- CADD
computer‐aided drug design
- HAV
hepatitis A virus
- HRV
human rhinovirus
- MMBAPPL
molecular mechanics binding affinity prediction of protein–ligand
- MMGBSA
molecular mechanics generalized born surface area
- MMPBSA
molecular mechanics poisson‐Boltzmann surface area
- SARS‐CoV
severe acute respiratory syndrome‐coronavirus
Introduction
Acute Hepatitis caused by HAV infection is typically self‐limiting 1, 2, 3. However, recent large outbreaks in several parts of the world 4, prevalence of vaccine‐resistant strains 5 and propensity of the virus to cause liver failure if contracted in the later stages of life, coupled with a lack of specific treatment other than supportive care 6, 7, underscore the need for development of an effective antiviral to combat occurrences of HAV infections.
HAV is a small, nonenveloped icosahedral RNA virus belonging to the hepatovirus genus of the Picornaviridae family 3. The positive‐stranded RNA genome of HAV serves as a template for both translation and replication. The translated polyprotein is autocleaved by the viral 3C protease into structural and nonstructural proteins (Fig. 1A), including the viral polymerase which is crucial for initiating replication. 3C protease, which preferentially cleaves after glutamine 8 (Fig. 1B), also cleaves several cellular proteins (Fig. 1C), to arrest translation and promote viral replication 9, 10, or to subvert host innate immune pathways 11. Other members of the Picornaviridae family utilize a similar 3C‐mediated proteolytic mechanism for generating viral proteins and cleaving cellular components, to establish infection. Similarly, SARS‐CoV of the Coronaviridae family employs a 3C‐like protease for autoprocessing of viral proteins 12, 13. These proteases constitute vital drug targets for therapeutic intervention.
Figure 1.
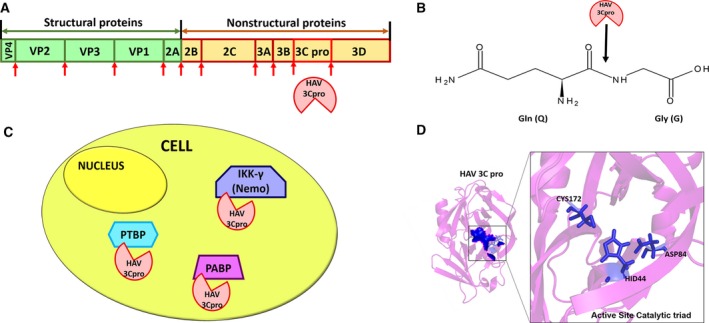
(A) Autoproteolytic cleavage of HAV polyprotein by its 3C protease (shown with red arrows), (B) Preferred cleavage site of HAV 3C after glutamine, (C) Cellular proteins cleaved by HAV 3C (PTBP‐ polypyrimidine tract binding protein, IKKγ‐ inhibitor of nuclear factor kappa‐B kinase subunit gamma, PABP‐ polyA‐binding protein) and (D) Active site of HAV 3C comprising Cys172, His44, and Asp84 as a catalytic triad.
Computational and bioinformatics approaches, which provide essential insights into drug–protein interaction at the molecular level, can be utilized effectively to speed up design and development of improved antivirals against key proteins. Computer‐Aided Drug Discovery (CADD), which is a specialized discipline of structure‐based/ligand‐based drug design, boasts of multiple success stories in the area of antivirals among others 14. Development of FDA‐approved drugs such as Zanamivir, Oseltamivir (against Influenza Virus) and Saquinavir (against HIV) has validated the efficacy of these techniques 15, 16, 17, 18. Among many peptidomimetic and small‐molecule inhibitors that have been tested against viral proteins, isatin and its derivatives constitute an interesting class of versatile lead compounds. Isatins have shown antiviral activity against a broad spectrum of viruses such as SARS‐CoV, Hepatitis C Virus, and HIV 19, 20, 21, in addition to their antitumor, antibacterial, antiangiogenic, and other biological activities 22, 23, 24, 25.
In this study, we employed a combined strategy of virtual screening and computational drug design followed by chemical synthesis of compounds with favorable binding free energies and experimental validation through in vitro experiments. This CADD structure‐based approach was utilized for effective screening of small‐molecule inhibitors against the 3C protease of HAV, a crucial effector in the life cycle of the virus. We also attempted to modify isatin compounds to generate potential lead compounds against HAV 3C protease. To the best of our knowledge, this is the first description of isatin derivatives as effective inhibitors against the HAV 3C protease. Further, extended computational analyses of these compounds against the 3C protease of other members of the picornavirus family indicate that these compounds can act as plausible broad‐range inhibitors against picornaviral 3C proteases.
Results
Identification of compounds against HAV 3C by structure‐based virtual screening
The crystal structure of HAV 3C protease (PDB ID: http://www.rcsb.org/pdb/search/structidSearch.do?structureId=2CXV 26) was utilized for screening and docking to identify potential inhibitors. The catalytic site of 3C protease is a triad formed by Cys172, His44, and Asp84 27 (Fig. 1D). A binding pocket encompassing the catalytic site and oxyanion hole, along with the nearby residues involved in substrate binding, was identified as a potential active site by the active site prediction program, AADS 28. About one million organic molecules from the ZINC database 29 were screened against this binding pocket of HAV 3C protease using a rapid screening protocol (RASPD 30), in order to select 1000 best hits. These compounds were then subjected to atomic level docking and scoring using ParDOCK 31, 32. A number of 250 molecules with the highest predicted binding energies were subjected to short molecular dynamics simulations. Eventually, seven compounds (1–7; Table 1) which showed potential to form strong interactions with the protease, were further subjected to 100 ns simulations, in order to understand the dynamics of their binding to the enzyme.
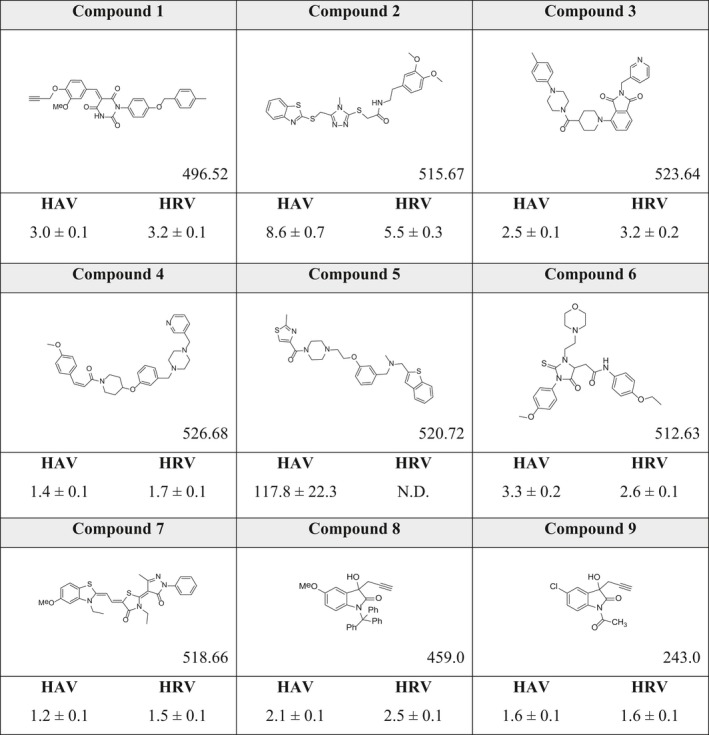
Table 1.
Molecular structural formulas of compounds identified with molecular weights (in Daltons) and corresponding inhibition constants (K i in μm, obtained experimentally) of HAV and HRV14 3C proteases
This article is being made freely available through PubMed Central as part of the COVID-19 public health emergency response. It can be used for unrestricted research re-use and analysis in any form or by any means with acknowledgement of the original source, for the duration of the public health emergency.
Novel isatin‐based compounds against HAV 3C
In addition to our virtual screening approach, we also considered indoles as possible inhibitory compounds for HAV 3C protease. Indoles, in the recent past, have turned out to be effective scaffolds not only in biology and medicine but also in material sciences 33, 34. An indole backbone, with various substituents on the core structure, has the ability to display a spectrum of functionalities. In particular, and due to their broad structural diversity, isatins have been shown to affect a wide range of biological targets 35, 36, 37, 38, 39. We computationally screened a variety of isatin derivatives against HAV 3C protease, and found that two modifications in the protecting groups of isatins (in compounds 8 and 9; Table 1) resulted in better interactions with the target, as reflected in docking studies as well as in the 100 ns molecular dynamics simulations. Compound 8 contains a triphenylmethyl protecting group, which restricted the conformations of the compound in the binding pocket of 3C protease, thus facilitating a snug fit. Compound 9 is a substrate mimic, with an N‐acetyl protecting group containing an amide bond that competitively inhibits the attack of Cys172 nucleophile on the substrate. This amide bond hinders the transfer of proton of Sγ of Cys172 by Nε of His44, necessary for substrate cleavage.
Molecular dynamics simulation studies of compounds 1–9 with HAV 3C
A combined approach of virtual screening and isatin‐based drug design resulted in the identification of nine potentially efficacious compounds (IUPAC naming in Table 2). Interaction diagrams (Fig. 2) and simulation data (Figs S1 and S2 and Table 3) supported the possibility of strong binding of these compounds to HAV 3C protease. The ligand and protein backbone RMSD plots (Fig. S1) for all the proposed nine compounds remained stable during the 100 ns molecular dynamics simulations, except for compound 5. This compound was found to drift to another site which comprised of similar residues as the originally targeted site. Also, the ligand RMSD for compound 9 showed fluctuations for approximately 10 ns during the initial 30 ns simulation. However, extension of the simulation upto 100 ns showed that compound 9 eventually gets stabilized in a conformation similar to its initial docked pose (Fig. S3, Fig. 2), which could potentially reflect the actual binding mechanism. For conducting experimental studies with the compounds identified by in silico binding studies, we purchased compounds 1–7 while the isatin compounds (8 and 9) were synthesized in‐house (Fig. S4).
Table 2.
IUPAC names and Zinc IDs of the compounds 1–9 identified against Hepatitis A Virus 3C protease
| Compounds | IUPAC name | ZINC ID |
|---|---|---|
| Compound 1 | (5E)‐5‐(3‐methoxy‐4‐propargyloxy‐benzylidene)‐1‐[4‐(4‐methylbenzyl)oxyphenyl]barbituric‐acid | 2982970 |
| Compound 2 | 2‐[[5‐(benzothiazol‐2‐ylsulfanylmethyl)‐4‐methyl‐1,2,4‐triazol‐3‐yl]sulfanyl]‐N‐[2‐(3,4‐dimethoxyphenyl)ethyl]acetamide | 01794178 |
| Compound 3 | 4‐[4‐[4‐(p‐tolyl)piperazine‐1‐carbonyl]‐1‐piperidyl]‐2‐(3‐pyridylmethyl)isoindoline‐1,3‐dione | 11910201 |
| Compound 4 | (E)‐3‐(4‐methoxyphenyl)‐1‐[4‐[3‐[[4‐(3‐pyridylmethyl)piperazin‐1‐yl]methyl]phenoxy]‐1‐piperidyl]prop‐2‐en‐1‐one | 20451377 |
| Compound 5 | [4‐[2‐[4‐[(benzothiophen‐2‐ylmethyl‐methyl‐amino)methyl]phenoxy]ethyl]piperazin‐1‐yl]‐(2‐methylthiazol‐4‐yl)methanone | 12470654 |
| Compound 6 | N‐(4‐ethoxyphenyl)‐2‐[1‐(4‐methoxyphenyl)‐3‐(2‐morpholinoethyl)‐5‐oxo‐2‐thioxo‐imidazolidin‐4‐yl]‐acetamide | 09763226 |
| Compound 7 | 3‐ethyl‐5‐[2‐(3‐ethyl‐5‐methoxy‐benzothiazol‐2‐ylidene)ethylidene]‐2‐(3‐methyl‐5‐oxo‐1‐phenyl‐pyrazol‐4‐ylidene)‐thiazolidin‐4‐one | 03877668 |
| Compound 8 | 3‐hydroxy‐5‐methoxy‐3‐(prop‐2‐ynyl)‐1‐tritylindolin‐2‐one | Isatin modified 1 |
| Compound 9 | 1‐acetyl‐5‐chloro‐3‐hydroxy‐3‐(prop‐2‐ynyl)indolin‐2‐one | Isatin modified 2 |
This article is being made freely available through PubMed Central as part of the COVID-19 public health emergency response. It can be used for unrestricted research re-use and analysis in any form or by any means with acknowledgement of the original source, for the duration of the public health emergency.
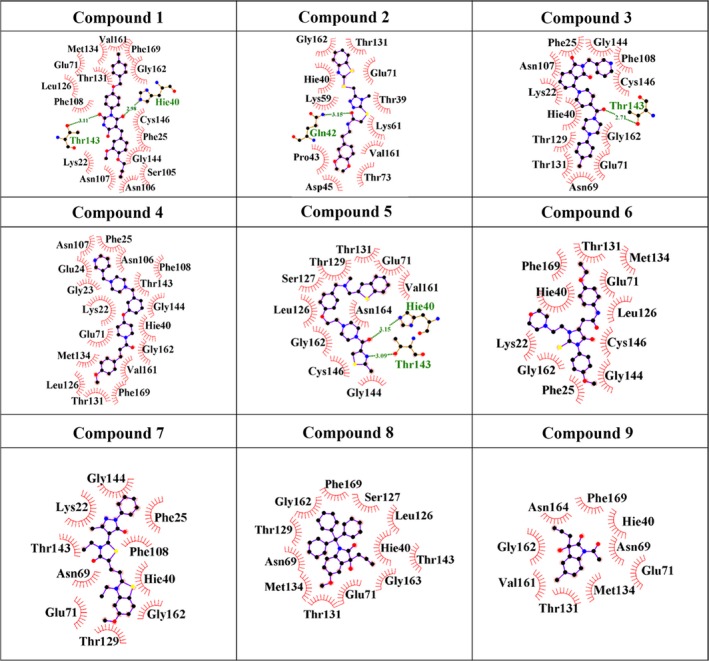
Figure 2.
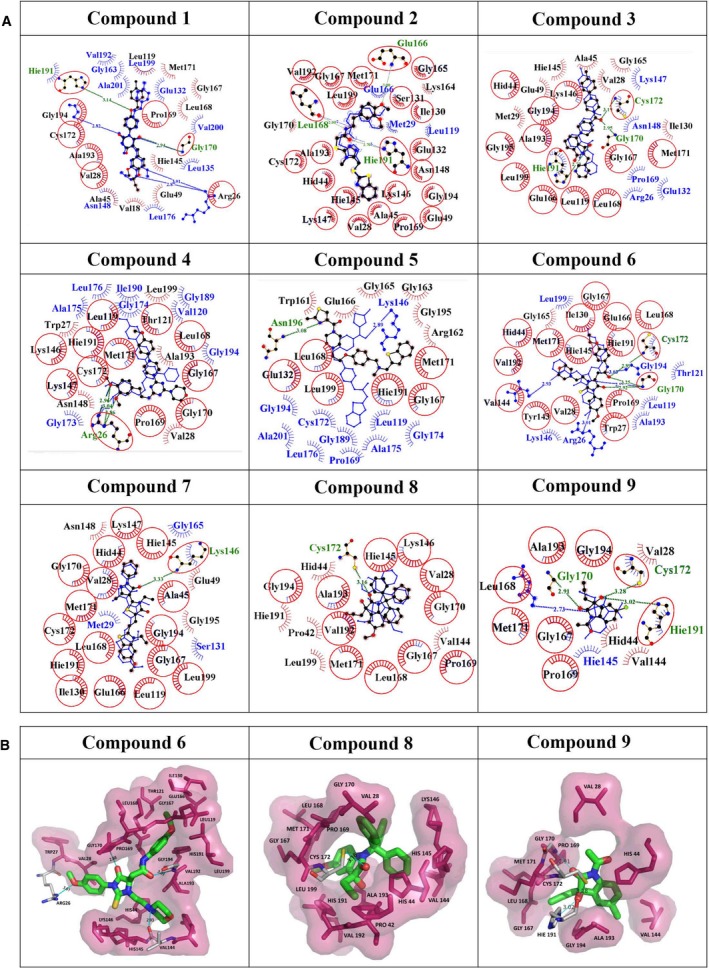
(A) Interaction patterns of initial docked pose and one frame among the biggest cluster of ligand from 100 ns long molecular dynamics simulations (complexed with compounds 1–9). The biggest cluster information was obtained using the ligand RMSD plots. One of the frames where the ligand was found to be stable most of the time during molecular dynamics simulations was selected for plotting the protein–ligand interaction diagram. The overlapping 2D poses show hydrophobic and hydrogen bond contacts with the active site residues of HAV 3C protease between docking versus postdocking stable conformations. The red circles show the common interacting residues between docking and biggest cluster frame (BCF) of the respective protein–ligand complex. Blue color denotes hydrophobic residues of the initial docked pose. Red color residues (labeled in black) denote hydrophobic residues of the BCF. Green color residues are the hydrogen bonding residues. Blue lines and green lines show hydrogen bonds in docked pose and BCF, respectively. Most of the residues are found to be conserved maximum number of times during 100 ns molecular dynamics simulations. These plots have been generated using ligplot software 71 (B) 3D interactions of the most potent inhibitors (compounds 6, 8, and 9) in the catalytic site of HAV 3C protease.
Table 3.
Data on predicted binding free energies (in kcal·mol−1) of compounds 1–9 with HAV 3C protease using ParDOCK, AutoDock 69, SwissDock 70, MMBAPPL, MMGBSA, and MMPBSA along with the experimentally obtained K i values. The MMBAPPL, MMGBSA, and MMPBSA scores are obtained from 100 ns molecular dynamics simulations run
| Compoundsa | Dock score (ParDOCK) | Dock score (AutoDock) | Dock score (SwissDock) | MMPBSA ± SE of mean | MMGBSA ± SE of mean | MMBAPPL ± SE of mean | Experimental K i values (μm) |
|---|---|---|---|---|---|---|---|
| Compound 1 | −16.25 | −7.4 | −9.10 | −38.60 ± 0.70 | −52.20 ± 0.53 | −8.96 ± 0.14 | 3 |
| Compound 2 | −11.05 | −6.5 | −9.15 | −13.25 ± 0.16 | −41.80 ± 0.47 | −6.97 ± 0.20 | 8.6 |
| Compound 3 | −10.58 | −9.0 | −8.45 | −15.78 ± 0.23 | −42.56 ± 0.42 | −8.56 ± 0.36 | 2.5 |
| Compound 4 | −10.32 | −8.2 | −8.83 | −29.96 ± 0.58 | −50.22 ± 0.12 | −8.61 ± 0.11 | 1.4 |
| Compound 6 | −11.49 | −7.0 | −8.98 | −18.95 ± 0.14 | −57.20 ± 0.35 | −9.01 ± 0.18 | 3.3 |
| Compound 7 | −11.25 | −7.7 | −8.68 | −21.66 ± 0.19 | −55.18 ± 0.33 | −8.92 ± 0.13 | 1.2 |
| Compound 8 | −12.52 | −7.5 | −7.75 | −20.23 ± 0.43 | −53.87 ± 0.57 | −8.19 ± 0.14 | 2.1 |
| Compound 9 | −14.78 | −6.5 | −6.96 | −21.32 ± 0.11 | −52.58 ± 0.25 | −8.56 ± 0.14 | 1.6 |
| Compound 5 | −10.93 | −7.3 | −8.33 | −27.47 ± 0.73 | −46.78 ± 0.54 | −6.30 ± 0.33 | 117.8 |
All the three docking software show correlation of < 0.5 w.r.t K i values; however, the average protein–ligand score for the most stable part of complexes during their 100 ns simulation using binding free energy scoring algorithm of MMBAPPL showed a strong correlation of 0.82 w.r.t K i values. BAPPL is the scoring algorithm utilized in ParDOCK for calculating binding free energy of the protein–ligand complex, which when calculated over all the snapshots of protein–ligand complexes during the molecular dynamics simulations is known as MMBAPPL. The score calculates energies obtained for each snapshot during the simulations and provides an average binding free energy of the complex. The success of the methodology relies on the screening (with −10 kcal·mol−1 of binding free energy as threshold) as well as the overall binding affinity calculated over a period of stable molecular dynamics simulations using MMBAPPL.
For calculating the correlations, the compound 5 data were not considered due to its drift from the catalytic site of protease.
This article is being made freely available through PubMed Central as part of the COVID-19 public health emergency response. It can be used for unrestricted research re-use and analysis in any form or by any means with acknowledgement of the original source, for the duration of the public health emergency.
Kinetic and cytotoxicity analysis of compounds 1–9
HAV 3C protease (from the viral strain HM175) was recombinantly expressed in E. coli Rosetta (DE3) pLysS cells, and purified through sequential Ni‐NTA and size‐exclusion chromatography (Fig. S5). A mutated version of 3C protease, with C172A (catalytic site Cysteine) and C24S (nonessential surface Cysteine) modifications 27, 40, 41, was generated using site‐directed mutagenesis, and the protein purified under identical conditions as utilized for wild‐type. For enzymatic inhibition assays, a peptide (EDANS‐GLRTQ*SFS‐DABCYL), containing the 3C cleavage site 42 (marked by a star), and flanked by a fluorophore and a quencher, at its N‐ and C‐terminal ends respectively, was utilized. Mutated 3C, containing the C172A/C24S modifications which have previously been shown to inhibit 3C activity 27, 41, served as a negative control for the assays. HAV 3C cleaved the peptide immediately as shown in Fig. 3, whereas the mutated 3C did not show any appreciable cleavage activity even after 10 min of incubation.
Figure 3.
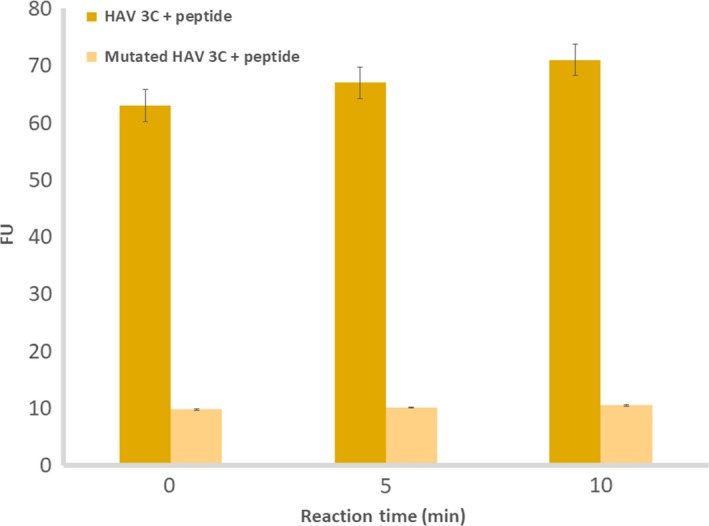
Activity assay of HAV 3C, wild‐type and mutant against a peptidic fluorogenic substrate, EDANS‐GLRTQ*SFS‐DABCYL (asterisk represents the cleavage site of 3C). FU represents fluorescence units. The data are a mean of triplicate measurements. Error bars represent standard deviation with n = 3.
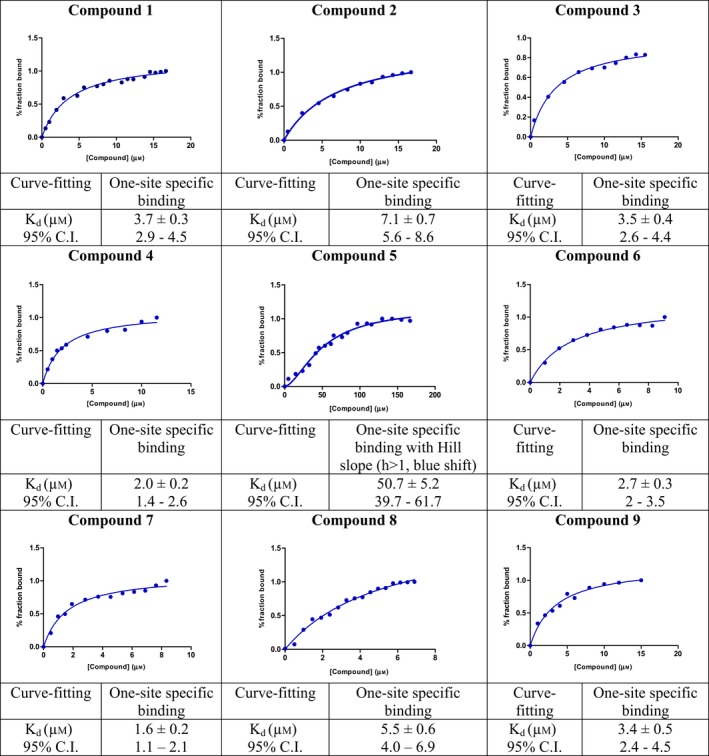
Saturation binding experiments were carried out to determine the dissociation constant (K d) of all nine compounds (Table 4). Substrate cleavage by 3C followed Michaelis–Menten model (Table 5), and kinetic parameters were developed, so that the effect of the compounds on 3C activity could be examined under initial velocity conditions (Table 6). The inhibition constant (K i) (Table 1) was calculated by least‐squares fitting using GraphPad Prism 5, La Jolla, CA, USA. Since the fluorescence responses were not masked by any of the compounds, no inner filter effect correction was required. The compounds were further tested for cytotoxicity by a standard MTT assay, and were found to be nontoxic up to fairly high concentrations in the micromolar range (Table 7).
Table 4.
Saturation binding experiments of HAV 3C protease with compounds 1–9. Dissociation constants (K d) values are mentioned along with 95% confidence intervals (CI). Graphs are plotted between compound concentrations in μm versus percentage of enzyme in the bound state. In all cases, R square values were > 0.98. Curve‐fitting was carried out using graphpad prism 5
This article is being made freely available through PubMed Central as part of the COVID-19 public health emergency response. It can be used for unrestricted research re-use and analysis in any form or by any means with acknowledgement of the original source, for the duration of the public health emergency.
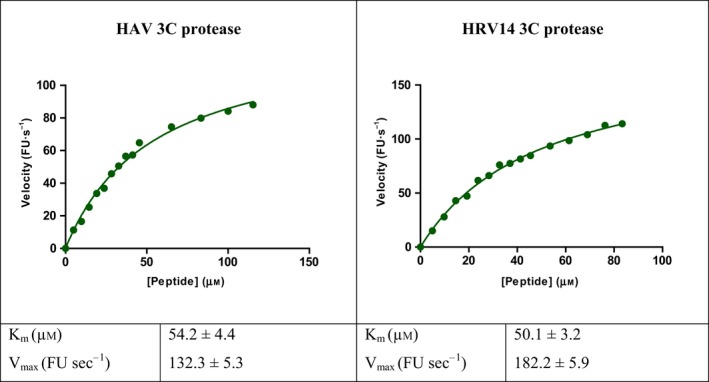
Table 5.
Binding curve of the fluorogenic peptide (EDANS‐GLRTQ*SFS‐DABCYL) with 3C proteases of Hepatitis A Virus (HAV) and Human Rhinovirus 14 (HRV14). The curves follow Michaelis–Menten model. Graphs are plotted between peptide concentrations (μm) versus reaction velocity (fluorescence units (FU) s−1). The kinetic parameters (K m and V max) are mentioned. Curve‐fitting was carried out using graphpad prism 5
This article is being made freely available through PubMed Central as part of the COVID-19 public health emergency response. It can be used for unrestricted research re-use and analysis in any form or by any means with acknowledgement of the original source, for the duration of the public health emergency.
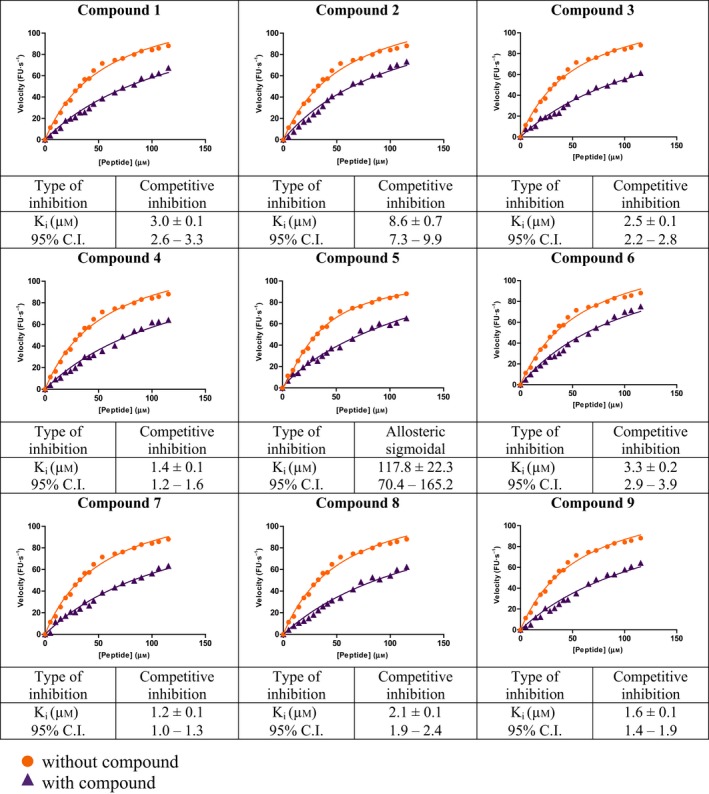
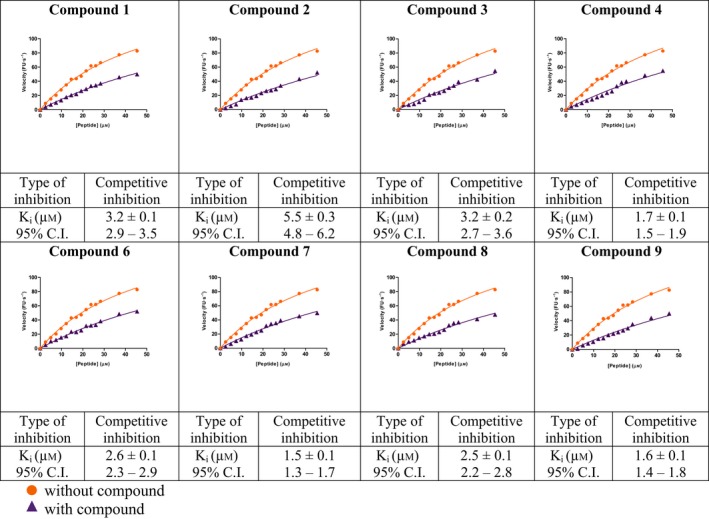
Table 6.
Determination of inhibition constants (K i) of compounds 1–9 against HAV 3C protease. Calculated K i values are mentioned along with 95% confidence intervals (CI). Graphs are plotted between peptide concentrations in μm versus reaction velocity in fluorescence units (FU)·s−1. In all cases, R square values were > 0.98. Curve‐fitting was carried out using graphpad prism 5
This article is being made freely available through PubMed Central as part of the COVID-19 public health emergency response. It can be used for unrestricted research re-use and analysis in any form or by any means with acknowledgement of the original source, for the duration of the public health emergency.
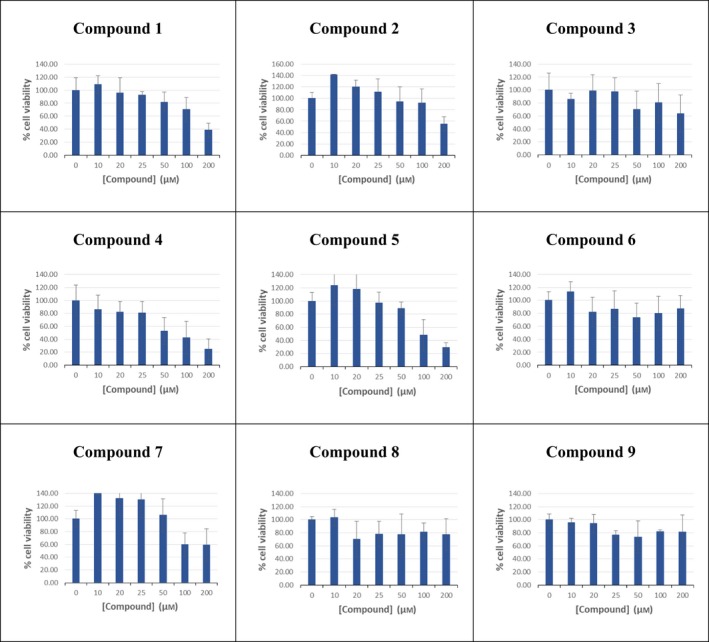
Table 7.
Cell growth inhibition by compounds 1–9 using the MTT assay. HEK293T cells were exposed to compounds 1–9 continuously for 24 h at increasing concentrations of 0–200 μm, followed by MTT assays. Data are calculated as percentage cell viability against respective compound concentration (μm). Each experiment was performed in triplicates, and data presented as mean ± SD
This article is being made freely available through PubMed Central as part of the COVID-19 public health emergency response. It can be used for unrestricted research re-use and analysis in any form or by any means with acknowledgement of the original source, for the duration of the public health emergency.
Compound 5 drifts to an offsite
The inhibition data for compound 5, obtained from our fluorimetric enzymatic assays, fitted better into an allosteric sigmoidal model, rather than in the equation for competitive inhibition, with a high K i of 117.8 ± 22.3 μm. This indicated that compound 5 probably binds to an offsite other than the predicted binding pocket of HAV 3C protease. To find a plausible reason for this anomaly in expected versus actual binding, we carried out a detailed, computational binding mode analysis of compound 5, compared to other compounds. Our analysis showed that the distance between Cys172 (one of the residues in the catalytic triad) and the central atom of compound 5 increases with respect to time during the simulation (Fig. 4); although the other compounds stay near the catalytic triad with similar hydrophobic and hydrogen bonding interactions throughout the duration of the simulations (Figs 4 and 2A). The interaction diagram in Fig. 2A shows that the HAV 3C residues eventually interacting with compound 5 are significantly different than those in the initial docked position, suggesting a possible shift in the binding site. Compound 5 appeared to form strong interactions with residues Trp161, Glu166, Gly165, Gly163, Arg16, and Asn196 present 15 Å away from the catalytic site, confirming the drift of this compound from its initial docked pose at the targeted binding site. The offsite shares six residues with the targeted site (Fig. 2), which partially explains the anomalous binding at that pose. Our MTT assays showed that compound 5 caused more than 70% cell death at 200 μm concentration. Given that compound 5 showed propensity for possible drift from catalytic and substrate‐binding sites, with a high inhibition constant and potential toxicity at just twice its inhibitory concentration, this compound was not used for further studies.
Figure 4.
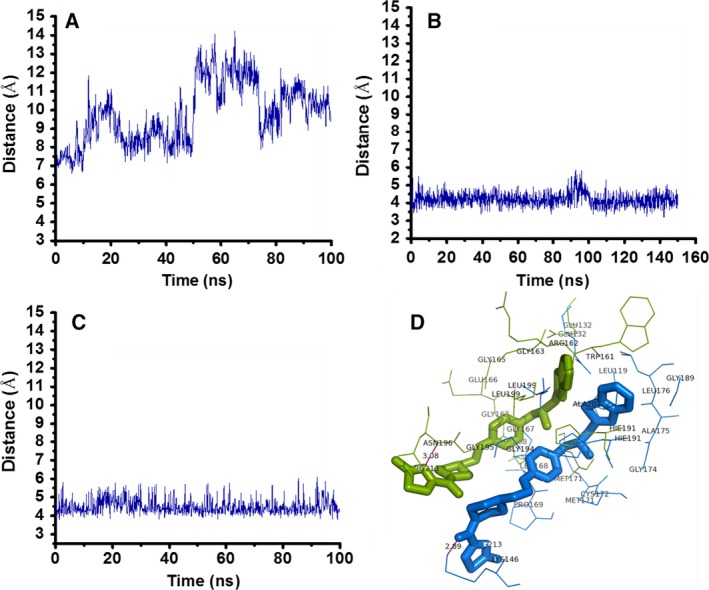
Binding mode analyses of compound 5 versus compounds 7 and 9 in complex with HAV 3C protease. Distances between (A) Cys172 and central atom of compound 5, (B) Cys172 and central atom of compound 7 with an extension of 50 ns molecular dynamics simulations to check the stability after 90 ns peak jump, (C) Cys172 and central atom of compound 9 within the binding pocket throughout the 100 ns molecular dynamics simulations. Binding mode analyses of compound 5 versus compound 7 show that the distance between the catalytic site residue Cys172 increases with respect to time during the molecular dynamics simulations. (D) 3D ball and stick pictorial representation of ligand in active site residues using PyMOL, shows the drift of compound 5 from docked position (shown in blue color) to most favorable (biggest cluster) location (shown in green color) during molecular dynamics simulations.
Eight of the identified compounds competitively inhibit HAV 3C
Our in vitro enzymatic assay demonstrated that all compounds, except compound 5, exhibited competitive inhibition in the low micromolar range (Table 1). The best K i values of ~ 1.2, 1.4, and 1.6 μm were demonstrated by compounds 7, 4, and 9 respectively. Compounds 8, 3, 1, and 6 also showed effective inhibition with K i values of ~ 2.1, 2.5, 3.0, and 3.3 μm, respectively. Compound 2 had the highest K i of 8.6 ± 0.7 μm among the eight compounds. However, for choosing the most viable lead compounds, we also considered the cytotoxicity displayed by these compounds in a standard MTT assay. Although we found that all eight compounds were fairly benign in cell culture, the cytotoxicity displayed by 6, 8, and 9 were the least, with ~ 80% cells remaining viable even after being treated with 200 μm of these compounds (between 60 and 120 times the inhibitory concentration). Compounds 1, 3, 4, and 7, although displaying better K i values in some cases, were found to cause higher cytotoxicity (~ 40%, 60%, 25%, and 55% cell viability, respectively, at 200 μm inhibitor concentration). Five distinct molecular dynamics simulations for 30 ns each were run for the best lead compounds, that is, 6, 8, and 9 and their MMGBSA, MMPBSA, and MMBAPPL scores along with their standard mean of errors were calculated to enhance confidence in the protocol (Table S1).
Detailed interaction analysis of the best lead compounds
Analysis of inhibitory potential and cellular cytotoxicity clearly indicated that ZINC compound 6 and isatin‐based compounds 8 and 9 were the best lead compounds, with some of the lowest K i values (in low micromolar range), and with MTT assays showing more than 80% viable cells at inhibitor concentrations as high as 200 μm. Detailed analysis of 100 ns molecular dynamics simulations revealed that compound 6 on an average made four hydrogen bonds with the active site residues of HAV 3C protease throughout the simulations (Fig. 5). The most favorable structure obtained from 100 ns molecular dynamics simulations showed hydrogen bonds with substrate‐binding residues, consisting of backbone NH atoms of Gly170 and Gly194; backbone O of Val144 and the side‐chain NH atoms of Arg26 along with multiple hydrophobic contacts, resulting in high binding affinity. The residues Gly 194, Val144, and Gly 170 are located on the S3, S2, and S1 sites of the protease, respectively 27 (Fig. 6). The isatin‐based compounds 8 and 9 showed a network of multiple hydrogen bonds and hydrophobic interactions with the substrate‐binding and catalytic site residues. The most favorable structures obtained from the overall trajectory showed these compounds forming hydrogen bonds with SH of Cys172 and NH of His191 among other interactions (Fig. 2B). An increase in distance between the thiol group of Cys172 and imidazole group of at the catalytic site was observed for all eight compounds, which was probably crucial for inhibition of the protease activity in our assays.
Figure 5.
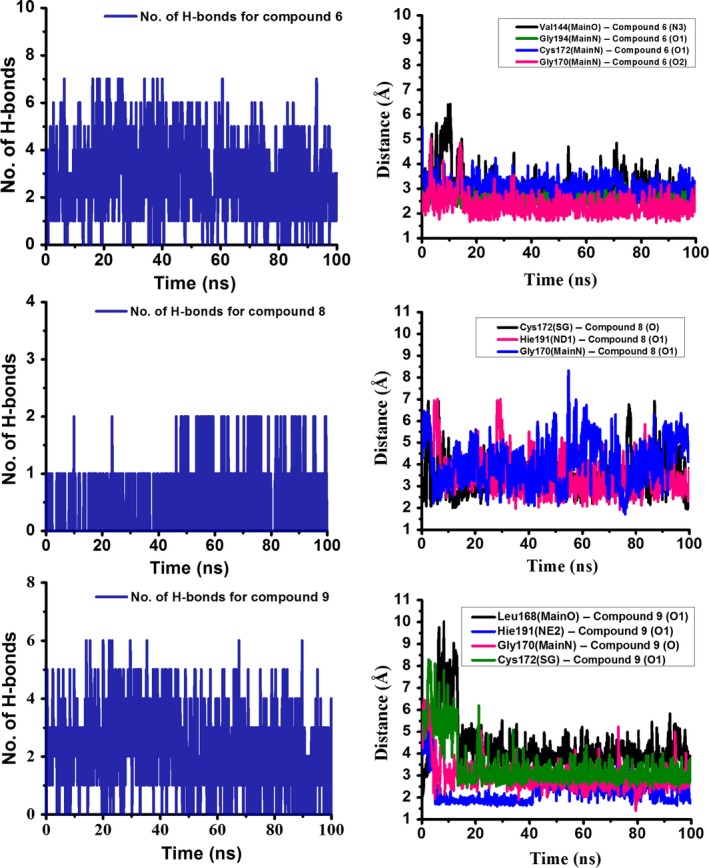
Plot showing number of hydrogen bonds formed during the 100 ns molecular dynamics simulations along with fluctuation of hydrogen bond distance as a function of time for the hydrogen bonds forming residues for the compounds 6, 8, and 9. The hydrogen bond distance is calculated between heavy atoms and is within the acceptable limits (cutoff of 3 Å donor‐acceptor heavy atoms distance and cut off of 120 degrees for bond angles) 72.
Figure 6.
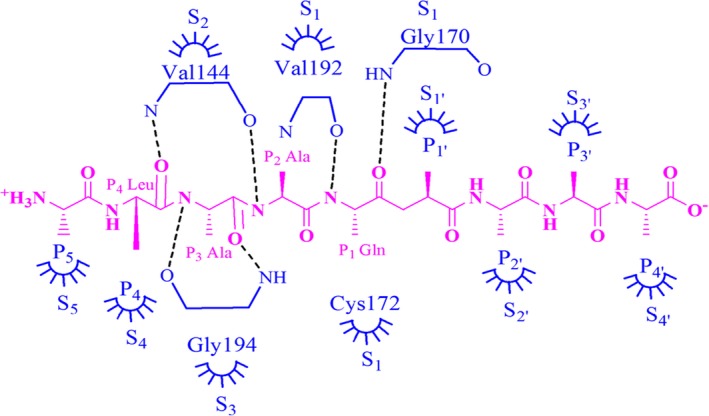
Specific subsites of HAV 3C protease 27. Residues colored in blue belong to HAV 3C protease. The subsites are named as has been reported 27 where hydrogen bonding interactions are reported for main‐chain N of Val144 with O of P4‐Leu and main‐chain O of Val144 with N of P2‐Ala (or P2‐Phe), the main‐chain O of Gly194 with N of P3‐Ala and the main‐chain N of Gly194 with O of P3‐Ala (or P3‐Phe) and the main‐chain N of Gly170 with O of (P1‐Gln). The work also mentions the S2 site to be formed by the side‐chain atoms of His44, Phe48, Tyr143, His145, and Leu155 and the main‐chain atoms of His44, Tyr143, Val144, and His145. (Yin et al. have shown in their work how these residues play roles at S1, S2, and S3 subsites in HAV 3C protease 27).
Inhibition of HRV 3C by compounds 1–9 is comparable to that seen for HAV 3C
Structural and functional similarities among the 3C proteases of picornaviruses (Fig. 7) encouraged us to explore the effect of compounds 1–9 on the protease from Human Rhinovirus (Fig. 8). Computational docking (Fig. 8) and simulation studies along with experimental assays (Table 8), carried out as described before, indicated that the inhibitory effects of our compounds against the 3C protease of Human Rhinovirus 14 (HRV14 3C) were comparable to those demonstrated against HAV 3C as shown in Table 1. In this case also, compounds 6, 8, and 9 displayed inhibition at low micromolar range with K i values of ~ 2.6, 2.5, and 1.6 μm, respectively.
Figure 7.
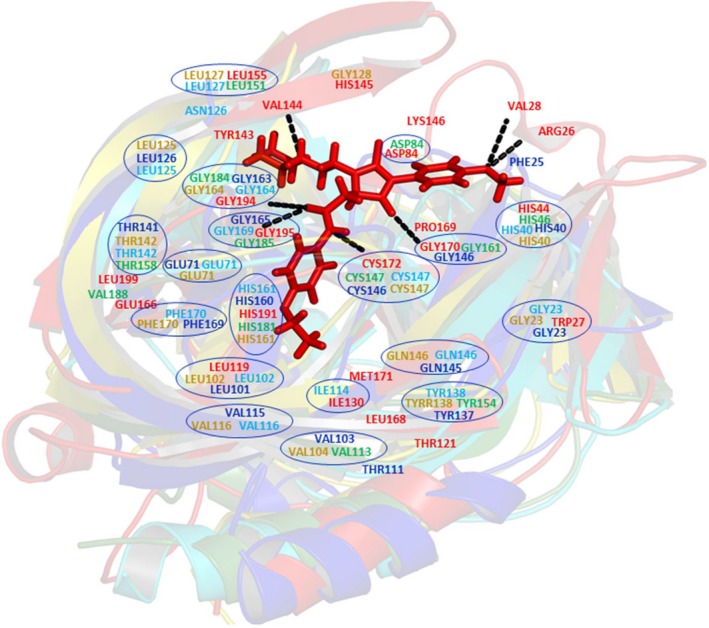
Superimposition of 3C proteases of picornaviruses showing similar active site residues (highlighted with blue circles). Red color residues belong to Hepatitis A virus (PDB ID: http://www.rcsb.org/pdb/search/structidSearch.do?structureId=2CXV 26), Dark blue color residues belong to Human Rhinovirus 14 (PDB ID: http://www.rcsb.org/pdb/search/structidSearch.do?structureId=2IN2 68), Green color residues belong to Foot and Mouth Disease Virus (PDB ID: http://www.rcsb.org/pdb/search/structidSearch.do?structureId=2BHG 73), Yellow color residues belong to Poliovirus (PDB ID: http://www.rcsb.org/pdb/search/structidSearch.do?structureId=1L1N 74), Cyan color residues belong to Coxsackievirus B3 (PDB ID: http://www.rcsb.org/pdb/search/structidSearch.do?structureId=2VB0 54). Stick model representation of compound 6 (interacting with HAV 3C protease). The figure is generated using pymol (https://pymol.org/2/).
Figure 8.
Interaction patterns of the nine identified compounds 1–9 showing hydrophobic and hydrogen bond contacts with the active site residues of HRV14 3C protease (PDB ID: http://www.rcsb.org/pdb/search/structidSearch.do?structureId=2IN2). The interaction diagrams are of protein–ligand complexes obtained from best binding docked poses. These plots have been generated using ligplot software 71.
Table 8.
Determination of inhibition constants (K i) of compounds 1–9 against HRV14 3C protease. Calculated K i values are mentioned along with 95% confidence intervals (CI). Graphs are plotted between peptide concentrations in μm versus reaction velocity in fluorescence units (FU)·s−1. In all cases, R square values were > 0.98. Curve‐fitting was carried out using graphpad prism 5
This article is being made freely available through PubMed Central as part of the COVID-19 public health emergency response. It can be used for unrestricted research re-use and analysis in any form or by any means with acknowledgement of the original source, for the duration of the public health emergency.
Discussion
Structure‐based drug design has become a prevalent method to obtain rationally designed inhibitors against specific disease‐associated proteins 43. Virtual screening performed with existing databases of small peptidic or nonpeptidic molecules yields valuable hits, which upon optimal modifications can display better interactions with the target protein that can be verified through molecular docking and simulation studies. Molecules which show advantageous interaction parameters can be subjected to in vitro testing, followed by cycles of further modifications and experimental validation.
Acute hepatitis caused by Hepatitis A Virus, although primarily nonfatal, creates significant morbidity in the world's population. Sporadic outbreaks around the world, and absence of specific treatment, have increased the healthcare burden associated with this viral infection 44, 45, 46. The importance of 3C protease in the processing of viral proteins makes it a key component in establishment of infection. Further, the structural and functional similarities among the 3C proteases from picornaviruses make this enzyme a viable drug target for generic drug development. In the current study, we have utilized the principles of structure‐based drug design to identify novel compounds against the 3C protease of HAV. Several of these compounds have shown efficacy against the functionality of HAV 3C protease in the low micromolar range, along with reduced cytotoxicity. Through computational analyses, we selected nine compounds, (seven from ZINC library and two isatin derivatives), and the inhibitory activity of all compounds was validated through in vitro enzymatic assays. We found that eight out of the nine compounds bound competitively to HAV 3C and showed inhibition at the low micromolar range, with compounds 6, 8, and 9 proposed as best leads, based on effective inhibition and low cytotoxicity. The compounds were also tested against the 3C protease of HRV14, another member of the picornavirus family, and comparable inhibition parameters were obtained.
Among the previously reported peptide‐based inhibitors against HAV 3C protease, D‐N‐Cbz‐serine β‐lactone showed competitive inhibition at 1.5 μm; however, its enantiomer irreversibly inactivated 3C with much lower inhibitory potential 47. The most active keto‐glutamine analogs 48 demonstrated K i of 9 μm. Nonpeptide inhibitors of HAV 3C displayed inhibition in the nanomolar range, which was probably occasioned due to the exceptionally low K m values of the halopyridinyl ester substrates 49. Peptidyl monofluoromethyl ketone inhibitors against HAV 3C were ineffective due to poor oral bioavailability 50. A peptide aldehyde inhibitor 40 showed potent activity against HAV 3C; however, it was not similarly effective against other picornaviral proteases, showing 50‐fold less inhibition against HRV14 3C protease. On the other hand, tripeptide aldehyde inhibitors 51 showed low micromolar range inhibitory activity against only HRV14 3C. Isatin inhibitors against HRV14 3C showed strong activity but were toxic in cell culture even in nanomolar concentrations 52, while the isatin‐based compounds designed by us (compounds 8 and 9) have not only shown potent inhibition but have also been essentially nontoxic even at very high inhibitor concentrations (200 μm). Other isatin derivatives have been shown to inhibit SARS‐coronavirus 3C‐like protease with comparable activity 19, 53, but as far as we know, this is the first description of isatins as effective inhibitors against HAV 3C protease. We found that the MMBAPPL (a scoring protocol for calculating binding affinity for protein–ligand complexes for various binding poses occurring during molecular simulations) score strongly correlates to the experimental K i values, as compared to the MMGBSA and MMPBSA scores, which has increased our confidence in the protocol (Fig. S2). Moreover, the stringent screening cutoff of a −10 kcal·mol−1 docking binding energy threshold likely played a key role in predicting true potential inhibitors (Fig. S6), which later showed low micromolar range inhibition via experimental enzyme binding assays. Thus, based on our computational and functional studies, we conclude that compounds 1, 3, 4, 6, 7, 8, and 9 are able to show strong inhibitory potential at low micromolar concentrations against the 3C protease of two members of the Picornaviridae family — HAV and HRV.
The Picornaviridae family consists of 80 species grouped into 35 genera. The active sites of all 3C proteases from the family, from experimentally determined structures, show common amino acid patterns consisting of eight polar residues (namely Thr, Glu, His2, Tyr, Cys, Gln, and Asp) and 10 nonpolar residues (namely Leu3, Val2, Phe, Gly3, and Ile), depicting approximately 86% binding pocket similarity, although there is significant difference in the overall protease structures (Table S2). These common residues can give rise to 10 hydrophobic contacts and 13 hydrogen bonding interactions (10 hydrogen bond donors and 3 hydrogen bond acceptors) with an ideal ligand. Guided by these observations, we extended our computational analysis of these nine compounds against the active sites of 3C proteases from other important members of picornavirus family such as Poliovirus, Coxsackievirus B3, Foot and Mouth Disease Virus, and Enteroviruses EV‐D68 as well as EV‐A71 (Fig. 9 and Table S3). The active site residues from 3C proteases of all of these picornaviruses displayed the potential to form an average of 4‐5 hydrogen bonds along with 13 hydrophobic contacts with our compounds. Our studies indicate that the compounds 1, 3, 4, 6, 7, 8, and 9 showing acceptable ADME properties (Table S4) and binding profiles (Table S3) can serve as effective inhibitors against these proteases as well.
Figure 9.
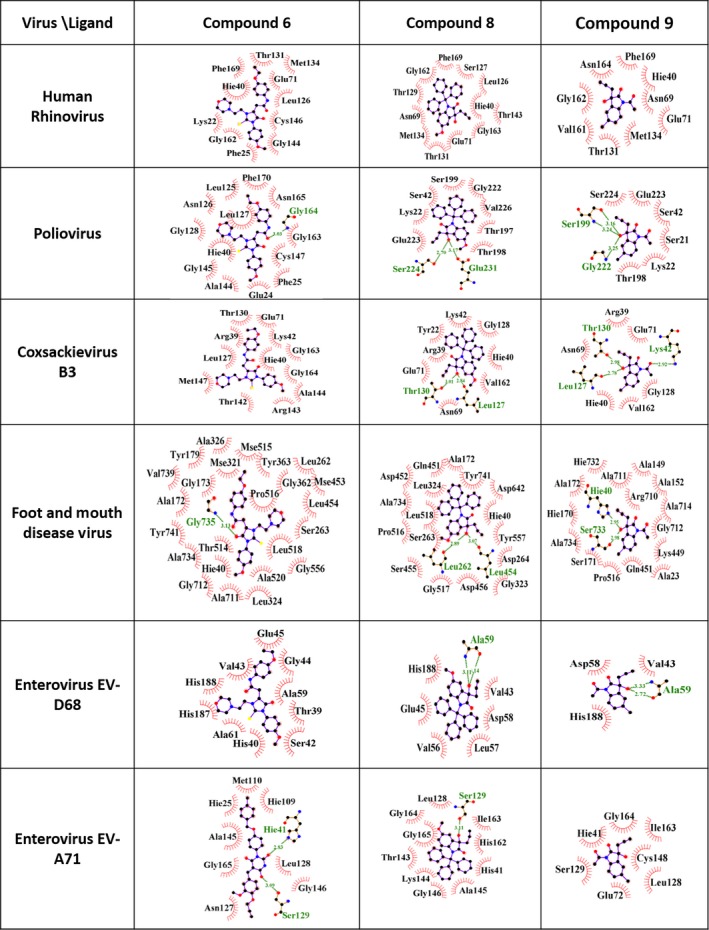
Interaction patterns of the three best proposed compounds 6, 8, and 9 showing hydrogen bonding and van der Waals contact network shown in 2D, depicting similar patterns of interactions within 3C proteases of intraspecies of picornavirus family, namely Human Rhinovirus 14, Poliovirus, Coxsackievirus B3, Foot and Mouth Disease Virus, Enteroviruses EV‐D68 and EV‐A71, respectively. These plots have been generated using ligplot software 71.
In conclusion, the degree of intraspecies overlap of the active sites of picornavirus 3C proteases and the computational and experimental studies indicate the efficacy of our identified compounds as broad‐range inhibitors against these seven proteases. Compound 6 and isatin derivatives 8 and 9 in particular, could possibly be used as lead compounds for further testing against this family of proteases. This work thus highlights the feasibility of designing and developing generic drugs against the 3C proteases of the picornavirus family.
Materials and methods
A schematic representation of the methodology adopted for identifying and designing of potential inhibitors against HAV 3C protease is shown in Fig. 10.
Figure 10.
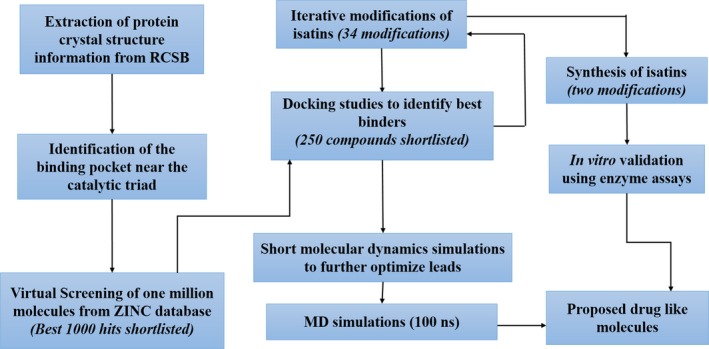
Flowchart explains the methodology employed for screening, designing, synthesis, and in vitro validation of inhibitors against HAV 3C protease. The protocol starts from obtaining 3D coordinates information from crystal structure, followed by active site‐based ligand screening, docking, and molecular dynamics simulation studies leading to seven proposed molecules from ZINC database. Simultaneous iterative modifications in isatin‐based scaffold lead to identification of two best binders which were then synthesized. All the proposed molecules were tested against HAV 3C via enzyme assays.
Computational methodology
The X‐ray crystal structure of HAV 3C protease (PDB ID: http://www.rcsb.org/pdb/search/structidSearch.do?structureId=2CXV 26) was obtained from RCSB 54. According to published literature, the catalytic mechanism of HAV 3C involves the abstraction of the proton from Sγ of Cys172 by Nε of His44, resulting in the thiolate ion (nucleophile), attacking the carbonyl carbon of the peptide substrate. In our computational study, the ionization state of His44 was kept as HID44, so that the Nε of HID44 can interact with Sγ H of Cys172 via a hydrogen bond 27, while all other histidines were kept in HIE state using AMBER14 force field 26, 55, 56, 57. Probable binding pockets/sites were predicted using active site prediction program (AADS), and the predicted binding pocket in the vicinity of the catalytic triad was selected for further analysis. The protein atoms were assigned partial atomic charges, van der Waals and bonded parameters using the ff14SB 57, 58, 59 AMBER force field. The antechamber module of AMBER was used to assign the parameters and charges to the ligand atoms using gaff 57 and am1bcc 57, respectively. A million molecules from the ZINC database were screened against the catalytic site of HAV 3C protease to filter out the best 1000 hits which were individually docked and scored against the protease. The screening protocol (RASPD) has been tested and validated against the DUD dataset earlier which showed the best early enrichment of 14.23%, with approximately 30% of active molecules being retrieved in the first 10% of the dataset 30. Docking and scoring studies were carried out using ParDOCK 31, 32 and a threshold of at least −10 kcal·mol−1 binding energy was utilized as a cutoff for compound selection. The threshold criterion was further validated via testing the docking algorithm against various enzyme targets and their respective decoys available from the DUD site 60. The ParDOCK docking protocol was able to remove ~99% of the decoys when the threshold was set to −10 kcal·mol−1 (Table S5 and Fig. S6). The compounds showing significantly high binding were then subjected to short molecular dynamics simulations.
All molecular dynamics simulations were carried out using AMBER suite 57, 58, 59. To account for the flexibility of the ligand and the active site residues with explicit solvent and salt effects, required numbers of Na+ and Cl− ions were added to the system, followed by solvation with a 12 Å thick layer of water (TIP3P 61 model) around the protein–ligand complex. The prepared system was first subjected to minimization of solvent molecules alone, for 2500 steepest descent and 2500 conjugate gradient steps. This was followed by minimization of the whole solute‐solvent system for 2500 steepest descent and 2500 conjugate gradient steps. The energy minimized system was then heated gradually in NVT ensemble up to 300 K while subjecting the protein–ligand complex to harmonic restraints of 25 kcal·mol−1. Afterward, the system was equilibrated in NPT ensemble at 300 K and a pressure of 1 bar using the Berendsen barostat while releasing the harmonic restraints on the complex from 5 to 0.1 kcal·mol−1, in six steps of 50 ps each. Finally, all restraints were released and 100 ns production run in NPT ensemble (P = 1 bar, T = 300 K) was carried out. The overall binding free energy of the protein–ligand complexes throughout the trajectories was calculated using MMBAPPL 62, MMGBSA, and MMPBSA 63, 64. MMGBSA and MMPBSA are popular approaches where the molecular mechanics energies are combined with the Poisson–Boltzmann or generalized Born and surface area continuum solvation to get an estimate of binding free energies of small ligands to biological macromolecules. MMBAPPL is an empirical scoring function to predict the binding free energies of protein–ligand complexes. These scores, when generated for each snapshot of molecular dynamics simulations, provide a better understanding of the inhibitory potential of a compound over time, based on the predicted binding free energies. For each system simulated, the root mean squared deviation, energy (kinetic, potential, and total), density and temperature was monitored to ensure that the standard deviation of each of these values were within acceptable limits. A total of 250 short molecular dynamics simulations of 10 ns each were performed where majority of the compounds studied showed instability of protein–ligand complexes which was reflected in their RMSD values. Only the complexes showing stable behavior after 10 ns simulations were subjected to further analysis. Extended simulations were run till 100 ns to understand the behavior of ligand in the docked complex. The binding energies of the complexes were calculated using MMBAPPL during those parts of molecular dynamics simulations where the complexes were found to exist for maximum time (Fig. S1). Further, 25 compounds from isatin in‐house library 39 were docked and scored against HAV 3C protease to check for their inhibitory potential. All isatin compounds showed low binding potential computationally; hence iterative modifications in their structure were undertaken. Eventually, 34 modified isatin compounds showed better results in terms of interactions and binding free energies with HAV 3C.
Chemical synthesis
3‐bromoprop‐1‐yne 2 was purchased from Sigma‐Aldrich (Bangalore, India) and used without further purification. N‐protected isatins (compound 8 and compound 9) were prepared according to procedures outlined in literature 65, 66, 67 (Fig. S4).
Cloning, protein expression, and purification
HAV 3C protease was amplified from cDNA corresponding to HAV strain HM175, and subcloned into the expression vector pET‐28b (Novagen, Merck, Darmstadt, Germany), using the restriction enzymes NcoI and XhoI (NEB, Ipswich, MA, USA), so as to incorporate a 6× His tag at the C‐terminal end of 3C. C172A and C24S modifications were introduced in 3C‐pET‐28b by site‐directed mutagenesis as per standard protocol (Stratagene, La Jolla, CA, USA). Wild‐type and mutated 3C‐ pET‐28b constructs were transformed in Rosetta (DE3) pLysS cells and protein expression was induced with 0.1 mm IPTG at 25 °C. After 1.5 h of expression, cells were pelleted, resuspended in a buffer containing 50 mm NaH2PO4 pH 8.0, and 300 mm NaCl and lysed through French press. The protein was purified through Ni‐NTA affinity chromatography, dialyzed in a buffer containing 50 mm NaH2PO4 pH 8.0, 150 mm NaCl, 2 mm DTT, and 2.5 mm EDTA, and further subjected to size‐exclusion chromatography in a Superdex 75 column (GE Healthcare, Little Chalfont, Buckinghamshire, UK). Approximately, 12 mg of protein was obtained from 1 L bacterial culture.
In vitro protease assays
For all enzymatic assays, 0.1 μm HAV 3C in a 100 μL reaction buffer of 50 mm NaH2PO4 pH 8.0 and 150 mm NaCl was used. HRV14 3C was also used at a concentration of 0.1 μm, in 100 μL of reaction buffer consisting of 50 mm Tris‐HCl pH 7.5, and 150 mm NaCl. Stocks of all compounds were made in DMSO and their working solutions were prepared in assay buffer. Fluorogenic substrate peptide stocks were dissolved in water. First, compounds were tested for inner filter effect at different concentrations by measuring their absorption spectra from 200 to 700 nm using a UV‐Vis spectrophotometer (Beckman Coulter, Indianapolis, IN, USA). To determine the dissociation constant (K d) of compounds, 3C was titrated with increasing concentrations of compounds, with readings taken at an excitation wavelength (λex) of 295 nm and emission wavelength (λem) of 330 nm using a fluorescence spectrometer (PerkinElmer, Hopkinton, MA, USA). Every reading was taken after 30 s of addition of compound to 3C. A similar titration with increasing concentrations of DMSO was carried out as control to check whether it has any contribution to the experimentally observed fluorescence values. Further, 3C was titrated with the fluorogenic substrate peptide to assess the Michaelis–Menten kinetics and to obtain K m and V max values. Once the dissociation constants were obtained, the compounds were added to 3C at concentrations slightly lower than K d and incubated for 15 min. Subsequently, increasing concentrations of the fluorogenic peptide were added and readings were taken at λex = 336 nm and λem = 472 nm. All data were collected in triplicates.
Determination of kinetic parameters
The data obtained from each experiment were analyzed using graphpad prism version 5.03 for Windows, graphpad Software, http://www.graphpad.com. For determination of competitive inhibition, the data were checked for curve‐fitting into the equation: Y = (V max*S)/[K m(1 + I/K i) + S], where S is substrate concentration, Y is enzyme velocity, V max is maximum enzyme velocity, K m is Michaelis–Menten constant, I is inhibitor concentration, and K i is inhibition constant. For data fitting into the allosteric sigmoidal model, the equation used was Y = V max*Sh/(K prime + S h), where h is Hill's slope and K prime is related to Michaelis constant. Analysis using other modes of inhibition such as noncompetitive or mixed inhibition resulted in higher regression coefficients, standard errors and wider 95% confidence intervals. This indicates that the selection of equations for curve‐fitting was justified.
Cells and toxicity studies
HEK293T cells were maintained in Dulbecco's Modified Eagle's Medium (Gibco, Thermo Scientific, Waltham, MA, USA) supplemented with 10% Fetal Bovine Serum (Gibco, Thermo Scientific), in an environment with 5% CO2, 95% humidity at 37 °C. For toxicity studies, cells were seeded in a 96‐well plate (Corning, Merck) with a seeding density of 50 000 cells per well. Upon reaching 80% confluency, cells were treated with increasing concentrations of compounds 1–9, incubated for 24 h and subsequently, MTT assay was carried out. An amount of 10 μL of 12 mm MTT (Invitrogen, Thermo Scientific) stock solution was added to each well and incubated for 4 h at 37 °C. The media was removed and 50 μL DMSO was added and mixed thoroughly, followed by incubation for 10 min at 37 °C. Readings were taken at 540 nm using a microplate spectrophotometer system (Thermo Scientific). All assays were done in triplicates and the results were expressed as percentage of cell viability.
Extended computational analysis of picornaviral 3C protease
Theoretical studies revealed that the pattern of active site residues is similar in 3C proteases of all well‐known members of the Picornaviridae family. Potential inhibitors identified against HAV 3C were computationally analyzed against HRV14 3C protease (PDB ID: http://www.rcsb.org/pdb/search/structidSearch.do?structureId=2IN2 68) using the same protocol. Further, similar computational studies were performed on six other members (Poliovirus, Coxsackievirus B3, Foot and Mouth Disease Virus, Enteroviruses EV‐D68 and EV‐A71) of the picornavirus family.
Author contributions
BJ, MB, and RPS conceived the project. RB, KLR, SG carried out the computations. VUBR carried out synthesis. KB and AN conducted the experiments. KB, RB, MB, and BJ analyzed the results and wrote the manuscript. All authors have given approval to the final version of the manuscript.
Supporting information
Fig. S1. Convergence plots of RMSD of ligands and backbones of HAV 3C proteases bound with compounds 1–9.
Fig. S2. Correlation plots of eight compounds (excluding compound 5) in complex with HAV 3C protease (A) MMGBSA versus Ki values, (B) MMPBSA versus Ki values, (C) MMBAPPL scores versus Ki values, (D) MMBAPPL scores versus MMPBSA, (E) MMBAPPL scores versus MMGBSA, (F) ParDOCK versus MMGBSA, (G) AutoDock versus ParDOCK, (H) SwissDock versus ParDOCK, (I) SwissDock versus AutoDock, (J) SwissDock versus Ki values, (K) AutoDock versus Ki values, and (L) ParDOCK versus Ki values.
Fig. S3. The binding pose of compound 9 during the fluctuations in RMSD (at 20 ns) is shown in magenta color and the (biggest cluster) most favorable binding pose of compound 9 (at 95 ns) is shown in blue color.
Fig. S4. Synthesis data and 1H and 13C spectra of compounds 8 and 9.
Fig. S5. Size‐exclusion chromatograms of purified HAV 3C protease and its double mutant.
Fig. S6. ROC curves for four cases (ACHE, ALR2, AMPC, and HIVPR) target enzymes.
Table S1. The MMGBSA, MMPBSA, and MMBAPPL estimated binding free energies along with their standard error of means for five separate molecular dynamics simulations of 30 ns for each best inhibitor (compounds 6, 8, and 9) with HAV 3C protease.
Table S2. Active site residues and similarity scores for 3C proteases of 14 species of the Picornaviridae family.
Table S3. Predicted binding free energies of compounds 1–9 with 3C proteases from different picornaviruses, obtained after docking and scoring.
Table S4. Computationally predicted ADME properties of the identified compounds 1–9.
Table S5. Some case studies (target enzymes) checked against DUD decoys dataset.
Acknowledgments
The authors thank Prof Stanley Lemon (University of North Carolina School of Medicine, USA) for providing cDNA corresponding to HAV strain HM175 and Prof Ashok Patel (Kusuma School of Biological Sciences, IIT Delhi, India) for providing Human Rhinovirus 14 3C protease. Support to SCFBio from Department of Biotechnology, Govt. of India is gratefully acknowledged. KB acknowledges fellowship support from IIT Delhi. RB is a DST INSPIRE Fellow.
Kamalika Banerjee and Ruchika Bhat contributed equally to this article.
Contributor Information
Manidipa Banerjee, Email: mbanerjee@bioschool.iitd.ac.in.
Bhyravabhotla Jayaram, Email: bjayaram@chemistry.iitd.ac.in.
References
- 1. Yong HT & Son R (2009) Review article hepatitis A virus – a general overview. Int Food Res J 467, 455–467. [Google Scholar]
- 2. Lemon SM (1997) Type A viral hepatitis: epidemiology, diagnosis, and prevention. Clin Chem 43, 1494–1499. [PubMed] [Google Scholar]
- 3. Lemon SM, Ott JJ, Van Damme P & Shouval D (2018) Type A viral hepatitis: a summary and update on the molecular virology, epidemiology, pathogenesis and prevention. J Hepatol 68, 167–184. [DOI] [PubMed] [Google Scholar]
- 4. Campos‐Outcalt D (2018) CDC provides advice on recent hepatitis A outbreaks. J Fam Pract 67, 30–32. [PubMed] [Google Scholar]
- 5. Pérez‐Sautu U, Costafreda MI, Caylà J, Tortajada C, Lite J, Bosch A & Pintó RM (2011) Hepatitis A virus vaccine escape variants and potential new serotype emergence. Emerg Infect Dis 17, 734–737. [DOI] [PMC free article] [PubMed] [Google Scholar]
- 6. Abbas M, Shamshad T, Ashraf M & Javaid R (2016) Jaundice: a basic review. Int J Res Med Sci 4, 1313–1319. [Google Scholar]
- 7. Pallavi K, Sravani D, Pn D, Durga S, Pns P, Ps B & Raviteja K (2017) iMedPub journals hepatitis: a review on current and future scenario keywords : hepatitis‐B. J In Silico In Vitro Pharmacol 3, 1–5. [Google Scholar]
- 8. Blom N, Hansen J, Brunak S & Blaas D (1996) Cleavage site analysis in picornaviral polyproteins: discovering cellular targets by neural networks. Protein Sci 5, 2203–2216. [DOI] [PMC free article] [PubMed] [Google Scholar]
- 9. Kanda T, Gauss‐Müller V, Cordes S, Tamura R, Okitsu K, Shuang W, Nakamoto S, Fujiwara K, Imazeki F & Yokosuka O (2009) Hepatitis A virus (HAV) proteinase 3C inhibits HAV IRES‐dependent translation and cleaves the polypyrimidine tract‐binding protein. J Viral Hepat 17, 618–623. [DOI] [PubMed] [Google Scholar]
- 10. Zhang B, Morace G, Gauss‐Müller V & Kusov Y (2007) Poly(A) binding protein, C‐terminally truncated by the hepatitis A virus proteinase 3C, inhibits viral translation. Nucleic Acids Res 35, 5975–5984. [DOI] [PMC free article] [PubMed] [Google Scholar]
- 11. Wang D, Fang L, Wei D, Zhang H, Luo R, Chen H, Li K & Xiao S (2014) Hepatitis A virus 3C protease cleaves NEMO to impair induction of beta interferon. J Virol 88, 10252–10258. [DOI] [PMC free article] [PubMed] [Google Scholar]
- 12. Anand K, Ziebuhr J, Wadhwani P, Mesters JR & Hilgenfeld R (2003) Coronovirus main proteinase (3CLpro) structure: basis for design of anti‐SARS drugs. Science 300, 1763–1767. [DOI] [PubMed] [Google Scholar]
- 13. Yang H, Yang M, Ding Y, Liu Y, Lou Z, Zhou Z, Sun L, Mo L, Ye S, Pang H et al (2003) The crystal structures of severe acute respiratory syndrome virus main protease and its complex with an inhibitor. Proc Natl Acad Sci USA 100, 13190–13195. [DOI] [PMC free article] [PubMed] [Google Scholar]
- 14. Sliwoski G, Kothiwale S, Meiler J & Lowe EW (2014) Computational methods in drug discovery. Pharmacol Rev 66, 334–395. [DOI] [PMC free article] [PubMed] [Google Scholar]
- 15. Elliott M (2001) Zanamivir: from drug design to the clinic. Philos Trans R Soc Lond B Biol Sci 356, 1885–1893. [DOI] [PMC free article] [PubMed] [Google Scholar]
- 16. Lew W, Chen X & Kim C (2000) Discovery and development of GS 4104 (oseltamivir) an orally active influenza neuraminidase inhibitor. Curr Med Chem 7, 663–672. [DOI] [PubMed] [Google Scholar]
- 17. Luo M, Air GM & Brouillette WJ (1997) Design of aromatic inhibitors of influenza virus neuraminidase. J Infect Dis 176 (Suppl), S62–S65. [DOI] [PubMed] [Google Scholar]
- 18. Vella S, Lazzarin A, Carosi G, Sinicco A, Armignacco O, Angarano G, Andreoni M, Tambussi G, Chiodera A, Floridia M et al (1996) A randomized controlled trial of a protease inhibitor (saquinavir) in combination with zidovudine in previously untreated patients with advanced HIV infection. Antivir Ther 1, 129–140. [PubMed] [Google Scholar]
- 19. Selvam P, Murgesh N, Chandramohan M, De Clercq E, Keyaerts E, Vijgen L, Maes P, Neyts J & Ranst MV (2008) In vitro antiviral activity of some novel isatin derivatives against HCV and SARS‐CoV viruses. Indian J Pharm Sci 70, 91–94. [DOI] [PMC free article] [PubMed] [Google Scholar]
- 20. Meleddu R, Distinto S, Corona A, Tramontano E, Melis C, Cottiglia F, Maccioni E, Meleddu R, Distinto S, Corona A et al (2017) Isatin thiazoline hybrids as dual inhibitors of HIV‐1 reverse transcriptase. J Enzyme Inhib Med Chem 32, 130–136. [DOI] [PMC free article] [PubMed] [Google Scholar]
- 21. Medvedev A & Buneeva O (2007) Biological targets for isatin and its analogues: implications for therapy. Biologics 1, 151–162. [PMC free article] [PubMed] [Google Scholar]
- 22. Lian Z‐M, Sun J & Zhu H‐L (2016) Design, synthesis and antibacterial activity of isatin derivatives as FtsZ inhibitors. J Mol Struct 1117, 8–16. [Google Scholar]
- 23. Jarrahpour A, Khalili D, De Clercq E, Salmi C & Brunel JM (2007) Synthesis, antibacterial, antifungal and antiviral activity evaluation of some new bis‐Schiff bases of isatin and their derivatives. Molecules 12, 1720–1730. [DOI] [PMC free article] [PubMed] [Google Scholar]
- 24. Havrylyuk D, Kovach N, Zimenkovsky B, Vasylenko O & Lesyk R (2011) Synthesis and anticancer activity of isatin‐based pyrazolines and thiazolidines conjugates. Arch Pharm (Weinheim) 344, 514–522. [DOI] [PubMed] [Google Scholar]
- 25. De Moraes Gomes PAT, Pena LJ & Leite ACL (2018) Isatin derivatives and their antiviral properties against arboviruses, a Review. Mini‐Reviews Med. Chem. 18, 1–2. [DOI] [PubMed] [Google Scholar]
- 26. Yin J, Bergmann EM, Cherney MM, Lall MS, Jain RP, Vederas JC & James MNG (2005) Dual modes of modification of hepatitis A virus 3C protease by a serine‐derived β‐lactone: selective crystallization and formation of a functional catalytic triad in the active site. J Mol Biol 354, 854–871. [DOI] [PMC free article] [PubMed] [Google Scholar]
- 27. Yin J, Cherney MM, Bergmann EM, Zhang J, Huitema C, Pettersson H, Eltis LD, Vederas JC & James MNG (2006) An episulfide cation (thiiranium ring) trapped in the active site of HAV 3C proteinase inactivated by peptide‐based ketone inhibitors. J Mol Biol 361, 673–686. [DOI] [PMC free article] [PubMed] [Google Scholar]
- 28. Singh T, Biswas D & Jayaram B (2011) AADS – an automated active site identification, docking, and scoring protocol for protein targets based on physicochemical descriptors. J Chem Inf Model 51, 2515–2527. [DOI] [PubMed] [Google Scholar]
- 29. Irwin JJ & Shoichet BK (2005) ZINC–a free database of commercially available compounds for virtual screening. J Chem Inf Model 45, 177–182. [DOI] [PMC free article] [PubMed] [Google Scholar]
- 30. Mukherjee G & Jayaram B (2013) A rapid identification of hit molecules for target proteins via physico‐chemical descriptors. Phys Chem Chem Phys 15, 9107. [DOI] [PubMed] [Google Scholar]
- 31. Gupta A, Sharma P & Jayaram B (2007) ParDOCK: an all atom energy based monte carlo docking protocol for protein‐ligand complexes. Protein Pept Lett 14, 632–646. [DOI] [PubMed] [Google Scholar]
- 32. Jayaram B, Singh T, Mukherjee G, Mathur A, Shekhar S & Shekhar V (2012) Sanjeevini: a freely accessible web‐server for target directed lead molecule discovery. BMC Bioinformatics 13, S7. [DOI] [PMC free article] [PubMed] [Google Scholar]
- 33. Welsch ME, Snyder SA & Stockwell BR (2010) Privileged scaffolds for library design and drug discovery. Curr Opin Chem Biol 14, 347–361. [DOI] [PMC free article] [PubMed] [Google Scholar]
- 34. Sherer C & Snape TJ (2015) Heterocyclic scaffolds as promising anticancer agents against tumours of the central nervous system: exploring the scope of indole and carbazole derivatives. Eur J Med Chem 97, 552–560. [DOI] [PubMed] [Google Scholar]
- 35. Gabriel D, Pontes LB, Da Silva JS, Sudo RT, Corrêa MB, Pinto AC, Garden SJ & Zapata‐Sudo G (2011) Pharmacological activity of novel 2‐hydroxyacetophenone isatin derivatives on cardiac and vascular smooth muscles in rats. J Cardiovasc Pharmacol 57, 20–27. [DOI] [PubMed] [Google Scholar]
- 36. Nain S (2014) Recent advancement in synthesis of isatin as anticonvulsant agents: a review. Med Chem (Los Angeles) 4, 417–427. [Google Scholar]
- 37. Pandeya SN, Smitha S, Jyoti M & Sridhar SK (2005) Biological activities of isatin and its derivatives. Acta Pharm 55, 27–46. [PubMed] [Google Scholar]
- 38. Pakravan P, Kashanian S, Khodaei MM & Harding FJ (2013) Biochemical and pharmacological characterization of isatin and its derivatives: from structure to activity. Pharmacol Rep 65, 313–335. [DOI] [PubMed] [Google Scholar]
- 39. Bhaskara Rao VU, Kumar K & Singh RP (2015) An efficient aldol‐type direct reaction of isatins with TMSCH 2 CN. Org Biomol Chem 13, 9755–9759. [DOI] [PubMed] [Google Scholar]
- 40. Malcolm BA, Lowe C, Shechosky S, McKay RT, Yang CC, Shah VJ, Simon RJ, Vederas JC & Smith DV (1995) Peptide aldehyde inhibitors of hepatitis A virus 3C proteinase. Biochemistry 34, 8172–8179. [DOI] [PubMed] [Google Scholar]
- 41. Bergmann EM, Mosimann SC, Chernaia MM, Malcolm BA & James MN (1997) The refined crystal structure of the 3C gene product from hepatitis A virus: specific proteinase activity and RNA recognition. J Virol 71, 2436–2448. [DOI] [PMC free article] [PubMed] [Google Scholar]
- 42. Jewell D, Malcolm BA, Swietnicki W & Dunn BM (1992) Hepatitis A virus 3C proteinase substrate specificity. Biochemistry 31, 7862–7869. [DOI] [PubMed] [Google Scholar]
- 43. Lounnas V, Ritschel T, Kelder J, McGuire R, Bywater RP & Foloppe N (2013) Current progress in structure‐based rational drug design marks a new mindset in drug discovery. Comput Struct Biotechnol J 5, e201302011. [DOI] [PMC free article] [PubMed] [Google Scholar]
- 44. Taylor RM, Davern T, Munoz S, Han S‐H, McGuire B, Larson AM, Hynan L, Lee WM, Fontana RJ & US Acute Liver Failure Study Group (2006) Fulminant hepatitis A virus infection in the United States: incidence, prognosis, and outcomes. Hepatology 44, 1589–1597. [DOI] [PMC free article] [PubMed] [Google Scholar]
- 45. Chen N‐Y, Liu Z‐H, Shie S‐S, Chen T‐H & Wu T‐S (2017) Clinical characteristics of acute hepatitis A outbreak in Taiwan, 2015‐2016: observations from a tertiary medical center. BMC Infect Dis 17, 441. [DOI] [PMC free article] [PubMed] [Google Scholar]
- 46. Michaelis K, Wenzel JJ, Stark K & Faber M (2017) Hepatitis A virus infections and outbreaks in asylum seekers arriving to Germany, September 2015 to March 2016. Emerg Microbes Infect 6, e26. [DOI] [PMC free article] [PubMed] [Google Scholar]
- 47. Lall MS, Karvellas C & Vederas JC (1999) Beta‐lactones as a new class of cysteine proteinase inhibitors: inhibition of hepatitis A virus 3C proteinase by N‐Cbz‐serine beta‐lactone. Org Lett 1, 803–806. [DOI] [PubMed] [Google Scholar]
- 48. Ramtohul YK, James MNG & Vederas JC (2002) Synthesis and evaluation of keto‐glutamine analogues as inhibitors of hepatitis A virus 3C proteinase. J Org Chem 67, 3169–3178. [DOI] [PubMed] [Google Scholar]
- 49. Huitema C, Zhang J, Yin J, James MNG, Vederas JC & Eltis LD (2008) Heteroaromatic ester inhibitors of hepatitis A virus 3C proteinase: evaluation of mode of action. Bioorg Med Chem 16, 5761–5777. [DOI] [PMC free article] [PubMed] [Google Scholar]
- 50. Morris TS, Frormann S, Shechosky S, Lowe C, Lall MS, Gauss‐Müller V, Purcell RH, Emerson SU, Vederas JC & Malcolm BA (1997) In vitro and ex vivo inhibition of hepatitis A virus 3C proteinase by a peptidyl monofluoromethyl ketone. Bioorg Med Chem 5, 797–807. [DOI] [PubMed] [Google Scholar]
- 51. Webber SE, Okano K, Little TL, Reich SH, Xin Y, Fuhrman SA, Matthews DA, Love RA, Hendrickson TF, Patick AK et al (1998) Tripeptide aldehyde inhibitors of human rhinovirus 3C protease: design, Synthesis, biological evaluation, and cocrystal structure solution of P 1 glutamine isosteric replacements. J Med Chem 41, 2786–2805. [DOI] [PubMed] [Google Scholar]
- 52. Webber SE, Tikhe J, Worland ST, Fuhrman SA, Hendrickson TF, Matthews DA, Love RA, Patick AK, Meador JW, Ferre RA et al (1996) Design, synthesis, and evaluation of nonpeptidic inhibitors of human rhinovirus 3C protease. J Med Chem 39, 5072–5082. [DOI] [PubMed] [Google Scholar]
- 53. Zhou L, Liu Y, Zhang W, Wei P, Huang C, Pei J, Yuan Y & Lai L (2006) Isatin compounds as noncovalent SARS coronavirus 3C‐like protease inhibitors. J Med Chem 49, 3440–3443. [DOI] [PubMed] [Google Scholar]
- 54. Berman HM (2000) The protein data bank. Nucleic Acids Res 28, 235–242. [DOI] [PMC free article] [PubMed] [Google Scholar]
- 55. Pearlman DA, Case DA, Caldwell JW, Ross WS, Cheatham TE, DeBolt S, Ferguson D, Seibel G & Kollman P (1995) AMBER, a package of computer programs for applying molecular mechanics, normal mode analysis, molecular dynamics and free energy calculations to simulate the structural and energetic properties of molecules. Comput Phys Commun 91, 1–41. [Google Scholar]
- 56. Gordon JC, Myers JB, Folta T, Shoja V, Heath LS & Onufriev A (2005) H++: a server for estimating pKas and adding missing hydrogens to macromolecules. Nucleic Acids Res 33, W368–W371. [DOI] [PMC free article] [PubMed] [Google Scholar]
- 57. Wang J, Wolf RM, Caldwell JW, Kollman PA & Case DA (2004) Development and testing of a general amber force field. J Comput Chem 25, 1157–1174. [DOI] [PubMed] [Google Scholar]
- 58. Wang J, Wang W, Kollman PA & Case DA (2006) Automatic atom type and bond type perception in molecular mechanical calculations. J Mol Graph Model 25, 247–260. [DOI] [PubMed] [Google Scholar]
- 59. Maier JA, Martinez C, Kasavajhala K, Wickstrom L, Hauser KE & Simmerling C (2015) ff14SB: improving the accuracy of protein side chain and backbone parameters from ff99SB. J Chem Theory Comput 11, 3696–3713. [DOI] [PMC free article] [PubMed] [Google Scholar]
- 60. Huang N, Shoichet BK & Irwin JJ (2006) Benchmarking sets for molecular docking. J Med Chem 49, 6789–6801. [DOI] [PMC free article] [PubMed] [Google Scholar]
- 61. Mark P & Nilsson L (2001) Structure and dynamics of the TIP3P, SPC, and SPC/E water models at 298 K. J Phys Chem A 105, 9954–9960. [Google Scholar]
- 62. Jain T & Jayaram B (2005) An all atom energy based computational protocol for predicting binding affinities of protein‐ligand complexes. FEBS Lett 579, 6659–6666. [DOI] [PubMed] [Google Scholar]
- 63. Gohlke H & Case DA (2004) Converging free energy estimates: MM‐PB(GB)SA studies on the protein‐protein complex Ras‐Raf. J Comput Chem 25, 238–250. [DOI] [PubMed] [Google Scholar]
- 64. Onufriev A, Bashford D & Case DA (2000) Modification of the generalized born model suitable for macromolecules. J Phys Chem B 104, 3712–3720. [Google Scholar]
- 65. Jung HH, Buesking AW & Ellman JA (2011) Highly functional group compatible Rh‐catalyzed addition of arylboroxines to activated N ‐ tert ‐butanesulfinyl ketimines. Org Lett 13, 3912–3915. [DOI] [PubMed] [Google Scholar]
- 66. Yang W & Du D‐M (2013) Cinchona‐based squaramide‐catalysed cascade aza‐Michael–Michael addition: enantioselective construction of functionalized spirooxindole tetrahydroquinolines. Chem Commun 49, 8842. [DOI] [PubMed] [Google Scholar]
- 67. Chen D & Xu M‐H (2013) Zn‐mediated asymmetric allylation of N‐tert‐butanesulfinyl ketimines: an efficient and practical access to chiral quaternary 3‐aminooxindoles. Chem Commun 49, 1327. [DOI] [PubMed] [Google Scholar]
- 68. Bjorndahl TC, Andrew LC, Semenchenko V & Wishart DS (2007) NMR solution structures of the Apo and peptide‐inhibited human rhinovirus 3C protease (serotype 14): structural and dynamic comparison †. Biochemistry 46, 12945–12958. [DOI] [PubMed] [Google Scholar]
- 69. Morris GM, Huey R, Lindstrom W, Sanner MF, Belew RK, Goodsell DS & Olson AJ (2009) AutoDock4 and AutoDockTools4: automated docking with selective receptor flexibility. J Comput Chem 30, 2785–2791. [DOI] [PMC free article] [PubMed] [Google Scholar]
- 70. Grosdidier A, Zoete V & Michielin O (2011) SwissDock, a protein‐small molecule docking web service based on EADock DSS. Nucleic Acids Res 39, W270–W277. [DOI] [PMC free article] [PubMed] [Google Scholar]
- 71. Wallace AC, Laskowski RA & Thornton JM (1995) Ligplot – a program to generate schematic diagrams of protein ligand interactions. Protein Eng 8, 127–134. [DOI] [PubMed] [Google Scholar]
- 72. Dannenberg JJ (1998) An introduction to hydrogen bonding by George A. Jeffrey (University of Pittsburgh). J Am Chem Soc 120, 5604. [Google Scholar]
- 73. Birtley JR, Knox SR, Jaulent AM, Brick P, Leatherbarrow RJ & Curry S (2005) Crystal structure of foot‐and‐mouth disease virus 3C protease: new insights into catalytic mechanism and cleavage specificity. J Biol Chem 280, 11520–11527. [DOI] [PubMed] [Google Scholar]
- 74. Tan J, George S, Kusov Y, Perbandt M, Anemuller S, Mesters JR, Norder H, Coutard B, Lacroix C, Leyssen P et al (2013) 3C protease of enterovirus 68: structure‐based design of Michael acceptor inhibitors and their broad‐spectrum antiviral effects against picornaviruses. J Virol 87, 4339–4351. [DOI] [PMC free article] [PubMed] [Google Scholar]
- 75. Yeturu K & Chandra N (2008) PocketMatch: a new algorithm to compare binding sites in protein structures. BMC Bioinformatics 9, 543. [DOI] [PMC free article] [PubMed] [Google Scholar]
- 76. Wang J, Fan T, Yao X, Wu Z, Guo L, Lei X, Wang J, Wang M, Jin Q & Cui S (2011) Crystal structures of enterovirus 71 3C protease complexed with rupintrivir reveal the roles of catalytically important residues. J Virol 85, 10021–10030. [DOI] [PMC free article] [PubMed] [Google Scholar]
- 77. Daina A, Michielin O & Zoete V (2017) SwissADME: a free web tool to evaluate pharmacokinetics, drug‐likeness and medicinal chemistry friendliness of small molecules. Sci Rep 7, 42717. [DOI] [PMC free article] [PubMed] [Google Scholar]
- 78. Daina A & Zoete V (2016) A BOILED‐egg to predict gastrointestinal absorption and brain penetration of small molecules. ChemMedChem 11, 1117–1121. [DOI] [PMC free article] [PubMed] [Google Scholar]
- 79. Lipinski CA, Lombardo F, Dominy BW & Feeney PJ (2001) Experimental and computational approaches to estimate solubility and permeability in drug discovery and development settings1PII of original article: S0169–409X(96), 00423–1. The article was originally published in Advanced Drug Delivery Reviews 23 (1997) 3. Adv Drug Deliv Rev 46, 3–26. [DOI] [PubMed] [Google Scholar]
- 80. Ghose AK, Viswanadhan VN & Wendoloski JJ (1999) A knowledge‐based approach in designing combinatorial or medicinal chemistry libraries for drug discovery. 1. A qualitative and quantitative characterization of known drug databases. J Comb Chem 1, 55–68. [DOI] [PubMed] [Google Scholar]
- 81. Veber DF, Johnson SR, Cheng H‐Y, Smith BR, Ward KW & Kopple KD (2002) Molecular properties that influence the oral bioavailability of drug candidates. J Med Chem 45, 2615–2623. [DOI] [PubMed] [Google Scholar]
- 82. Muegge I, Heald SL & Brittelli D (2001) Simple selection criteria for drug‐like chemical matter. J Med Chem 44, 1841–1846. [DOI] [PubMed] [Google Scholar]
Associated Data
This section collects any data citations, data availability statements, or supplementary materials included in this article.
Supplementary Materials
Fig. S1. Convergence plots of RMSD of ligands and backbones of HAV 3C proteases bound with compounds 1–9.
Fig. S2. Correlation plots of eight compounds (excluding compound 5) in complex with HAV 3C protease (A) MMGBSA versus Ki values, (B) MMPBSA versus Ki values, (C) MMBAPPL scores versus Ki values, (D) MMBAPPL scores versus MMPBSA, (E) MMBAPPL scores versus MMGBSA, (F) ParDOCK versus MMGBSA, (G) AutoDock versus ParDOCK, (H) SwissDock versus ParDOCK, (I) SwissDock versus AutoDock, (J) SwissDock versus Ki values, (K) AutoDock versus Ki values, and (L) ParDOCK versus Ki values.
Fig. S3. The binding pose of compound 9 during the fluctuations in RMSD (at 20 ns) is shown in magenta color and the (biggest cluster) most favorable binding pose of compound 9 (at 95 ns) is shown in blue color.
Fig. S4. Synthesis data and 1H and 13C spectra of compounds 8 and 9.
Fig. S5. Size‐exclusion chromatograms of purified HAV 3C protease and its double mutant.
Fig. S6. ROC curves for four cases (ACHE, ALR2, AMPC, and HIVPR) target enzymes.
Table S1. The MMGBSA, MMPBSA, and MMBAPPL estimated binding free energies along with their standard error of means for five separate molecular dynamics simulations of 30 ns for each best inhibitor (compounds 6, 8, and 9) with HAV 3C protease.
Table S2. Active site residues and similarity scores for 3C proteases of 14 species of the Picornaviridae family.
Table S3. Predicted binding free energies of compounds 1–9 with 3C proteases from different picornaviruses, obtained after docking and scoring.
Table S4. Computationally predicted ADME properties of the identified compounds 1–9.
Table S5. Some case studies (target enzymes) checked against DUD decoys dataset.