Abstract
Aminopeptidase N (APN) plays an important role in tumor progression, which participates in the progress such as proliferation, attachment, angiogenesis, and tumor invasion. All of this makes APN as a good chemical therapeutic anti‐tumor target. In this study, a series of chemically synthesized APN inhibitors were tested for the anti‐tumor activities, and three most effective compounds were chosen according to the MTT assay. Then, the enzyme inhibitory, anti‐tumor, specificity, angiogenesis, and invasion were determined to evaluate the activity of these three compounds. All compounds can markedly inhibit the enzyme activity of APN, angiogenesis of endothelial cells, and the invasion of ES‐2 cells. And it had little effect on the viability of K562 which express low level of APN. This data indicated that the tested compounds were APN hit compounds. We also did kinetic assay to determine the inhibition constant and constructed a three‐dimensional quantitative structure–activity relationship model to analyze the structure–activity relationship to direct the further design of novel APN inhibitors as anti‐tumor agents. These data demonstrate that the tested compounds can be developed as novel candidates of anticancer agent.
Keywords: 3D‐QSAR, angiogenesis, APN/CD13 hit compound, invasion
Introduction
Aminopeptidase N (APN/CD13) (EC 3.4.11.2; CD13), also known as CD13, is a type 2 transmembrane zinc‐dependent metallopeptidase of the superfamily of gluzincins with a molecular weight of approximately 150 kDa [1, 2], which forms a noncovalently bound homodimer on the cellular membrane. It has a conserved pentapeptide consensus sequence HEXXH representing a zinc‐binding motif in its extracellular metalloprotease domain and therefore belongs to the M1 family of aminopeptidase. The enzyme hydrolyzes oligopeptides and preferentially releases neutral amino acids from the N‐terminal end of small peptides [3, 4]. APN/CD13 was first described as a marker for hematopoietic cells in myeloid origin, and it expresses in many cells and tissues, including myeloids, fibroblasts, brain cells, hepatocytes, osteoclasts, endometrial cells, epithelial cells of the liver, kidney, intestine, and in synaptic membranes of central nervous system [5, 6]. Because of its broad expression, the function of APN strongly depends on its location. In the intestinal brush border, APN is involved in the terminal degradation of small peptides and amino‐acid scavenging. In synaptic membranes, APN inactivates endorphins and enkephalins. In addition, APN participates in the inflammatory reaction and the processing of peptides, and APN could also act as the receptor for the transmissible gastroenteritis virus and the human coronavirus.
Bestatin, [(2S,3R)‐3‐amino‐2‐hydroxy‐4‐phenylbutanoyl] leucine, obtained from culture filtrates of Streptomyces olivoreticuli [7], is a low‐molecular‐mass dipeptide (MW: 308.38). And bestatin is also a potent competitive inhibitor (K i = 1.4–4.1 × 10⁻⁶ M) of APN with antitumor activities and immunomodulating activities. APN inhibitor includes natural inhibitors, such as bestatin, lapstatin, phebestin, curcumin, pasmmaplin A, and betulinic acid (Figure S1) [8, 9, 10], and synthetic small molecule inhibitors such as peptidomimetics and nonpeptides. Generally speaking, because of low bioavailability, rapid elimination, proteolytic lability, and short duration of action etc, the application of peptides in clinic is limited. Therefore, peptidomimetics or peptide mimics are becoming more and more popular to researchers.
Aminopeptidase N plays a crucial role in tumor progression and metastasis [11]. In non‐small cell lung cancer, human pancreatic carcinoma and prostate cancer, the expression of APN/CD13 for patients is associated with a poor prognosis, and APN expression is supposed to be involved in the cancer invasion and metastasis [12, 13, 14, 15]. Therefore, some researchers proposed that APN may be a new prognostic marker for cancer. In the progress of solid tumor, the formation of new blood vessels is of more importance. The new vasculature supplies nutrients and oxygen for tumors [16]. APN also participates in tumor angiogenesis through regulating filopodia formation and endothelial invasion [17]. Meanwhile, APN is present on tumor endothelial cells, but not on existing blood vessels in normal tissues [18]. Through proteolytic degradation of the extracellular matrix, APN and other proteases such as matrix metalloproteinases contribute to the growth and metastasis of tumors.
In this study, we investigated the bioactivities of cyclic‐imide APN inhibitors which we firstly synthesized [19] and constructed a three‐dimensional quantitative structure–activity relationship (3D‐QSAR) model to direct the design and synthesis of novel compounds. Our laboratory has a long research course of design and synthesis of peptidomimetics compounds as APN inhibitors [20, 21, 22]. Cyclic‐imide peptidomimetics were a series of newly synthesized ones in which the design concept combined with peptide mimetics and conformation restriction. Furthermore, the cyclic‐imide peptidomimetics shared same common feather pharmacophore with bestatin (Figure S2). APN is also closely related to the angiogenesis and the invasion of tumor cells. And the tested compounds really inhibited the tube formation and the invasion of ES‐2 cells.
Materials and methods
Cell culture
Human promyelocytic leukemia cells HL‐60, human immortalized myelogenous leukemia cells K562, human alveolar epithelial cell line A549, human ovarian clear cell adenocarcinoma cell line ES‐2, and human hepatocarcinoma cell line H7402, HepG2, and PLC/PRF/5 were maintained in RPMI‐1640 supplemented with 10% fetal calf serum (FCS). Human glioblastoma cell line U87 and A172 were grown in Dulbecco modified Eagle medium supplemented with 10% FCS. Human umbilical vein endothelial cells (HUVECs) were maintained in the endothelial cell medium supplemented with 5% fetal bovine serum, ECGS (1×), penicillin, and streptomycin (1×) (ScienCell Research Laboratories, Cat No. 1001). These cells were incubated at 37 °C in a humidified atmosphere containing 5% CO2.
Determination of membrane APN/CD13 by FACS
Cells were incubated with phycoerythrin‐conjugated monoclonal antibody specific for APN/CD13 (BD Pharmingen, San Diego, CA, USA, CD13mAb clone: WM15) for 30 min at 4 °C. After washings twice, the cells were resuspended in PBS and analyzed on FACScan (FACSCalibur; Becton‐Dickinson, San Jose, CA, USA).
Enzyme activity assay
Determination of the enzyme activity of APN was determined using methods described previously [23]. In brief, cells were resuspended in PBS in a 96‐well microtiter plate. Then, different concentrations of compound were added separately. After incubation with 1.6 mm of l‐leucine‐p‐nitroanilide (L9125; Sigma, St Louis, MO, USA) for 30 min at 37 °C, the enzyme activity was estimated by measuring the absorbance at 405 nm using a microplate reader (Model 680; BIO‐RAD, Hercules, CA, USA).
In vitro endothelial morphogenesis assay
Ninety‐six‐well plates were coated with 50 μL of basement membrane matrix (Matrigel, Cat.356234; BD Biosciences, Bedford, MA, USA) per well and incubated at 37 °C for 1 h. 2 × 10⁴ HUVECs pretreated with 320 μm of 13d, 13f, 22f, or bestatin for 2 days were plated on Matrigel and supplemented with 320 μm of the inhibitors. After 18 h, photographs were taken using a microscope (IX51; Olympus, Tokyo, Japan).
In vitro invasion assay
In vitro invasion assay was performed using invasion assays as described previously [17]. Matrigel was diluted 1 : 19 with serum‐free RPMI‐1640, and 50 μL was used to coat each invasion chamber (Transwell; Corning 8‐μm pore size; Corning Costar, NY, USA). 1 × 10⁵ ES‐2 cells, treated with 320 μm different compounds for 2 days, were added to the upper chamber supplemented with 320 μm of the inhibitors, while the lower compartment filled with 10% FCS in RPMI‐1640. After incubation for 24 h, the Matrigel on the upper side of the filter was removed. The cells on the bottom were fixed with methanol and stained with 1 mg/mL crystal violet dye. The picture of invaded cells was obtained under a microscope (IX81; Olympus). Results are presented as the mean number of invaded cells of five different fields.
MTT assays
1 × 10⁴ per well of HL‐60, K562 cells or 5000 per well of ES‐2, A549 cells were seeded in 96‐well plates and allowed to grow for 4 h, and the compounds were added at various concentration. Two days after treatment, cells in each well were treated with 1% of 0.5 mg/mL MTT reagent and incubated for an additional 4 h. After that, the culture was removed and 100 μL dimethylsulfoxide was added. Absorbance at 570 nm was measured using an enzyme‐linked immunosorbent assay reader (Model 680; BIO‐RAD), and absorbance at 630 nm was used as a reference. The inhibition rate of compounds was calculated by (ODcontrol‐ODtested)/ODcontrol × 100%, where OD is the mean value of three replicate wells. The IC50 values were determined using Origin 7.5 software (OriginLab Corporation, Northampton, MA, USA).
Kinetics of aminopeptidase inhibition
The Michaelis constant, K m, of microsomal aminopeptidase from porcine kidney microsomes (L6007; Sigma) and the inhibition constant of APN inhibitors were determined using the methods described previously [24, 25, 26], and the substrate was L9125. To determine the K m, 0.084 μg aminopeptidase was incubated with different concentrations of substrate in assay buffer: 12.8930 g Na2HPO4 12H2O and 2.18414 g NaH2PO4 2H2O in 1000 mL ddH2O, pH 7.2 at 37 °C, the final volume was 100 μL. And the reaction velocities were measured by monitoring the absorbance change at 405 nm over reaction time using the plate reader (VARIOSKAN; Thermo Electron Corporation, Waltham, MA, USA). The Lineweaver–Burk equation,
where v is the velocity of reaction, Vm is the maximum velocity of reaction, and [S] is the concentration of substrate, was used to analyze the K
m of aminopeptidase, and the x‐intercept is ‐ .
.
The determination of inhibition constant, K i, was used Dixon method. Aminopeptidase and different concentrations of inhibitors were incubated with two different concentrations of substrate respectively at 37 °C, the reaction velocities were measured by monitoring the absorbance change at 405 nm over reaction time. The equation is
where [I] is the concentration of inhibitor. Under two different concentrations of [S], the [I] = −K
i at the point of intersection of  versus [I].
QSAR
Molecular construction, geometry optimization, molecular alignment, and 3D‐QSAR CoMFA (comparative molecular field analysis) [27] model generation were carried out using the Tripos Sybyl 7.0 package [28] on a Dell Precision 390 workstation.
The compounds in the training set and test set for the QSAR analyses were 28 cyclic‐imide peptidmimetics derivatives whose IC50 values for HL‐60 span approximate three orders of magnitudes. Twenty‐one compounds were randomly selected as the training set, and the remaining seven compounds were used as the test set. The number of samples in the test set was approximately 33% of the training set. The biological data obtained as IC50 (M) were converted to pIC50 (−logIC50) values and used as dependent variables in the 3D‐QSAR analyses (Table S1).
All 28 molecules were constructed with Sybyl/Sketch module and geometry optimized using Powell’s method [29] with the Tripos force field with convergence criterion set at 0.05 kcal/(Å × mol) and assigned with Gasteiger–HÜckel method [30]. The Field‐Fit [31] method was implied in the molecular alignment procedure as the molecules did not share the same scaffold. In brief, the molecular force field of the molecule 13f was computed using Sybyl/QSAR module first and then the steric and electrostatic fields were extracted individually. The extracted steric and electrostatic fields of 13f were taken as the template force fields, and other molecules were aligned to the template based on the smallest variance of their force field. The alignment set of all molecules is shown in Figure S3.
Comparative molecular field analysis steric and electrostatic fields were generated using Lennard–Jones and Columbic potential, respectively. A sp3‐hybridized carbon probe atom with a charge of +1.0 was used to calculate the steric field and electrostatic fields of CoMFA. A grid spacing of 2 Å was used for the models. The partial least‐squares (PLS) regression was separately performed on the data sets. Leave‐one‐out cross‐validation process, with SAMPLS method, was firstly used to seek the optimum number of components (ONC), and then the CoMFA models were computed with non‐cross‐validation PLS at the obtained ONC.
Statistical analysis
For data of in vitro invasion assay, the significance of difference between groups was performed by the student’s t‐test.
Results
Expression of APN/CD13 in tumor cell lines
Bestatin, as an APN inhibitor, can modulate the immune response and inhibit the growth of tumor cell. Therefore, APN inhibitor as a chemical agent can inhibit the progress of solid tumor. This will increase the cure spectrum of APN inhibitor. As measured by FACS analysis, Figure 1 shows the expression of aminopeptidase N in various tumor cell lines. HL‐60, ES‐2, A549, and PLC/PRF/5 cells intensely express APN/CD13, while lower expression was observed in 4 of 9 tumor cell lines including HepG2, H7402, A172, and U87. What made us interesting was that HL‐60 and K562 all belong to leukemia cell line. However, one expresses high level of APN and the other expresses very low level of APN. Then, we determined whether APN inhibitor can influence the viability of tumor cells.
Figure 1.
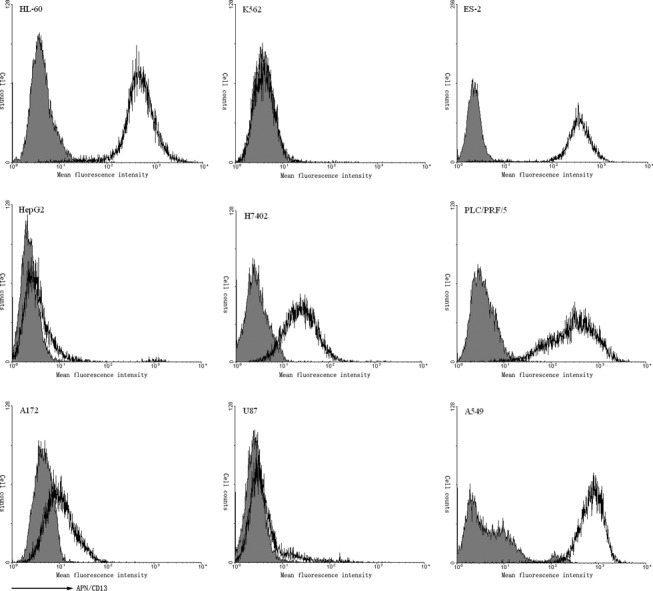
Expression of Aminopeptidase N (APN) in various tumor cell lines, as analyzed by FACS. Cells were incubated with phycoerythrin‐conjugated monoclonal antibody specific for APN/CD13 and analysed on FACScan.
Determination of the antitumor activity of APN inhibitor
We synthesized a series of small molecular APN inhibitor, and the structure of these compounds is in submission. And MTT assay was used to screen APN inhibitor with higher activity. Toward this end, we treated HL‐60 cell, which is sensitive to APN inhibitor and express high level of aminopeptidase N, with different concentrations of individual compounds and then measured the absorbance. Compared to others, three compounds (13d, 13f, 22f) greatly inhibited the cell viability and were therefore chosen for further investigation ( Table I ). The APN enzyme activity assay indicated that three compounds and bestatin dose‐dependently inhibited the enzyme activity of APN ( Figure 2a ). We also determined whether these three compounds could inhibit the growth of solid tumor cell lines. The results showed that they all more or less inhibited the cell viability of ES‐2 and A549 cell lines ( Table I ).
Table I.
The structure and activity of Aminopeptidase N inhibitors
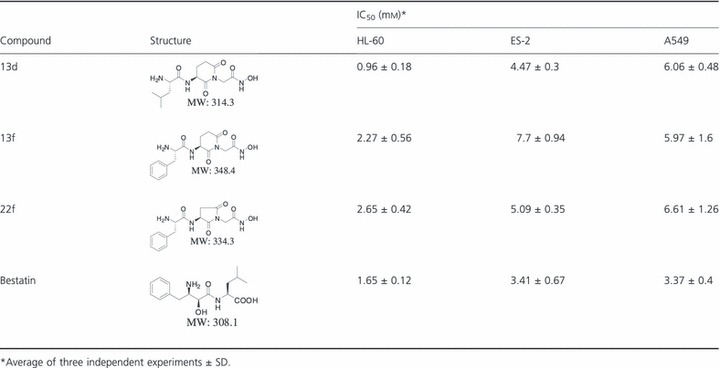
Figure 2.
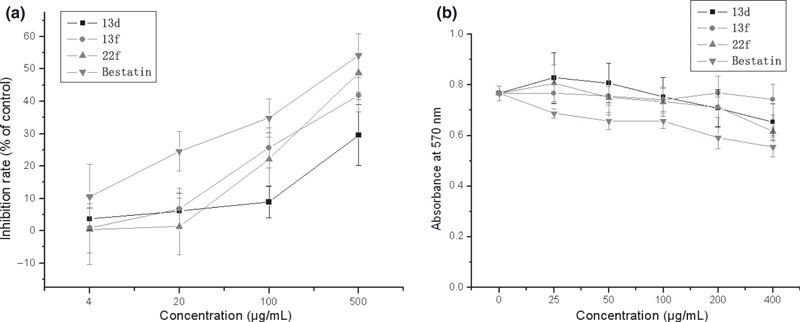
Different effects of Aminopeptidase N (APN) inhibitors on the enzyme activity of APN of HL‐60 cells and the viability of K562 cell line. (a) The enzyme activity was estimated by measuring the absorbance at 405 nm, as the substrate was L‐leucine‐p‐nitroanilide. (b) The effect of APN inhibitors on the viability of K562 cell lines were measured by MTT assay.
The specificity of APN inhibitor
The cytotoxicity activity of the compounds is the question which we focused on. APN inhibitor should merely inhibit the growth of cell with APN expression. Therefore, K 562 cell line that expresses very low level of APN, as shown in Figure 1 , was used to determine the cytotoxicity activity of these compounds. Our data indicated that all three compounds other than bestatin did not inhibit the viability of K562 cells ( Figure 2b ). We proposed that bestatin has a little cytotoxicity activity or multitarget. This also verified the specificity of the tested compounds to APN. The trypan blue dye‐exclusion test was also used to estimate the compound‐mediated cytotoxicity. There was no obvious cytotoxicity effect of compounds on HL‐60 cells (data not shown).
Determination of inhibition constants for APN inhibitors
To gain more insight into the inhibition of aminopeptidase N by APN inhibitors, kinetic studies of inhibition were carried out. The Lineweaver–Burk plots were constructed to determine the K m as shown in Figure 3a , which was 0.286 mm. To determine the K i values for APN inhibitors, Dixon method was employed ( Figure 3b ). The K i value for bestatin was 1.56 μm. This data correlated with the APN enzyme activity assay ( Figure 2a ), which showed that bestatin was the most potent inhibitor for APN. 13d showed the lowest affinity for the aminopeptidase, with a K i value of 74.87 μm, which also correlated with the APN enzyme activity assay. However, 13d was the most active compound to inhibit the viability of HL‐60 cells. We proposed that 13d also targets to other protein and has some cytotoxicity activity. The K i value for 13f and 22f was 6.26 and 7.46 μm.
Figure 3.
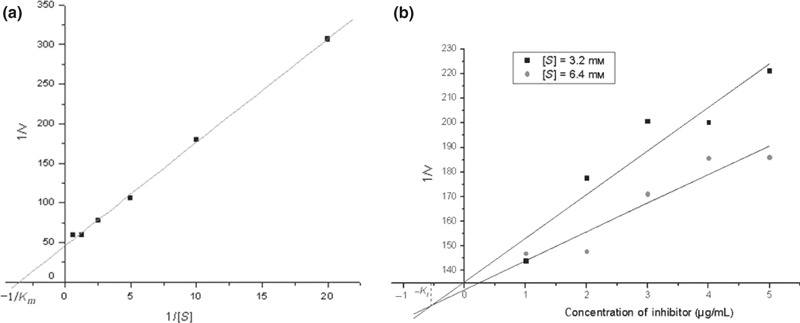
Determination of kinetic constants. (a) The Michaelis constant, K m, of microsomal aminopeptidase from porcine kidney microsomes was determined according to the Lineweaver‐Burk equation. (b) The inhibition constant K i of Bestatin was determined using Dixon method. The figure of other compounds was not shown.
APN inhibitor affected the capillary morphogenesis in vitro
During the capillary morphogenesis of endothelial cells, APN is activated by angiogenesis signals and functional APN/CD13 is required during this progress [32, 33]. And HUVECs as the cell model were used to determine the influence of APN inhibitor to endothelial morphogenesis [32, 34]. Then, we verified whether or not the tested compounds could suppress the formation of tube‐like structure. HUVECs treated with 320 μm of different compound were cultured on a basement membrane matrix (Matrigel) in 96‐well plate. After 18 h in CO2 incubator, photograph of capillary morphogenesis was acquired. All compounds except 13d notably suppressed the capillary morphogenesis ( Figure 4 ).
Figure 4.
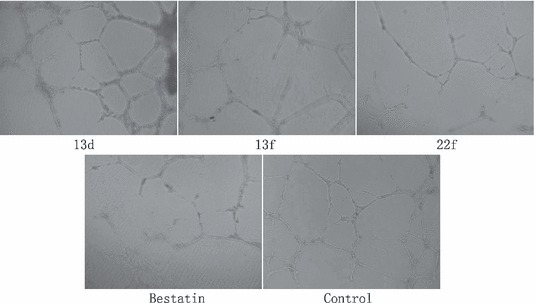
Aminopeptidase N inhibitors affect the angiogenesis of endothelial cells. HUVEC cells were plated on Matrigel in 96‐well plates, and then treated with 320 μm of inhibitors for 20 h. Photographs were taken using an invert microscope (100×).
APN inhibitor inhibited the invasion of tumor cells
Aminopeptidase N also participates in the invasion of tumor cells [35, 36]. Therefore, the activity of inhibiting tumor cell invasion of the compounds was estimated. Firstly, we confirmed whether the APN activity of ES‐2 was reduced by our compounds. The data indicated that all three compounds and bestatin could greatly inhibit the activity of APN expressed on the surface of ES‐2 cells ( Figure 5a ). Then, the invasion assay using Matrigel and transwell plate was performed. The data indicated that all compounds could inhibit the invasion of ES‐2 cells ( Figure 5b,c ). However, bestatin was the most active compound.
Figure 5.
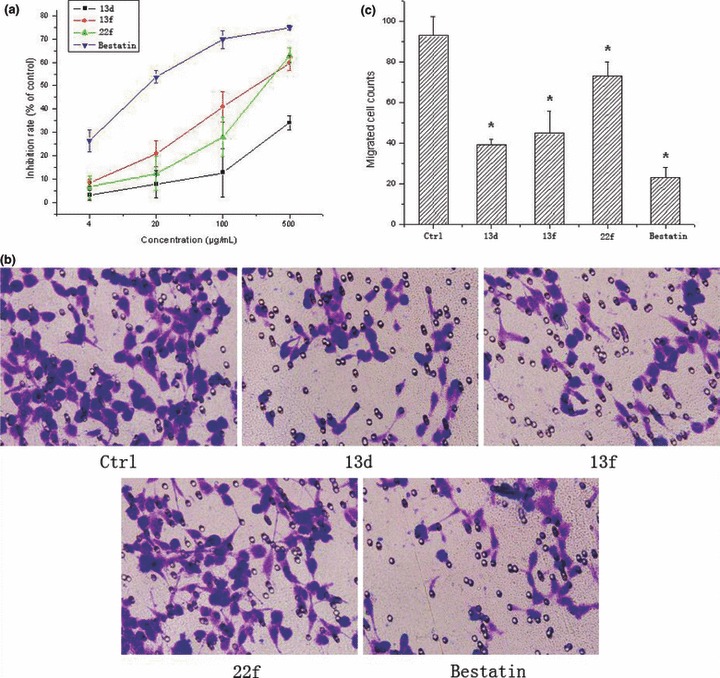
Aminopeptidase N (APN) inhibitors suppressed the invasion of ES‐2 cells. Firstly, APN inhibitors could markedly inhibited the enzyme activity of APN of ES‐2 cells (a). Then ES‐2 cells treated with different compounds were plated into Metrigel‐coated transwell chambers and photographed after 24 h (100×) (b). (c) Data shown represent the mean number of invaded cells from five different fields. *P < 0.01.
QSAR analysis
The statistics result of CoMFA PLS analyses was presented in Table II , from which we can see the CoMFA model got a cross‐validate R 2 (q2) of 0.525, which indicates the QSAR model is a robust one, and the R 2 of 0.748 of the test set further verified the result. In the discussion section, some more strictly criterions were used to validate the CoMFA model. The observed and CoMFA predicted pIC50 values of the compounds were in the supporting information, and a scatterplot was established based on them ( Figure 7 ). From the scatterplot, it can be concluded that the predicted pIC50 was closely to the observed ones. The contour maps of CoMFA (electrostatic and steric) model were represented in Figure 6 . For the CoMFA steric contour map, green contour plots (G1 and G2 in Figure 6 ) indicate regions where bulky groups are related with increased bioactivity, while yellow contour plots (Y1 in Figure 6 ) indicate regions where such bulky groups are not favoring bioactivity. For the CoMFA electrostatic contour map, the red‐colored contours (R1 in Figure 6 ) indicate regions in which the presence of the negative charge increases activity, while blue‐colored contours (B1 and B2 in Figure 6 ) show regions where the positive charged group is favored.
Table II.
Statistics of comparative molecular field analysis partial least‐squares analyses
| Statistical parameters | Values |
|---|---|
| q2 | 0.525 |
| Optimum number of components | 6 |
| SEE | 0.089 |
| F value | 89.70 |
| R 2 | 0.748 |
R

|
0.744 |
| K | 1.014 |

|
0.005 |
| Fraction of field contributions | – |
| Steric | 0.699 |
| Electrostatic | 0.301 |
Figure 7.
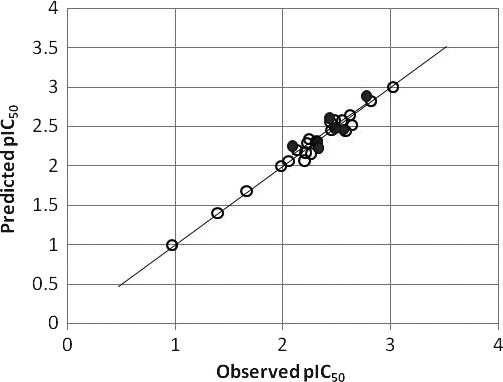
Scatterplots of the comparative molecular field analysis (CoMFA) predicted and observed values of HL‐60 inhibitory activities for molecules in CoMFA model. ○: training set; •: test set.
Figure 6.
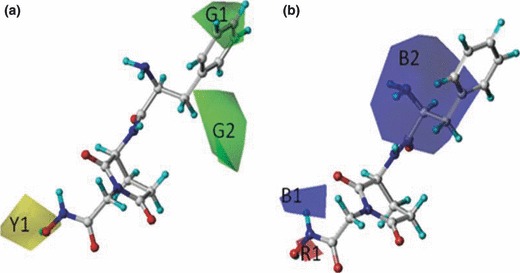
Contour maps of comparative molecular field analysis (CoMFA) model, with the potent compound 13f taken as reference molecule. All map regions are represented in transparent view mode. (a) Steric contour maps of CoMFA model, in which green (G1 and G2) indicates regions where bulky groups increase activity and yellow (Y1) indicates regions where bulky groups decrease activity. (b) Electrostatic contour maps of CoMFA model, in which blue (B1 and B2) indicates regions where more positively charged groups increase activity and red (R1) indicates regions where more negatively charged groups increase activity.
Discussion
This study was undertaken to get new APN inhibitor. We screened the activity of a series of cyclic‐imide compounds, and three compounds were more potent to do further research. According to the function of APN, the activity of these three compounds was estimated. They all could inhibit the activity of APN and affect the tube formation and the invasion of tumor cells. Then, we determined the inhibition constant and constructed a 3D‐QSAR model to research the structure–activity relationship.
Most of the anticancer medicines belong to cell toxicity compound, which inhibit the growth of all cells. These medicines not only exert anticancer effect, but also affect the proliferation of normal cells. Therefore, it cannot avoid side effects. The target of our compound is aminopeptidase N which is involved in the development of some cancers, such as ovarian carcinoma, gastric cancer [23, 37] and is highly expressed on some tumor cells, while some tumor cells still express low level of aminopeptidase N. APN inhibitor cannot inhibit the progress and metastasis of all tumor cells, but it is effective to APN expressing tumor and brings little side effects. Although aminopeptidase N still expresses in the other tissues, compared to the metastasis of cancer, the little side effect is acceptable. Besides its direct role in anticancer, APN inhibitor also enhances radiation‐induced apoptosis in cervical cancer [38]. Meanwhile, APN also participates in some other diseases, such as lung fibrosis, inflammatory bowel diseases, and glomerulopathies [39, 40, 41]. All of this makes APN as a good therapeutic target.
Our therapeutic target protein is APN, and the compound should only inhibit the growth of APN‐expressing cells. The MTT assay indicated that the compound could affect the viability of tumor cells. It could not confirm the relationship between the compound and APN. Then, the enzyme activity assay was performed. One interesting phenomenon was the compound 13d could effectively inhibit the viability of tumor cells, but it could not equally affect the enzyme activity of APN. Psammaplin A, a marine natural product, inhibits aminopeptidase N and may have other cellular targets [10]. Therefore, we hypothesized 13d may also have other targets affecting the viability of tumor cells. These need further research. However, 13f and 22f could greatly inhibit the viability of HL‐60 cells which express high level of APN ( Table I and Figure 1 ). And it did not markedly affect the viability of K562 cell line which expresses very low level of APN (1, 2). These data indicated that the tested compounds were APN hit compounds.
Aminopeptidase N plays an important role in angiogenesis and tumor invasion [23, 34], which is important for the metastasis of cancer. Although the mechanism is unclear, APN is a crucial mediator of galectin‐3‐induced angiogenesis in endothelial cells [42]. Then, the tube formation and invasion assay were performed. All the tested compounds could markedly inhibit the angiogenesis and the invasion of tumor cells. As we all know, the capillary vessel formation in the tumor tissue provides the tumor cells an opportunity to get into the vasculature system. Before they get into the circulation system, the degradation of extra cellular matrix is required. From these two aspects, the tested compounds can affect the metastasis of primary tumor. Considering its inhibition on the viability of tumor cells, the tested compounds might have notably therapeutic effect to highly metastatic cancer.
Contour maps were produced to envision the information content of the derived 3D‐QSAR CoMFA model. For the CoMFA steric contour map, green contour plots (G1 and G2 in Figure 6 ) indicate regions where bulky groups are related with increased bioactivity, while yellow contour plots (Y1 in Figure 6 ) indicate regions where such bulky groups are not favoring bioactivity. For example, the compound 7R has a trimethoxybenzamido group located in the G1 region and 13d has an isobutyl group in G2. Compounds 4b and 6c possess an ethyl ester group in the Y1 region, which might be the cause of their low potency. For the CoMFA electrostatic contour map, the red‐colored contours (R1 in Figure 6 ) indicate regions in which the presence of the negative charge increases activity, while blue‐colored contours (B1 and B2 in Figure 6 ) show regions where the positive charged group is favored. For example, the compounds 22f and 11f have amino groups in B1 and B2 regions. Compounds 22i and 22d got good potency might caused by their hydroxyl group in the R1 region. Based on the observations of the CoMFA contour maps, some useful information could be concluded which were conductive to the next generation of compound synthesis. Take 13f for example, the further optimization should be link electropositive substituent group to the benzene ring, for the CoMFA steric contour map implies large binding pocket around this region, and the CoMFA electrostatic contour suggesting this region may be electrical positively favored. In the other end of 13f, the CoMFA steric contour map indicating the hydroximic acid should be replaced by smaller zinc‐binding groups, such as thiol group.
To evaluate the predictive ability of the CoMFA model, a training set of 21 molecules and a test set of seven molecules were used. Table S1 shows the actual pIC50 of the compounds and the activity data predicted by the 3D‐QSAR models. It should be noted that the predicted activities of the compounds are close to the actual values ( Figure 7 ). Early study indicated that a high value of q2 alone is an insufficient criterion for a QSAR model to be highly predictive. Tropsha and coworkers have introduced a new set of validation criteria for QSAR or QSPR models, and those criteria were accepted and have been applied by other researchers [43, 44, 45]. Tropsha holds that a predictive QSAR model should satisfy the following conditions:
q2 > 0.5
R 2 > 0.6
 and 0.85 ≤ K ≤ 1.15
Here R
2 is the correlation coefficient between the predicted and observed activities of the test set, R
 is a quantity characterizing linear regression of the test set with the Y‐intercept set to zero, which is different from conventional R for the best fit linear regression, and K is the slopes of the regression lines through the origin. The QSAR model established in this study matches the Tropsha’s criterion very well. The statistical data were shown in
Table II
.
Conclusion
In conclusion, the activity of a series of cyclic‐imide APN inhibitors has been tested using cell model. Three more potent agents were chosen to do pharmacology assay. They all could inhibit the enzyme activity of APN, endothelial angiogenesis, and invasion of tumor cells. Although the tested compounds were less active than positive medicine bestatin, we constructed a 3D‐QSAR model to direct the next design and synthesis work. In the near future, we may get a new powerful APN inhibitor.
Supporting information
Figure S1. The chemical structures of natural APN inhibitors.
Figure S2. Pharmacophore alignment of Bestatin (Represent in green color) and 13f (Colored by atom type). Cyan: hydrophobic center; Red: positive nitrogen; Magenta: H‐bond donor; Green: H‐bond acceptor.
Figure S3. Structural alignments of the compounds in the training set and test set for constructing 3D‐QSAR CoMFA models.
Table S1. Observed activity versus predicted activity of the compounds in 3D‐QSAR CoMFA model.
Supporting info item
Supporting info item
Supporting info item
Supporting info item
Acknowledgements
This work was greatly supported by the Institute of Immunopharmacology and Immunotherapy in Shandong University. And this work was supported by National Nature Science Foundation Research Program of China (No. 90713041) and National High Technology Research and Development Program of China (863 project; Grant No. 2007AA02Z314).
References
- 1. Look A.T., Ashmun R.A., Shapiro L.H., Peiper S.C. Human myeloid plasma membrane glycoprotein CD13 (gp150) is identical to aminopeptidase N. J. Clin. Invest. (1989) 83 1299–1307. [DOI] [PMC free article] [PubMed] [Google Scholar]
- 2. Hooper N.M. Families of zinc metalloproteases. FEBS Lett. (1994) 354 1–6. [DOI] [PubMed] [Google Scholar]
- 3. Sjostrom H., Noren O., Olsen J. Structure and function of aminopeptidase N. Adv. Exp. Med. Biol. (2000) 477 25–34. [DOI] [PubMed] [Google Scholar]
- 4. Riemann D., Kehlen A., Langner J. CD13–not just a marker in leukemia typing. Immunol. Today (1999) 20 83–88. [DOI] [PMC free article] [PubMed] [Google Scholar]
- 5. Shipp M.A., Look A.T. Hematopoietic differentiation antigens that are membrane‐associated enzymes: cutting is the key!. Blood (1993) 82 1052–1070. [PubMed] [Google Scholar]
- 6. Lendeckel U., Kahne T., Riemann D., Neubert K., Arndt M., Reinhold D. Review: the role of membrane peptidases in immune functions. Adv. Exp. Med. Biol. (2000) 477 1–24. [DOI] [PubMed] [Google Scholar]
- 7. Umezawa H., Aoyagi T., Suda H., Hamada M., Takeuchi T. Bestatin, an inhibitor of aminopeptidase B, produced by actinomycetes. J. Antibiot. (1976) 29 97–99. [DOI] [PubMed] [Google Scholar]
- 8. Shim J.S., Kim J.H., Cho H.Y. et al. Irreversible inhibition of CD13/aminopeptidase N by the antiangiogenic agent curcumin. Chem. Biol. (2003) 10 695–704. [DOI] [PubMed] [Google Scholar]
- 9. Egan M.E., Pearson M., Weiner S.A. et al. Curcumin, a major constituent of turmeric, corrects cystic fibrosis defects. Science (2004) 304 600–602. [DOI] [PubMed] [Google Scholar]
- 10. Shim J.S., Lee H.S., Shin J., Kwon H.J. Psammaplin A, a marine natural product, inhibits aminopeptidase N and suppresses angiogenesis in vitro. Cancer Lett. (2004) 203 163–169. [DOI] [PubMed] [Google Scholar]
- 11. John A., Tuszynski G. The role of matrix metalloproteinases in tumor angiogenesis and tumor metastasis. Pathol. Oncol. Res. (2001) 7 14–23. [DOI] [PubMed] [Google Scholar]
- 12. Tokuhara T., Hattori N., Ishida H. et al. Clinical significance of aminopeptidase N in non‐small cell lung cancer. Clin. Cancer Res. (2006) 12 3971–3978. [DOI] [PubMed] [Google Scholar]
- 13. Ishii K., Usui S., Sugimura Y., Yamamoto H., Yoshikawa K., Hirano K. Inhibition of aminopeptidase N (AP‐N) and urokinase‐type plasminogen activator (uPA) by zinc suppresses the invasion activity in human urological cancer cells. Biol. Pharm. Bull. (2001) 24 226–230. [DOI] [PubMed] [Google Scholar]
- 14. Ishii K., Usui S., Sugimura Y. et al. Aminopeptidase N regulated by zinc in human prostate participates in tumor cell invasion. Int. J. Cancer (2001) 92 49–54. [PubMed] [Google Scholar]
- 15. Ikeda N., Nakajima Y., Tokuhara T. et al. Clinical significance of aminopeptidase N/CD13 expression in human pancreatic carcinoma. Clin. Cancer Res. (2003) 9 1503–1508. [PubMed] [Google Scholar]
- 16. Folkman J. Angiogenesis: an organizing principle for drug discovery? Nat. Rev. Drug Discov. (2007) 6 273–286. [DOI] [PubMed] [Google Scholar]
- 17. Petrovic N., Schacke W., Gahagan J.R. et al. CD13/APN regulates endothelial invasion and filopodia formation. Blood (2007) 110 142–150. [DOI] [PMC free article] [PubMed] [Google Scholar]
- 18. Pasqualini R., Koivunen E., Kain R. et al. Aminopeptidase N is a receptor for tumor‐homing peptides and a target for inhibiting angiogenesis. Cancer Res. (2000) 60 722–727. [PMC free article] [PubMed] [Google Scholar]
- 19. Li Q., Fang H., Wang X., Hu L., Xu W. Novel cyclic‐imide peptidomimetics as aminopeptidase N inhibitors. Design, chemistry and activity evaluation Part I. Eur. J. Med. Chem. (2009) 44 4819–4825. [DOI] [PubMed] [Google Scholar]
- 20. Li Q., Fang H., Xu W. Novel 3‐galloylamido‐N’‐substituted‐2,6‐piperidinedione‐N‐acetamide peptidomimetics as metalloproteinase inhibitors. Bioorg. Med. Chem. Lett. (2007) 17 2935–2938. [DOI] [PubMed] [Google Scholar]
- 21. Wang Q., Chen M., Zhu H. et al. Design, synthesis, and QSAR studies of novel lysine derives as amino‐peptidase N/CD13 inhibitors. Bioorg. Med. Chem. (2008) 16 5473–5481. [DOI] [PubMed] [Google Scholar]
- 22. Shang L., Fang H., Zhu H. et al. Design, synthesis and SAR studies of tripeptide analogs with the scaffold 3‐phenylpropane‐1,2‐diamine as aminopeptidase N/CD13 inhibitors. Bioorg. Med. Chem. (2009) 17 2775–2784. [DOI] [PubMed] [Google Scholar]
- 23. Terauchi M., Kajiyama H., Shibata K. et al. Inhibition of APN/CD13 leads to suppressed progressive potential in ovarian carcinoma cells. BMC Cancer (2007) 7 140. [DOI] [PMC free article] [PubMed] [Google Scholar]
- 24. Raccor B.S., Vogt A., Sikorski R.P. et al. Cell‐based and biochemical structure‐activity analyses of analogs of the microtubule stabilizer dictyostatin. Mol. Pharmacol. (2008) 73 718–726. [DOI] [PubMed] [Google Scholar]
- 25. Tian M., Huitema E., Da C.L., Torto‐Alalibo T., Kamoun S. A Kazal‐like extracellular serine protease inhibitor from Phytophthora infestans targets the tomato pathogenesis‐related protease P69B. J. Biol. Chem. (2004) 279 26370–26377. [DOI] [PubMed] [Google Scholar]
- 26. Venalainen J.I., Garcia‐Horsman J.A., Forsberg M.M. et al. Binding kinetics and duration of in vivo action of novel prolyl oligopeptidase inhibitors. Biochem. Pharmacol. (2006) 71 683–692. [DOI] [PubMed] [Google Scholar]
- 27. Cramer R.D., Bunce J.D., Patterson D.E., Frank I.E. Crossvalidation, bootstrapping, and partial least squares compared with multiple regression in conventional QSAR studies. Quant. Struct. -Act. Relat. (1988) 7 18–25. [Google Scholar]
- 28. Sybyl, version 7. 0. Tripos Inc., St. Louis, MO (2004). [Google Scholar]
- 29. Powell M.J.D. Restart procedures for the conjugate gradient method. Math. Program. (1977) 12 241–254. [Google Scholar]
- 30. Gasteiger J., Marsili M. Iterative partial equalization of orbital electronegativity‐a rapid access to atomic charges. Tetrahedron. (1980) 36 3219–3228. [Google Scholar]
- 31. Kulkarni S.S., Patel M.R., Talele T.T. CoMFA and HQSAR studies on 6,7‐dimethoxy‐4‐pyrrolidylquinazoline derivatives as phosphodiesterase10A inhibitors. Bioorg. Med. Chem. (2008) 16 3675–3686. [DOI] [PubMed] [Google Scholar]
- 32. Bhagwat S.V., Lahdenranta J., Giordano R., Arap W., Pasqualini R., Shapiro L.H. CD13/APN is activated by angiogenic signals and is essential for capillary tube formation. Blood (2001) 97 652–659. [DOI] [PMC free article] [PubMed] [Google Scholar]
- 33. Fukasawa K., Fujii H., Saitoh Y. et al. Aminopeptidase N (APN/CD13) is selectively expressed in vascular endothelial cells and plays multiple roles in angiogenesis. Cancer Lett. (2006) 243 135–143. [DOI] [PubMed] [Google Scholar]
- 34. Bhagwat S.V., Petrovic N., Okamoto Y., Shapiro L.H. The angiogenic regulator CD13/APN is a transcriptional target of Ras signaling pathways in endothelial morphogenesis. Blood (2003) 101 1818–1826. [DOI] [PubMed] [Google Scholar]
- 35. Kido A., Krueger S., Haeckel C., Roessner A. Inhibitory effect of antisense aminopeptidase N (APN/CD13) cDNA transfection on the invasive potential of osteosarcoma cells. Clin. Exp. Metastasis (2003) 20 585–592. [DOI] [PMC free article] [PubMed] [Google Scholar]
- 36. Kido A., Krueger S., Haeckel C., Roessner A. Possible contribution of aminopeptidase N (APN/CD13) to invasive potential enhanced by interleukin‐6 and soluble interleukin‐6 receptor in human osteosarcoma cell lines. Clin. Exp. Metastasis (1999) 17 857–863. [DOI] [PubMed] [Google Scholar]
- 37. Kawamura J., Shimada Y., Kitaichi H. et al. Clinicopathological significance of aminopeptidase N/CD13 expression in human gastric carcinoma. Hepatogastroenterology (2007) 54 36–40. [PubMed] [Google Scholar]
- 38. Tsukamoto H., Shibata K., Kajiyama H., Terauchi M., Nawa A., Kikkawa F. Aminopeptidase N (APN)/CD13 inhibitor. Ubenimex, enhances radiation sensitivity in human cervical cancer. BMC Cancer (2008) 8 74–81. [DOI] [PMC free article] [PubMed] [Google Scholar]
- 39. Kuhlmann U.C., Chwieralski C.E., van den B.S. et al. Modulation of cytokine production and silica‐induced lung fibrosis by inhibitors of aminopeptidase N and of dipeptidyl peptidase‐IV‐related proteases. Life Sci. (2009) 84 1–11. [DOI] [PubMed] [Google Scholar]
- 40. Bank U., Bohr U.R., Reinhold D. et al. Inflammatory bowel diseases: multiple benefits from therapy with dipeptidyl‐ and alanyl‐aminopeptidase inhibitors. Front Biosci. (2008) 13 3699–3713. [DOI] [PubMed] [Google Scholar]
- 41. Mitic B., Lazarevic G., Vlahovic P., Rajic M., Stefanovic V. Diagnostic value of the aminopeptidase N, N‐acetyl‐beta‐D‐glucosaminidase and dipeptidylpeptidase IV in evaluating tubular dysfunction in patients with glomerulopathies. Ren. Fail. (2008) 30 896–903. [DOI] [PubMed] [Google Scholar]
- 42. Yang E., Shim J.S., Woo H.J., Kim K.W., Kwon H.J. Aminopeptidase N/CD13 induces angiogenesis through interaction with a pro‐angiogenic protein, galectin‐3. Biochem. Biophys. Res. Commun. (2007) 363 336–341. [DOI] [PubMed] [Google Scholar]
- 43. Golbraikh A., Tropsha A. Beware of q2!. J. Mol. Graph. Model. (2002) 20 269–276. [DOI] [PubMed] [Google Scholar]
- 44. Golbraikh A., Shen M., Xiao Z., Xiao Y.D., Lee K.H., Tropsha A. Rational selection of training and test sets for the development of validated QSAR models. J. Comput. Aided Mol. Des. (2003) 17 241–253. [DOI] [PubMed] [Google Scholar]
- 45. Li M., Ni N., Wang B., Zhang Y. Modeling the excitation wavelengths (lambda(ex)) of boronic acids. J. Mol. Model. (2008) 14 441–449. [DOI] [PubMed] [Google Scholar]
Associated Data
This section collects any data citations, data availability statements, or supplementary materials included in this article.
Supplementary Materials
Figure S1. The chemical structures of natural APN inhibitors.
Figure S2. Pharmacophore alignment of Bestatin (Represent in green color) and 13f (Colored by atom type). Cyan: hydrophobic center; Red: positive nitrogen; Magenta: H‐bond donor; Green: H‐bond acceptor.
Figure S3. Structural alignments of the compounds in the training set and test set for constructing 3D‐QSAR CoMFA models.
Table S1. Observed activity versus predicted activity of the compounds in 3D‐QSAR CoMFA model.
Supporting info item
Supporting info item
Supporting info item
Supporting info item


