

Abstract
Dendritic cell‐specific intercellular adhesion molecule 3‐grabbing non‐integrin‐related (DC‐SIGNR), also known as liver/lymph node‐specific intercellular adhesion molecule 3‐grabbing non‐integrin, CLEC4M, CD209L, and CD299, is a Ca2+‐dependent lectin that has been implicated in increasing the infection rates of several viruses, including HIV, but the physiological role of DC‐SIGNR in healthy cells is currently not known with certainty. A close homologue of DC‐SIGNR, dendritic‐cell specific intercellular adhesion molecule 3‐grabbing non‐integrin, has been shown to act as a recycling endocytic receptor, which binds pathogens at the cell's surface and then releases them in the low pH environment of endosomal compartments. However, it is currently under debate in the literature as to whether DC‐SIGNR plays a similar role. In this work, we used NMR to explore whether the DC‐SIGNR carbohydrate recognition domain (CRD) shows any pH dependence in its ability to bind carbohydrates and Ca2+. We found clear evidence of reduced or abolished CRD‐binding affinities for three different glycans at low pH (4.2) as compared to neutral pH (6.8). We also report the assignment of the DC‐SIGNR CRD in the apo form, and use these new results to characterize the degree of structural rearrangement upon binding (or release) of Ca2+. Finally, we report a differential effect of pH on the affinities of glycans containing mannose exclusively versus glycans containing GlcNAc moieties. Our results lead us to propose that the DC‐SIGNR CRD rapidly and reversibly releases glycan ligands and Ca2+ at reduced pH (behaviour that would be expected for an endocytic receptor), and that the binding of mannose‐containing oligosaccharides is more strongly affected by pH than the binding of GlcNAc‐containing oligosaccharides.
Keywords: CLEC4M/liver/lymph node‐specific intercellular adhesion molecule 3‐grabbing non‐integrin/CD209L/CD299, dendritic‐cell specific intercellular adhesion molecule 3‐grabbing non‐integrin‐related (DC‐SIGNR), glycan release, low pH, solution NMR
DC‐SIGNR (CLEC4M) is a potential recycling receptor on hepatic endothelia. Solution NMR demonstrates alternate binding affinities for different glycans at low and neutral pH, and shows structural rearrangements upon binding & release of Ca2+ ions. DC‐SIGNR rapidly and reversibly releases glycan ligands and Ca2+ions at reduced pH, with oligomannose glycans showing greater pH sensitivity compared with GlcNAc‐containing glycans.
Abbreviations
- CRD
carbohydrate recognition domain
- DC‐SIGN
dendritic‐cell specific intercellular adhesion molecule 3‐grabbing non‐integrin
- DC‐SIGNR
dendritic‐cell specific intercellular adhesion molecule 3‐grabbing non‐integrin‐related
- Man
mannose
- PDB
Protein Data Bank
- VWF
von Willebrand factor
Introduction
Ca2+‐dependent (or C‐type) lectins constitute a family of proteins that have evolved to decode the information contained within complex carbohydrate structures, and have roles in cell adhesion, pathogen recognition, the immune response, and apoptosis. Two members of this family, dendritic cell‐specific intercellular adhesion molecule 3 grabbing non‐integrin (DC‐SIGN) and DC‐SIGN‐related (DC‐SIGNR), also known as liver/lymph node‐specific intercellular adhesion molecule 3‐grabbing non‐integrin, CLEC4M, CD299, and CD209L, have also been implicated in increasing rates of infection of several viruses, such as HIV‐1 1, 2, 3, 4, hepatitis C virus 5, severe acute respiratory syndrome coronavirus 6, and avian H5N1 influenza 7, via binding to sugars on glycosylated proteins expressed on viral envelopes (gp120 in the case of HIV‐1 infection). Although the complete physiological role of DC‐SIGNR is not known in full, it has been shown to have roles in cell adhesion 8 and cell signalling 9, and may also be involved in initiating the primary immune response through binding to intercellular adhesion molecule 3 on resting T lymphocytes 10. There is also speculation that DC‐SIGNR could act as an endocytic receptor by internalizing pathogens 11.
It has been shown that several C‐type lectins, including DC‐SIGN and the hepatic asialoglycoprotein receptor 12, 13, 14, act as recycling endocytic receptors. These proteins bind glycosylated ligands and pathogens at the cell surface, internalize them, and then release them into the low‐pH (~ 4.5–5.5) environment of endosomal compartments and phagolysosomes. The internalized ligands and pathogens are processed for antigen presentation and/or degraded completely before the endocytic receptor is recycled back to the cell surface for further ligand capture 15, 16, 17, 18. Despite sharing 77% sequence identity with DC‐SIGN, it is currently under debate as to whether the related protein DC‐SIGNR (expressed on sinusoidal endothelial cells found in the liver and also on selected lymphatic endothelium, placental capillary and epithelial cells of the upper respiratory tract) is a recycling endocytic receptor. Studies of immobilized DC‐SIGNR failed to show reduced binding of 125I‐labelled mannose (Man)30–BSA at low pH or internalization and degradation of this ligand by DC‐SIGNR‐transfected Rat‐6 fibroblasts 17. Furthermore, DC‐SIGNR contains only one of the two sequence motifs (a dileucine/triacidic cluster motif and Y‐XX‐Φ motif, where Φ is a hydrophobic residue 12) proposed to direct localization of DC‐SIGN into endocytic vesicles (only the dileucine motif is conserved in DC‐SIGNR). As a result, some authors argue that DC‐SIGNR has evolved to perform different (as yet not fully characterized) biological functions from DC‐SIGN that do not necessarily involve ligand internalization, such as cell adhesion and leukocyte rolling.
Conversely, Gramberg et al. 16 demonstrated strong pH dependence in the ability of DC‐SIGNR to bind a virally derived ligand (the Ebola virus glycoprotein), a four‐fold reduction in binding being observed when the pH was reduced from 7.0 to 5.0. Similar results have been reported for the binding of DC‐SIGNR to HIV gp120, where a drastic reduction in binding was observed at pH values of ≤ 5.5 15. The loss of gp120 binding by DC‐SIGNR (and DC‐SIGN) at low pH was attributed to loss of the bound calcium ions in the carbohydrate recognition domain (CRD) of the receptor, and was interpreted to suggest a release mechanism similar to that of DC‐SIGN.
These conflicting reports in the literature, coupled with the fact that understanding the pH dependence (and, by extension, the endocytic activity) of the CRD will provide valuable insights into the potential biological function of DC‐SIGNR, led us to investigate the pH dependence of Ca2+ and ligand binding in solution by using NMR spectroscopy. Here, we report the first assignment of the DC‐SIGNR CRD in the apo form, and provide direct evidence of reduced ligand‐binding affinity for the holo form of the CRD at low pH, by using solution NMR. In addition, we report the binding affinity of the CRD for GlcNAc3 for the first time. This addition to our growing body of ligand‐binding data leads us to propose that the DC‐SIGNR CRD rapidly and reversibly releases glycan ligands at reduced pH, and that the binding of Man‐containing oligosaccharides is more strongly affected by pH than the binding of GlcNAc‐containing oligosaccharides.
Results
Decreasing the pH changes the conformation of the holo‐DC‐SIGNR CRD
Before characterizing changes in ligand binding of the CRD at low pH, we wanted to investigate the magnitude of changes to the holo‐CRD structure that were purely attributable to a change in pH. For this purpose, a 0.7 mm sample of uniformly 15N‐labelled CRD (residues 262–399, with 4 mm Ca2+) was prepared and characterized (with respect to mass and purity), as described previously 19, at both pH 6.8 and pH 4.2. A pH of 4.2 was selected in this study because it is towards the lower end of the pH range expected in endosomes, and thus would provide the maximum degree of change from our previous solution conditions at pH 6.8.
The 1H/15N‐HSQC spectra of the holo‐CRD at pH 6.8 (black) and pH 4.2 (red) are shown in Fig. 1A. From these results, it is clear that a large conformational/dynamic change occurs throughout the CRD as a result of decreased pH, as ~ 80% of the peaks show significant chemical shift changes and/or broadening. Owing to the extent of changes in the low‐pH spectrum, a peak was defined as significantly perturbed if there was a large enough change in chemical shift or intensity to prevent assignment, or if the chemical shift perturbation was > 0.02 p.p.m. Thus far, attempts to assign the holo‐CRD at low pH have been hindered by issues with variable intensity and broadening, which we are working to overcome. In the absence of this assignment, a qualitative illustration of the regions affected by the reduction in pH is given in Fig. 1B. In Fig. 1B, the residues that showed clearly detectable chemical shift changes upon a reduction of the pH were mapped onto the crystal structure of the CRD [Protein Data Bank (PDB) ID http://www.rcsb.org/pdb/search/structidSearch.do?structureId=1K9J], and are shown in red (white regions are residues whose chemical shifts remained unchanged). This analysis suggests that both Ca2+‐binding loops (the primary loop containing residues 359–364, and the secondary loop containing residues 344–355), α‐helix 1 (residues 288–298), and β‐sheets 6 and 7 (residues 368–372 and 375–379) undergo changes in their fold and/or dynamics at low pH. These regions of the protein form part of the proposed glycan‐binding site, and so it is possible that changes in fold and/or dynamics at low pH may modulate glycan binding. Given that the homologous protein DC‐SIGN is known to be an endocytic receptor, the most likely explanation for these results is that the DC‐SIGNR CRD releases Ca2+ at low pH. Furthermore, these pH‐induced changes to the HSQC spectrum of the CRD are reversible: increasing the pH back to 6.8 yielded an HSQC spectrum identical to the black spectrum shown in Fig. 1A. This type of behaviour would be expected for an endocytic receptor that is required to regain its ligand‐binding ability as it is recycled back to the cell surface.
Figure 1.
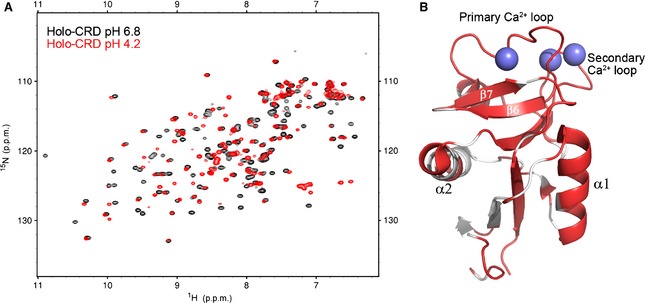
Chemical shift changes of the holo‐CRD upon reduction of the pH. (A) HSQC spectra of the holo‐CRD at pH 6.8 (black) and pH 4.2 (red). Decreasing the pH of the holo‐CRD sample caused chemical shift perturbations for ~ 80% of peaks, and variations in intensity throughout the HSQC spectrum, indicating that significant conformational and/or dynamic changes had occurred. (B) The residues whose chemical shifts remained unchanged upon reduction of the pH are mapped onto the crystal structure of the DC‐SIGNR CRD (PDB ID http://www.rcsb.org/pdb/search/structidSearch.do?structureId=1K9J) and are shown in white. The regions of the structure shown in red, including all residues in both Ca2+‐binding loops (calcium ions are represented by spheres), α‐helix 1, and β‐sheets 6 and 7, undergo clear chemical shift changes upon reduction of the pH.
Comparison with the apo‐CRD suggests that low pH causes the release of some, but not all, Ca2+
To investigate whether the changes in the CRD at low pH resulted from release of bound Ca2+, we attempted to prepare a sample of the CRD in its apo form (Ca2+‐free) by excluding Ca2+ from all reagents and water during expression. EDTA was then used as a probe to confirm that no Ca2+ was present. EDTA can be used to probe the presence of Ca2+ in solution by NMR, as the 1D/1H‐spectra of free and Ca2+‐bound EDTA can be easily distinguished 20, 21. Free EDTA results in two sharp singlet peaks resulting from the acetate‐methylene and amine‐methylene protons (labelled 1 and 2, respectively, in Fig. 2A). Ca2+ binding causes splitting of the acetate‐methylene proton peak, whereas a singlet remains for the amine‐methylene protons (Fig. 2B). In the Ca2+‐bound form, both peaks are shifted upfield with respect to the free EDTA chemical shifts. Consequently, the addition of EDTA has been used previously to screen for the presence of Ca2+ in solution 22). Figure 2A shows the 1H‐spectrum of the apo‐CRD after addition of excess EDTA. Only peaks resulting from free EDTA are observed. Given the strong affinity of EDTA for Ca2+, it was expected that EDTA would compete with the CRD for calcium ions if any were present in the apo‐CRD sample. This was confirmed by addition of increasing concentrations of EDTA to a sample of the holo‐CRD (Fig. 2B,C), which resulted in peaks attributable to Ca2+‐bound EDTA. The presence of only free EDTA peaks in Fig. 2A suggests that the CRD is in the apo form and that no Ca2+ is present.
Figure 2.
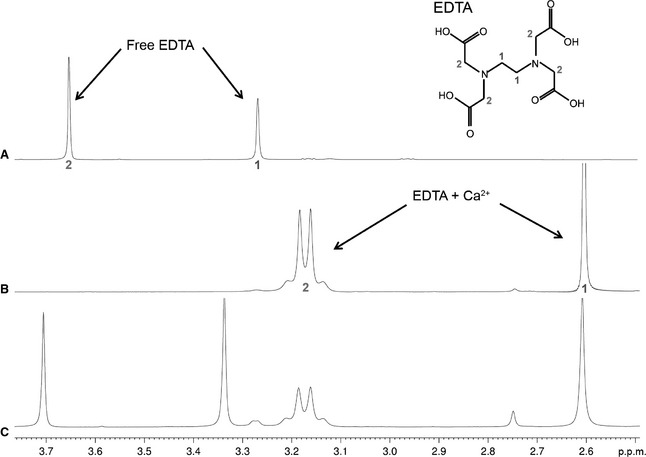
1D 1H‐spectra obtained with (A) addition of EDTA to the apo‐CRD, (B) addition of EDTA to the holo‐CRD, and (C) addition of excess EDTA to the holo‐CRD. All spectra were recorded at pH 6.8. EDTA can be used to probe for the presence of Ca2+, as the 1D spectra of free and Ca2+‐bound EDTA are easily identified. Assignments are mapped onto the EDTA structure, and the pH was kept constant for all spectra. Addition of EDTA to the apo‐CRD (A) produced only free EDTA peaks, confirming that there was no Ca2+ present, and that the protein was indeed in the apo‐form. In contrast, addition of EDTA to the holo‐CRD (B) produced only Ca2+‐bound EDTA peaks, as the free Ca2+ interacts with EDTA. Addition of excess EDTA to the holo‐CRD (C) resulted in the appearance of additional free EDTA peaks.
Figure 3 shows a partial assignment of the apo‐CRD. Unfortunately, the variable intensity of the apo‐CRD HSQC spectrum (most likely a result of the dynamic nature of the CRD in the absence of Ca2+) prevented complete assignment. Nevertheless, the assignments for the apo‐CRD have been deposited at the BMRB (ID 25046) and compared with our previously published values for the holo‐CRD (BMRB ID 19297 19) in Fig. 4. Figure 4A shows a comparison of the HSQC spectra of the apo‐CRD (black spectrum) and holo‐CRD (red spectrum) at pH 6.8. It is clear that substantial chemical shift changes occur throughout the spectrum, suggesting a conformational change that is directly associated with Ca2+ binding. In addition, some of the signals in the apo‐CRD spectrum are severely broadened as compared with the holo‐CRD spectrum, suggesting dynamics on the intermediate NMR timescale. The addition of Ca2+ reduces this variable intensity.
Figure 3.
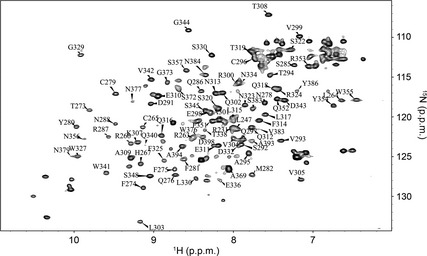
Assignment of the apo‐CRD (Ca2+‐free) at pH 6.8. Partial assignment of the apo‐CRD HSQC spectrum at pH 6.8. The absence of Ca2+ was confirmed by addition of EDTA, showing that the CRD was indeed in the apo form.
Figure 4.
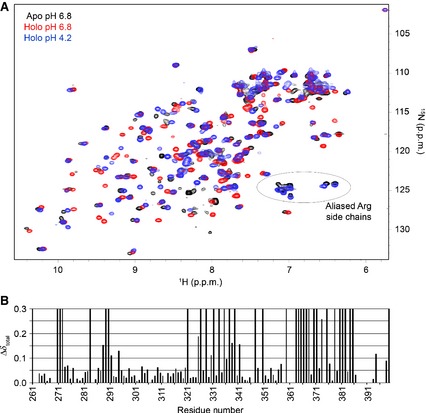
(A) HSQC spectra of the apo‐CRD at pH 6.8 (black), the holo‐CRD at pH 6.8 (red), and the holo‐CRD at pH 4.2 (blue). It is clear from the HSQC spectra that substantial chemical shift perturbations occurred throughout the CRD upon binding of Ca2+ (i.e. upon addition of 4 mm Ca2+). In addition, the spectrum of the apo‐CRD is broader than that of the holo‐CRD, suggesting a change in dynamics upon Ca2+ binding. Comparison of the HSQC spectra of the apo‐CRD at pH 6.8 and the holo‐CRD at pH 4.2 indicates that reduction of the pH does not generate the Ca2+‐free, apo form, but instead produces an additional, distinct species that may represent a ‘Ca2+‐depleted’ form or multiple species. These two spectra do show a similar pattern of peaks (circled) that we have interpreted to be aliased arginine side chain peaks in very similar chemical environments. (B) Total chemical shift perturbation per residue (Δδtotal; see Experimental procedures) observed upon removal of Ca2+ (comparing apo‐CRD and holo‐CRD 1H and 15N chemical shifts) at pH 6.8. Peaks that have moved/broadened so significantly as to prevent their assignment in the apo‐CRD spectrum are represented with a maximum perturbation of 0.3.
Figure 4B shows the total chemical shift perturbation per residue (Δδtotal; see Experimental procedures) upon removal of Ca2+. In this plot, peaks that have moved/broadened so significantly as to prevent their assignment in the apo‐CRD are represented in Fig. 4B with a maximum perturbation of 0.3. This value was assigned arbitrarily to highlight the residues that were most strongly affected by removal of Ca2+, but were not amenable to calculation of Δδtotal. Unsurprisingly, these results demonstrate that removal of Ca2+ affects the entire CRD structure. As Ca2+ is required for glycan binding to DC‐SIGNR, it is reasonable to conclude that these conformational/dynamic changes are instrumental in increasing the affinity of the CRD for ligands.
The HSQC spectrum of the apo‐CRD (pH 6.8) was then compared with that of the holo‐CRD at low pH (pH 4.2; blue spectrum in Fig. 4A) to determine whether reducing the pH caused release of all calcium ions by the CRD to yield the apo form. These two spectra are also quite distinct from one another, but they do show a similar pattern of peaks that only appear in the apo‐CRD spectrum or at low pH in the holo‐CRD spectrum (they are absent in the holo‐CRD spectrum at pH 6.8). These peaks (circled and labelled in Fig. 4A) are likely to be aliased arginine side chain peaks. Given that the pH range investigated here was low enough to stabilize protonation of the arginine side chain (pK a = 12.5), these results suggest that the side chain NH groups in six of the nine arginines in the protein have very similar chemical environments (as shown by their similar 1H and 15N chemical shifts) in the apo‐CRD at pH 6.8 and the holo‐CRD at pH 4.2. Despite these similarities, the differences in chemical shift and peak intensities of these two spectra indicate that a reduction of the pH does not simply remove all calcium ions to yield the apo‐CRD, but may produce a ‘Ca2+‐depleted’ form or multiple species (e.g. apo, holo, and Ca2+depleted) of the CRD in exchange with one another, but more work is needed to confirm this.
Evidence of glycan release at low pH
The large number of chemical shift perturbations observed in Fig. 1A upon a reduction of the pH suggests a change in the conformation and/or dynamics of the CRD, perhaps triggered by a reduction in Ca2+ affinity (Ca2+ release). Such a mechanism would be expected for an endocytic receptor releasing its ligand at low pH. The effects of pH on the binding of various ligands to the CRD were tested with HSQC‐based chemical shift perturbations as an indicator of ligand binding. This approach was used by us previously to confirm glycan binding (via chemical shift perturbations) and to determine the affinity of a range of small glycans, including Man3 and GlcNAc2Man3 19, at pH 6.8, which showed affinities in the range of 1–2 mm.
To measure any changes in ligand affinity at reduced pH, Man3 and GlcNAc2Man3 were titrated into separate samples of either 0.4 mm or 0.7 mm CRD, respectively, prepared at pH 4.2. The pH was adjusted, and a 1H/15N‐HSQC spectrum was acquired after each addition of glycan. Because carbohydrates are weak acids with pK a values ranging from 12 to 14 23, and a reduction of the pH from 6.8 to 4.2 would therefore not affect the glycan protonation state, any changes in the HSQC spectrum upon reduction in pH were attributed to the pH dependence of the CRD. Figure 5 shows an overlay of the glycan‐free spectrum (black) at pH 4.2 and the spectrum obtained after addition of 5 mm Man3 (green) to a 0.4 mm solution of the CRD at the same pH. Even at this concentration of Man3, which was the highest tested and represents a 12.5‐fold molar excess of Man3 with respect to the CRD, no change in the HSQC spectrum was observed at pH 4.2. This is in contrast to our previous results obtained at pH 6.8, where Man3 binding resulted in several significant and obvious chemical shift perturbations (see Fig. S4 in 19), and confirms that Man3 does not bind to the CRD at pH 4.2. The ability of the CRD to release Man at low pH was investigated further by binding the CRD to a 2‐mL Man–Sepharose column at neutral pH (pH 7.8) (see Experimental procedures) and eluting either with EDTA (Fig. 6A) or with reduction of the pH to 4.2 in an EDTA‐free buffer (Fig. 6B). In both cases, SDS/PAGE confirmed that DC‐SIGNR dissociated from the mannosylated resin and eluted from the column. Although the rate of dissociation varied (EDTA yielded rapid elution of the CRD, whereas low pH results in slower elution into more fractions), the results clearly demonstrate that reducing the pH greatly lowers the affinity of the CRD for Man.
Figure 5.
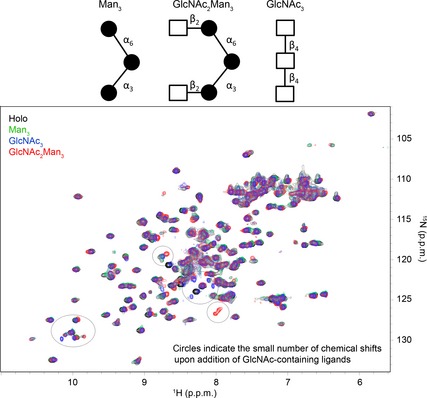
Structural representations of the three glycans investigated in this work. Shown below is the HSQC spectrum of the holo‐CRD (0.4 0.7 mm) at pH 4.2 in the absence (black) and presence (green) of 5 mm Man3 (12.5‐fold molar excess), 10 mm GlcNAc2Man3 (14‐fold molar excess; red), and 10 mm GlcNAc3 (14‐fold molar excess; blue). The addition of Man3 to the CRD at low pH yielded no changes in the CRD spectrum, suggesting that Man binding to the CRD is pH‐dependent. Some small perturbations were observed upon addition of GlcNAc2Man3 and GlcNAc3 at low pH, and suggest that binding of the CRD to the GlcNAc moiety may not be completely abolished at low pH.
Figure 6.
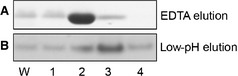
Elution of the CRD from a Man–Sepharose column with EDTA or low‐pH buffer. (A) The CRD was eluted from the Man–Sepharose column with 5 mm EDTA in 20 mm Hepes buffer (pH 7.8) and 150 mm NaCl. The majority of the protein was eluted in fraction 2, although small amounts of protein were also detected in other fractions, as well as in the wash (W). (B) In an equivalent experiment, the CRD was also eluted from the column with an EDTA‐free buffer (same as above) adjusted to pH 4.2. The majority of the protein was eluted in fraction 3, confirming that the CRD is capable of releasing ligand at low pH. As observed in (A), there appeared to be a small amount of residual protein in subsequent fractions, as well as in the wash (W).
A similar pH dependence of binding was observed for GlcNAc2Man3 (red spectrum in Fig. 5). Upon addition of a 14‐fold molar excess of GlcNAc2Man3 to a 0.7 mm solution of the CRD, a small number of chemical shift changes were observed as compared with the holo‐CRD HSQC spectrum at pH 4.2, and these regions are circled in Fig. 5. However, the number of perturbations was far fewer than observed at pH 6.8 (see Fig. S3 in 19 for comparison). These results suggest that, although binding of GlcNAc2Man3 is not completely abolished at low pH, as is the case for Man3, the affinity is greatly reduced. A third ligand, GlcNAc3, which was not included in our previous study, was investigated here for the first time to determine whether the differences in pH sensitivity could be traced to the GlcNAc moiety of GlcNAc2Man3. First, binding of GlcNAc3 to the CRD was confirmed at near‐neutral pH by titrating increasing concentrations of GlcNAc3 (up to 10 mm, 14‐fold molar excess) into a 0.7 mm 15N‐labelled CRD sample at pH 6.8. Significant chemical shift perturbations were observed in several regions of the HSQC spectrum, confirming GlcNAc3 binding (see Fig. 7A for perturbation results), and these mapped to regions of the CRD that agree well with our previous results [see Fig. 7B for mapping of significant perturbations onto the crystal structure of the CRD (PDB ID http://www.rcsb.org/pdb/search/structidSearch.do?structureId=1K9K)]. The chemical shift perturbations were fitted to a single‐site binding model (Fig. 7C) as described previously 19, yielding a K D of 3.58 ± 0.66 mm. This is approximately double the K D of Man‐containing glycans measured with the same method, which all ranged from 1.5 mm to 2.2 mm. Figure 5 shows an overlay of the HSQC spectra of the holo‐CRD (black) and the CRD after addition of 10 mm GlcNAc3 (blue) at pH 4.2. The size and number of perturbations are very similar to those observed for GlcNAc2Man3. Taken together, these data suggest that the binding of Man to the CRD is more sensitive to pH than the binding of GlcNAc moieties; however, binding of all three glycans studied here appears to be significantly impaired at low pH.
Figure 7.
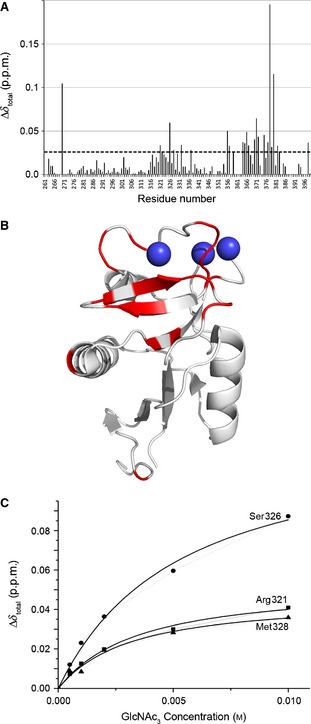
Chemical shift perturbation upon binding of GlcNAc3 to the CRD. (A) Total chemical shift perturbation per residue (Δδtotal) upon addition of GlcNAc3 was calculated from Eqn (1) in Experimental procedures. The dashed horizontal line represents the 1 × standard deviation cut‐off for the dataset, above which a change was considered to be significant. (B) Chemical shift perturbations upon binding of GlcNAc3 mapped onto the CRD crystal structure. Residues showing chemical shift perturbations above the 1 × standard deviation cut‐off (see dashed line) are shown in red on the CRD crystal structure (PDB ID http://www.rcsb.org/pdb/search/structidSearch.do?structureId=1K9J). These agree well with the regions of the CRD that responded most strongly to binding of the small glycans (Man3, Man5, and GlcNAc2Man3) previously reported, namely α‐helix 2, β‐strands 6 and 7, and both Ca2+‐binding loops. (C) The total chemical shift perturbation per residue (Δδtotal) is plotted against glycan concentration, and fitted to a single‐site binding model. All significantly perturbed residues fit the same single‐site model, but here only three residues in α‐helix 2 (a proposed binding site for small glycan fragments) are shown as an illustration. The fit was used to calculate the dissociation constant of the CRD for GlcNAc3.
Discussion
Reducing the pH alters the DC‐SIGNR CRD structure
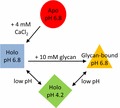
In this study, we have demonstrated that, in the absence of glycan ligands, decreasing the pH of the holo‐CRD from 6.8 to 4.2 causes substantial changes throughout the HSQC spectrum (i.e. both chemical shift changes and variable intensity of peaks), suggestive of a structural rearrangement. This structural rearrangement is as yet uncharacterized, mainly because of difficulties arising from variable intensity in these spectra, which we are currently trying to overcome. We suggest that this structural rearrangement could be attributable to the release of bound calcium ions, as it is well known that the CRD has three structurally important bound calcium ions that stabilize the CRD structure and contribute to glycan binding 24. However, our data clearly show that reduction of the pH does not simply generate the apo (Ca2+‐free) form of the CRD, but instead produces a new species (see Fig. 8 for a summary of the species observed in this study), which we have tentatively attributed to a ‘Ca2+‐depleted’ form of the CRD. DC‐SIGNR, like many C‐type lectins, is known to bind a primary Ca2+ with higher affinity than the two secondary calcium ions. Therefore, it is reasonable to speculate that reducing the pH causes the protein to release the lower‐affinity calcium ions, while binding to the higher‐affinity, primary Ca2+ may remain. The loss of these secondary calcium ions may explain the reduced/abolished glycan binding. This ‘Ca2+‐depleted’ form of the protein has a conformation and dynamics that are distinct from those of the apo form and holo form at near‐neutral pH, and is the predominant species in solution at pH 4.2 in either the presence or the absence of the glycan.
Figure 8.
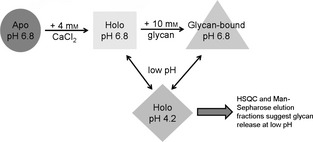
Schematic representation of the data described in this paper and the CRD species that have been observed. The different shapes represent the HSQC spectra of the CRD under different conditions, and where changes in 1H and 15N chemical shifts are observed. As indicated, the HSQC spectra of the holo‐CRD and the glycan‐bound CRD at low pH are very similar (and, in the case of Man3 binding, identical), suggesting a similar fold and extremely weak (or no) glycan binding, as would be expected for an endocytic receptor.
Glycan binding is greatly reduced/abolished for the DC‐SIGNR CRD at pH 4.2
This predominant CRD species present at pH 4.2 in our experiments has little or no propensity to bind any of the simple glycans studied here, namely Man3, GlcNAc3, and GlcNAc2Man3. All three of these ligands have K D values in the range of 1.5–3.5 mm at pH 6.8, but yield minimal or no chemical shift changes for peaks in the CRD HSQC‐spectrum at low pH, even upon titration of a 12–14‐fold molar excess of ligand (thus preventing any attempts to quantify binding constants at pH 4.2 by using NMR chemical shifts). For example, stepwise titration of excess Man3 into a low‐pH (pH 4.2) sample of 15N‐labelled DC‐SIGNR produced no chemical shift perturbations, indicating that binding of Man3 to the CRD is abolished at low pH. These NMR‐based results were largely supported by the successful elution of the CRD from a Man–Sepharose column in pH 4.2 buffer containing no EDTA. This observed reduction in glycan binding at low pH provides the first atomic‐resolution evidence supporting the hypothesis that DC‐SIGNR has a role as an endocytic receptor 15, 16, like its homologue DC‐SIGN. This is consistent with the presence of DC‐SIGNR in abundance on the surfaces of hepatic sinusoidal endothelial cells, which are highly specialized cells that are unusual among vascular endothelial cell types for their high capacity to internalize materials for immunological processing, with proximity to large hepatic repositories of T lymphocytes 25.
Differences in pH sensitivity observed for Man‐containing and GlcNAc‐containing glycans
In our low‐pH glycan–CRD binding studies, we did observe a small number of chemical shift changes upon addition of an excess of GlcNAc‐containing glycans (namely GlcNAc2Man3 and GlcNAc3), although these perturbations were not as pronounced as those seen at pH 6.8. These results were in contrast to our observations upon addition of Man3, which did not yield any chemical shift changes, and suggest that the binding of Man to the CRD is more sensitive to pH than binding of GlcNAc moieties. A possible explanation for this difference in binding at low pH between Man and GlcNAc moieties is that there are slight differences in the binding sites of the glycans studied here. Indeed, there are slight differences between the regions of the protein that are significantly perturbed by Man‐containing glycans (see Fig. 5 in 19) and those that are perturbed by GlcNAc3 (Fig. 5B). In addition, the crystal structure 1K9J shows that the GlcNAc moiety (and not Man) forms coordination bonds with the primary Ca2+. If we assume that the higher‐affinity primary Ca2+ remains bound to DC‐SIGNR at low pH, this may explain why GlcNAc binding is not completely abolished at low pH (although it is drastically reduced). Although the differences between DC‐SIGNR binding to Man and to GlcNAc at low pH are quite subtle, these results are interesting, given recent work demonstrating that DC‐SIGNR serves as an internalization receptor for von Willebrand factor (VWF), an important regulator of blood coagulation and a high molecular mass circulating glycoprotein 26. These findings indicate a very important, endogenous role for DC‐SIGNR in the removal of senescent glycoproteins from the circulation, most likely via the hepatic sinusoidal endothelium, as part of healthy homeostasis. Interestingly, the glycosylation profile of VWF shows a rich variety of GlcNAc‐rich N‐linked oligosaccharides and a scarcity of high‐Man oligosaccharides 27. The complete structural basis for DC‐SIGNR binding to VWF is not known, but it would appear likely that engagement of appropriate clusters of GlcNAc‐rich glycans would predominate. The observed retention of a small degree of GlcNAc‐rich ligand binding at lower pH, in contrast to glycans composed exclusively of Man, may affect the fate of different glycoprotein ligands internalized via DC‐SIGNR. Those released earlier at weakly acidic pH may traffic to early endosomes, whereas tighter‐binding glycoproteins may traffic to late endosomes/lysosomes for complete degradation. This raises the possibility that DC‐SIGNR can serve as a receptor for multiple glycoprotein ligands and also contribute to the determination of their individual intracellular destinations, depending on their specific glycosylation patterns.
Experimental procedures
Expression and purification of 13C/15N isotopically labelled DC‐SIGNR CRD fragments
Labelled CRD for NMR studies was expressed and purified as described previously 19. Briefly, the protein CRD fragment was purified by use of a 2‐mL Man–Sepharose column (equilibrated with 25 mm Hepes, 5 mm CaCl2, 150 mm NaCl, pH 7.8), and eluted with 25 mm Hepes, 5 mm EDTA, and 150 mm NaCl (pH 7.8). Fractions were analysed for purity and oligomeric state with MS, SDS/PAGE and CD spectroscopy, as described previously 19. In order to test the pH dependence of ligand binding, a low‐pH buffer (25 mm Hepes, 150 mm NaCl, pH 4.2) was used for elution from a Man–Sepharose column in the absence of EDTA.
Carbohydrates
All carbohydrate fragments [(GlcNAc)2Man3 (Catalog no. M592), GlcNAc3 (Catalog no. C314), and Man3 (Catalog no. M336)] were purchased from Dextra Labs (Dextra, Science and Technology Centre, Reading, UK) and used with no further purification.
NMR spectroscopy
Purified protein samples were subjected to extensive dialysis into water (1 week with 12 buffer changes) before they were lyophilized. The protein was then dissolved in 180 μL of 20 mm d‐Hepes and 20 mm NaCl (pH 6.8) in 10% D2O/90% H2O to a final concentration of 0.7 mm CRD. NMR experiments were carried out at 37 °C on a 700‐MHz Bruker Avance spectrometer fitted with a cryoprobe (housed at the University of Warwick). Proton chemical shifts were referenced against external sodium 3‐(trimethylsilyl) propane‐1‐sulfonate, and nitrogen chemical shifts were referenced indirectly to sodium 3‐(trimethylsilyl)propane‐1‐sulfonate by use of the absolute frequency ratio 28. 1D proton spectra were acquired with the pulse sequence described by Liu et al. 29. 2D 1H/15N‐HSQC spectra were acquired with the pulse sequence described by Davis et al. 30. HSQC spectra were recorded with 128 increments in the t 1 dimension and 1000 data points in the t 2 dimension. The sweep width was 18.0 p.p.m. in the 1H dimension and 31.8 p.p.m. in the 15N dimension.
The backbone assignment of the CRD in the apo form (Ca2+‐free) was carried out with the complete suite of triple‐resonance experiments [experiments (CBCA(CO)NH 31, CBCANH 32, HNCA 33, HN(CO)CA 34, HNCO 33, and HN(CA)CO 35], as described previously 19.
Carbohydrate titrations
GlcNAc3 titration experiments were carried out by adding increasing amounts of glycan to 0.7 mm [U‐15N,13C]DC‐SIGNR CRD at pH 6.8 or pH 4.2, and acquiring a series of 2D 1H/15N‐HSQC spectra at 37 °C. At pH 6.8, binding of GlcNAc3 reached saturation at a concentration of 10 mm (> 14‐fold molar excess). Experiments at pH 4.2 were carried out in the same manner, by addition of GlcNAc3 up to a concentration of 10 mm. (GlcNAc)2Man3 titration experiments were carried out by adding increasing amounts of glycan, up to a final concentration of 10 mm (> 14‐fold molar excess), to 0.7 mm [U‐15N,13C]DC‐SIGNR CRD at pH 4.2 only, and acquiring a series of 2D 1H/15N‐HSQC spectra at 37 °C. Man3 titration experiments were carried out by adding increasing amounts of glycan, up to a final concentration of 5 mm (> 12‐fold molar excess), to 0.4 mm [U‐15N,13C]DC‐SIGNR CRD at pH 4.2, and acquiring a series of 2D 1H/15N‐HSQC spectra at 37 °C. In all experiments, the pH and temperature were held constant throughout the titration.
The total chemical shift perturbation per residue (Δδtotal) was calculated from Eqn (1):
| (1) |
where ΔδNH and ΔδN are the chemical shift differences in the 1H and 15N dimensions, respectively. The weighting factor of 0.1 applied to the nitrogen chemical shift corresponds to the difference in magnetogyric ratios between 15N and 1H nuclei, as reported previously 36. Residues significantly perturbed by ligand addition were determined by calculating the standard deviation of the chemical shift perturbations across all residues for each carbohydrate, and using this as a cut‐off 36.
Author contributions
F. Probert performed and planned experiments, analysed data, and contributed to writing. D. A. Mitchell contributed reagents and other essential materials, and contributed to writing. A. M. Dixon planned experiments, analysed data, and wrote the paper.
Acknowledgements
F. Probert was supported by the Engineering and Physical Sciences Research Council (grant EP/F500378/1) through the MOAC Doctoral Training Centre. The authors wish to acknowledge I. Prokes (University of Warwick) for NMR assistance, and R. Wallis (University of Leicester) for Man–Sepharose columns.
References
- 1. Baribaud F, Pohlmann S & Doms RW (2001) The role of DC‐SIGN and DC‐SIGNR in HIV and SIV attachment, infection, and transmission. Virology 286, 1–6. [DOI] [PubMed] [Google Scholar]
- 2. Dalgleish AG, Beverley PC, Clapham PR, Crawford DH, Greaves MF & Weiss RA (1984) The CD4 (T4) antigen is an essential component of the receptor for the AIDS retrovirus. Nature 312, 763–767. [DOI] [PubMed] [Google Scholar]
- 3. Kwong PD, Wyatt R, Robinson J, Sweet RW, Sodroski J & Hendrickson WA (1998) Structure of an HIV gp120 envelope glycoprotein in complex with the CD4 receptor and a neutralizing human antibody. Nature 393, 648–659. [DOI] [PMC free article] [PubMed] [Google Scholar]
- 4. Myszka DG, Sweet RW, Hensley P, Brigham‐Burke M, Kwong PD, Hendrickson WA, Wyatt R, Sodroski J & Doyle ML (2000) Energetics of the HIV gp120–CD4 binding reaction. Proc Natl Acad Sci USA 97, 9026–9031. [DOI] [PMC free article] [PubMed] [Google Scholar]
- 5. Pohlmann S, Baribaud F & Doms RW (2001) DC‐SIGN and DC‐SIGNR: helping hands for HIV. Trends Immunol 22, 643–646. [DOI] [PubMed] [Google Scholar]
- 6. Jeffers SA, Tusell SM, Gillim‐Ross L, Hemmila EM, Achenbach JE, Babcock GJ, Thomas WD Jr, Thackray LB, Young MD, Mason RJ et al (2004) CD209L (L‐SIGN) is a receptor for severe acute respiratory syndrome coronavirus. Proc Natl Acad Sci USA 101, 15748–15753. [DOI] [PMC free article] [PubMed] [Google Scholar]
- 7. Wang SF, Huang JC, Lee YM, Liu SJ, Chan YJ, Chau YP, Chong P & Chen YM (2008) DC‐SIGN mediates avian H5N1 influenza virus infection in cis and in trans. Biochem Biophys Res Commun 373, 561–566. [DOI] [PMC free article] [PubMed] [Google Scholar]
- 8. Yabe R, Tateno H & Hirabayashi J (2010) Frontal affinity chromatography analysis of constructs of DC‐SIGN, DC‐SIGNR and LSECtin extend evidence for affinity to agalactosylated N‐glycans. FEBS J 277, 4010–4026. [DOI] [PMC free article] [PubMed] [Google Scholar]
- 9. Johnson TR, McLellan JS & Graham BS (2012) Respiratory syncytial virus glycoprotein G interacts with DC‐SIGN and L‐SIGN to activate ERK1 and ERK2. J Virol 86, 1339–1347. [DOI] [PMC free article] [PubMed] [Google Scholar]
- 10. Bashirova AA, Geijtenbeek TBH, van Duijnhoven GCF, van Vliet SJ, Eilering JBG, Martin MP, Wu L, Martin TD, Viebig N, Knolle PA et al (2001) A dendritic cell‐specific intercellular adhesion molecule 3‐grabbing nonintegrin (DC‐SIGN)‐related protein is highly expressed on human liver sinusoidal endothelial cells and promotes HIV‐1 infection. J Exp Med 193, 671–678. [DOI] [PMC free article] [PubMed] [Google Scholar]
- 11. Chen Y, Chan VS‐F, Zheng B, Chan KY‐K, Xu X, To LY‐F, Huang F‐P, Khoo U‐S & Lin C‐LS (2007) A novel subset of putative stem/progenitor CD34 + Oct‐4 + cells is the major target for SARS coronavirus in human lung. J Exp Med 204, 2529–2536. [DOI] [PMC free article] [PubMed] [Google Scholar]
- 12. Engering A, Geijtenbeek TB, van Vliet SJ, Wijers M, van Liempt E, Demaurex N, Lanzavecchia A, Fransen J, Figdor CG, Piguet V et al (2002) The dendritic cell‐specific adhesion receptor DC‐SIGN internalizes antigen for presentation to T cells. J Immunol 168, 2118–2126. [DOI] [PubMed] [Google Scholar]
- 13. Valladeau J, Ravel O, Dezutter‐Dambuyant C, Moore K, Kleijmeer M, Liu Y, Duvert‐Frances V, Vincent C, Schmitt D, Davoust J et al (2000) Langerin, a novel C‐type lectin specific to Langerhans cells, is an endocytic receptor that induces the formation of Birbeck granules. Immunity 12, 71–81. [DOI] [PubMed] [Google Scholar]
- 14. Wragg S & Drickamer K (1999) Identification of amino acid residues that determine pH dependence of ligand binding to the asialoglycoprotein receptor during endocytosis. J Biol Chem 274, 35400–35406. [DOI] [PubMed] [Google Scholar]
- 15. Snyder GA, Ford J, Torabi‐Parizi P, Arthos JA, Schuck P, Colonna M & Sun PD (2005) Characterization of DC‐SIGN/R interaction with human immunodeficiency virus type 1 gp120 and ICAM molecules favors the receptor's role as an antigen‐capturing rather than an adhesion receptor. J Virol 79, 4589–4598. [DOI] [PMC free article] [PubMed] [Google Scholar]
- 16. Gramberg T, Soilleux E, Fisch T, Lalor PF, Hofmann H, Wheeldon S, Cotterill A, Wegele A, Winkler T, Adams DH et al (2008) Interactions of LSECtin and DC‐SIGN/DC‐SIGNR with viral ligands: differential pH dependence, internalization and virion binding. Virology 373, 189–201. [DOI] [PMC free article] [PubMed] [Google Scholar]
- 17. Guo Y, Feinberg H, Conroy E, Mitchell DA, Alvarez R, Blixt O, Taylor ME, Weis WI & Drickamer K (2004) Structural basis for distinct ligand‐binding and targeting properties of the receptors DC‐SIGN and DC‐SIGNR. Nat Struct Mol Biol 11, 591–598. [DOI] [PubMed] [Google Scholar]
- 18. Mellman I, Fuchs R & Helenius A (1986) Acidification of the endocytic and exocytic pathways. Annu Rev Biochem 55, 663–700. [DOI] [PubMed] [Google Scholar]
- 19. Probert F, Whittaker SB‐M, Crispin M, Mitchell DA & Dixon AM (2013) Solution NMR analyses of the C‐type carbohydrate recognition domain of DC‐SIGNR protein reveal different binding modes for HIV‐derived oligosaccharides and smaller glycan fragments. J Biol Chem 288, 22745–22757. [DOI] [PMC free article] [PubMed] [Google Scholar]
- 20. Han S, Mathias EV & Ba Y (2007) Proton NMR determination of Mg2+ and Ca2+ concentrations using tetrasodium EDTA complexes. J Chem 1, 1–5. [Google Scholar]
- 21. Han S & Ba Y (2004) Determination of the concentrations of metal cations in aqueous solutions using proton NMR spectral area integration of the EDTA complexes. J Solution Chem 33, 301–312. [Google Scholar]
- 22. Yappert MC & DuPre DB (1997) Complexometric titrations: competition of complexing agents in the determination of water hardness with EDTA. J Chem Educ 74, 1422–1423. [Google Scholar]
- 23. Lange NA & Speight JG (2005) Lange's Handbook of Chemistry, 16th edn McGraw‐Hill, New York, London. [Google Scholar]
- 24. Feinberg H, Mitchell DA, Drickamer K & Weis WI (2001) Structural basis for selective recognition of oligosaccharides by DC‐SIGN and DC‐SIGNR. Science 294, 2163–2166. [DOI] [PubMed] [Google Scholar]
- 25. Lai WK, Sun PJ, Zhang J, Jennings A, Lalor PF, Hubscher S, McKeating JA & Adams DH (2006) Expression of DC‐SIGN and DC‐SIGNR on human sinusoidal endothelium: a role for capturing hepatitis C virus particles. Am J Pathol 169, 200–208. [DOI] [PMC free article] [PubMed] [Google Scholar]
- 26. Rydz N, Swystun LL, Notley C, Paterson AD, Riches JJ, Sponagle K, Boonyawat B, Montgomery RR, James PD & Lillicrap D (2013) The C‐type lectin receptor CLEC4M binds, internalizes, and clears von Willebrand factor and contributes to the variation in plasma von Willebrand factor levels. Blood 121, 5228–5237. [DOI] [PMC free article] [PubMed] [Google Scholar]
- 27. Canis K, McKinnon TAJ, Nowak A, Haslam SM, Panico M, Morris HR, Laffan MA & Dell A (2012) Mapping the N‐glycome of human von Willebrand factor. Biochem J 447, 217–228. [DOI] [PubMed] [Google Scholar]
- 28. Wishart DS, Bigam CG, Yao J, Abildgaard F, Dyson HJ, Oldfield E, Markley JL & Sykes BD (1995) H‐1, C‐13 and N‐15 chemical‐shift referencing in biomolecular Nmr. J Biomol NMR 6, 135–140. [DOI] [PubMed] [Google Scholar]
- 29. Liu ML, Mao XA, Ye CH, Huang H, Nicholson JK & Lindon JC (1998) Improved WATERGATE pulse sequences for solvent suppression in NMR spectroscopy. J Magn Reson 132, 125–129. [Google Scholar]
- 30. Davis AL, Keeler J, Laue ED & Moskau D (1992) Experiments for recording pure‐absorption heteronuclear correlation spectra using pulsed field gradients. J Magn Reson 98, 207–216. [Google Scholar]
- 31. Grzesiek S & Bax A (1992) An efficient experiment for sequential backbone assignment of medium‐sized isotopically enriched proteins. J Magn Reson 99, 201–207. [Google Scholar]
- 32. Wittekind M & Mueller L (1993) Hncacb, a high‐sensitivity 3d Nmr experiment to correlate amide‐proton and nitrogen resonances with the alpha‐carbon and beta‐carbon resonances in proteins. J Magn Reson B 101, 201–205. [Google Scholar]
- 33. Kay LE, Ikura M, Tschudin R & Bax A (1990) 3‐Dimensional triple‐resonance Nmr‐spectroscopy of isotopically enriched proteins. J Magn Reson 89, 496–514. [DOI] [PubMed] [Google Scholar]
- 34. Bax A & Ikura M (1991) An efficient 3D NMR technique for correlating the proton and 15N backbone amide resonances with the alpha‐carbon of the preceding residue in uniformly 15N/13C enriched proteins. J Biomol NMR 1, 99–104. [DOI] [PubMed] [Google Scholar]
- 35. Clubb RT, Thanabal V & Wagner G (1992) A constant‐time 3‐dimensional triple‐resonance pulse scheme to correlate intraresidue H‐1(N), N‐15, and C‐13(′) chemical‐shifts in N‐15‐C‐13‐labeled proteins. J Magn Reson 97, 213–217. [Google Scholar]
- 36. Schumann FH, Riepl H, Maurer T, Gronwald W, Neidig KP & Kalbitzer HR (2007) Combined chemical shift changes and amino acid specific chemical shift mapping of protein–protein interactions. J Biomol NMR 39, 275–289. [DOI] [PubMed] [Google Scholar]