

SUMMARY
Mitochondria and lysosomes are functionally linked, and their interdependent decline is a hallmark of aging and disease. Despite the longstanding connection between these organelles, the function(s) of lysosomes required to sustain mitochondrial health remains unclear. Here, working in yeast, we show that the lysosome-like vacuole maintains mitochondrial respiration by spatially compartmentalizing amino acids. Defects in vacuole function result in a breakdown in intracellular amino acid homeostasis, which drives age-related mitochondrial decline. Amongst amino acids, we find that cysteine is most toxic for mitochondria, and show that elevated non-vacuolar cysteine impairs mitochondrial respiration by limiting intracellular iron availability through an oxidant-based mechanism. Cysteine depletion or iron supplementation restores mitochondrial health in vacuole-impaired cells, and prevents mitochondrial decline during aging. These results demonstrate that cysteine toxicity is a major driver of age-related mitochondrial deterioration, and identify vacuolar amino acid compartmentation as a cellular strategy to minimize amino acid toxicity.
Keywords: Mitochondria, lysosome, vacuole, iron, aging, yeast, amino acid, cysteine, V-ATPase
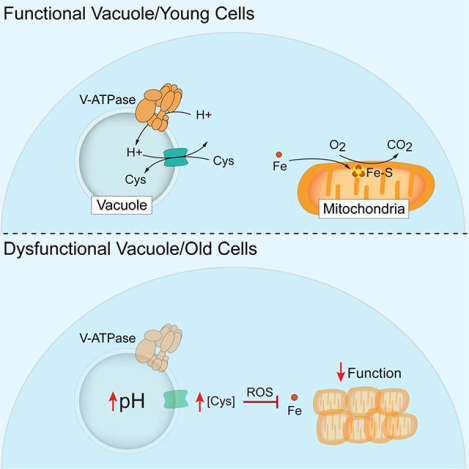
Graphical Abstract
eTOC:
Breakdown of the spatial compartmentalization of amino acids by vacuoles is a key driver of age-related mitochondrial deterioration through ROS-dependent perturbation of iron homeostasis.
INTRODUCTION
Mitochondria are a hub for cellular metabolism (Friedman and Nunnari, 2014). They produce ATP, house pathways for amino acid, nucleotide, heme, iron-sulfur cluster (ISC) and lipid metabolism (Rutter and Hughes, 2015), and facilitate reactive oxygen species (ROS) signaling, innate immunity, and apoptosis (Chandel, 2014). Mitochondrial decline is a hallmark of aging and age-related disease (Nunnari and Suomalainen, 2012; Wallace, 2005). However, what drives mitochondrial decline during aging remains unclear.
Working in the budding yeast, S. cerevisiae, we recently shed light on this question by showing that deterioration of the lysosome-like vacuole is an early event during yeast replicative aging, and that loss of vacuole acidification underlies age-related mitochondrial dysfunction (Hughes and Gottschling, 2012). Vacuoles are acidic organelles that facilitate protein degradation, metabolic signaling, and metabolite compartmentation (Klionsky et al., 1990; Lawrence and Zoncu, 2019). Vacuolar function requires the Vacuolar-H+-ATPase (V-ATPase), a vacuole-membrane localized protein complex that acidifies vacuoles by generating a proton gradient across the vacuole membrane (Forgac, 2007). Our discovery that vacuole acidification is required to maintain mitochondrial health during aging is consistent with numerous prior and subsequent observations that vacuoles and mitochondria are physically and functionally linked across organisms (Dimmer et al., 2002; Elbaz-Alon et al., 2014; Honscher et al., 2014; Kim et al., 2013; Merz and Westermann, 2009; Ohya et al., 1991; Wong et al., 2019; Wong et al., 2018; Yambire et al., 2019), and that alterations in lysosome function are closely associated with mitochondrial decline in a number of age-related and metabolic disorders (Assali et al., 2018; Audano et al., 2018; Colacurcio and Nixon, 2016; de la Mata et al., 2016; Ferguson, 2015; Nixon et al., 2008; Plotegher and Duchen, 2017).
Despite the importance of the mitochondria-lysosome connection in aging and disease, it remains unclear how these two organelles are functionally linked, as well as what function of lysosomes prevents age-related mitochondrial deterioration. Here, we address these questions by showing that defects in vacuole-dependent amino acid compartmentation hamper mitochondrial respiration by limiting the intracellular bioavailability of iron, a critical component of the mitochondrial respiratory machinery. These results indicate that age-related mitochondrial deterioration is driven by amino acid-dependent iron limitation, and suggest that vacuoles promote mitochondrial health by limiting amino acid toxicity through subcellular compartmentation.
RESULTS
Iron supplementation restores mitochondrial function in V-ATPase-deficient cells
We and others previously found that vacuole acidification is required to maintain mitochondrial function and structure in budding yeast (Dimmer et al., 2002; Hughes and Gottschling, 2012; Merz and Westermann, 2009; Ohya et al., 1991). We confirmed these findings, and showed that yeast lacking V-ATPase components (vma1Δ and vph2Δ) (Hirata et al., 1990; Jackson and Stevens, 1997) or treated with the V-ATPase inhibitor concanamycin A (concA) (Drose et al., 1993) grew efficiently on fermentable carbon sources, but failed to grow on media containing glycerol as a carbon source, which requires mitochondrial respiration (Figures 1A and 1B). Likewise, acute ablation of vacuole acidification with concA caused fragmentation and aggregation of the tubular mitochondrial network, and depleted the energetic potential across the mitochondrial inner membrane (Figures 1C–F, S1A, S1B, and supplemental movies 1 and 2).
Figure 1. Iron Supplementation Restores Mitochondrial Function in V-ATPase Deficient Cells.
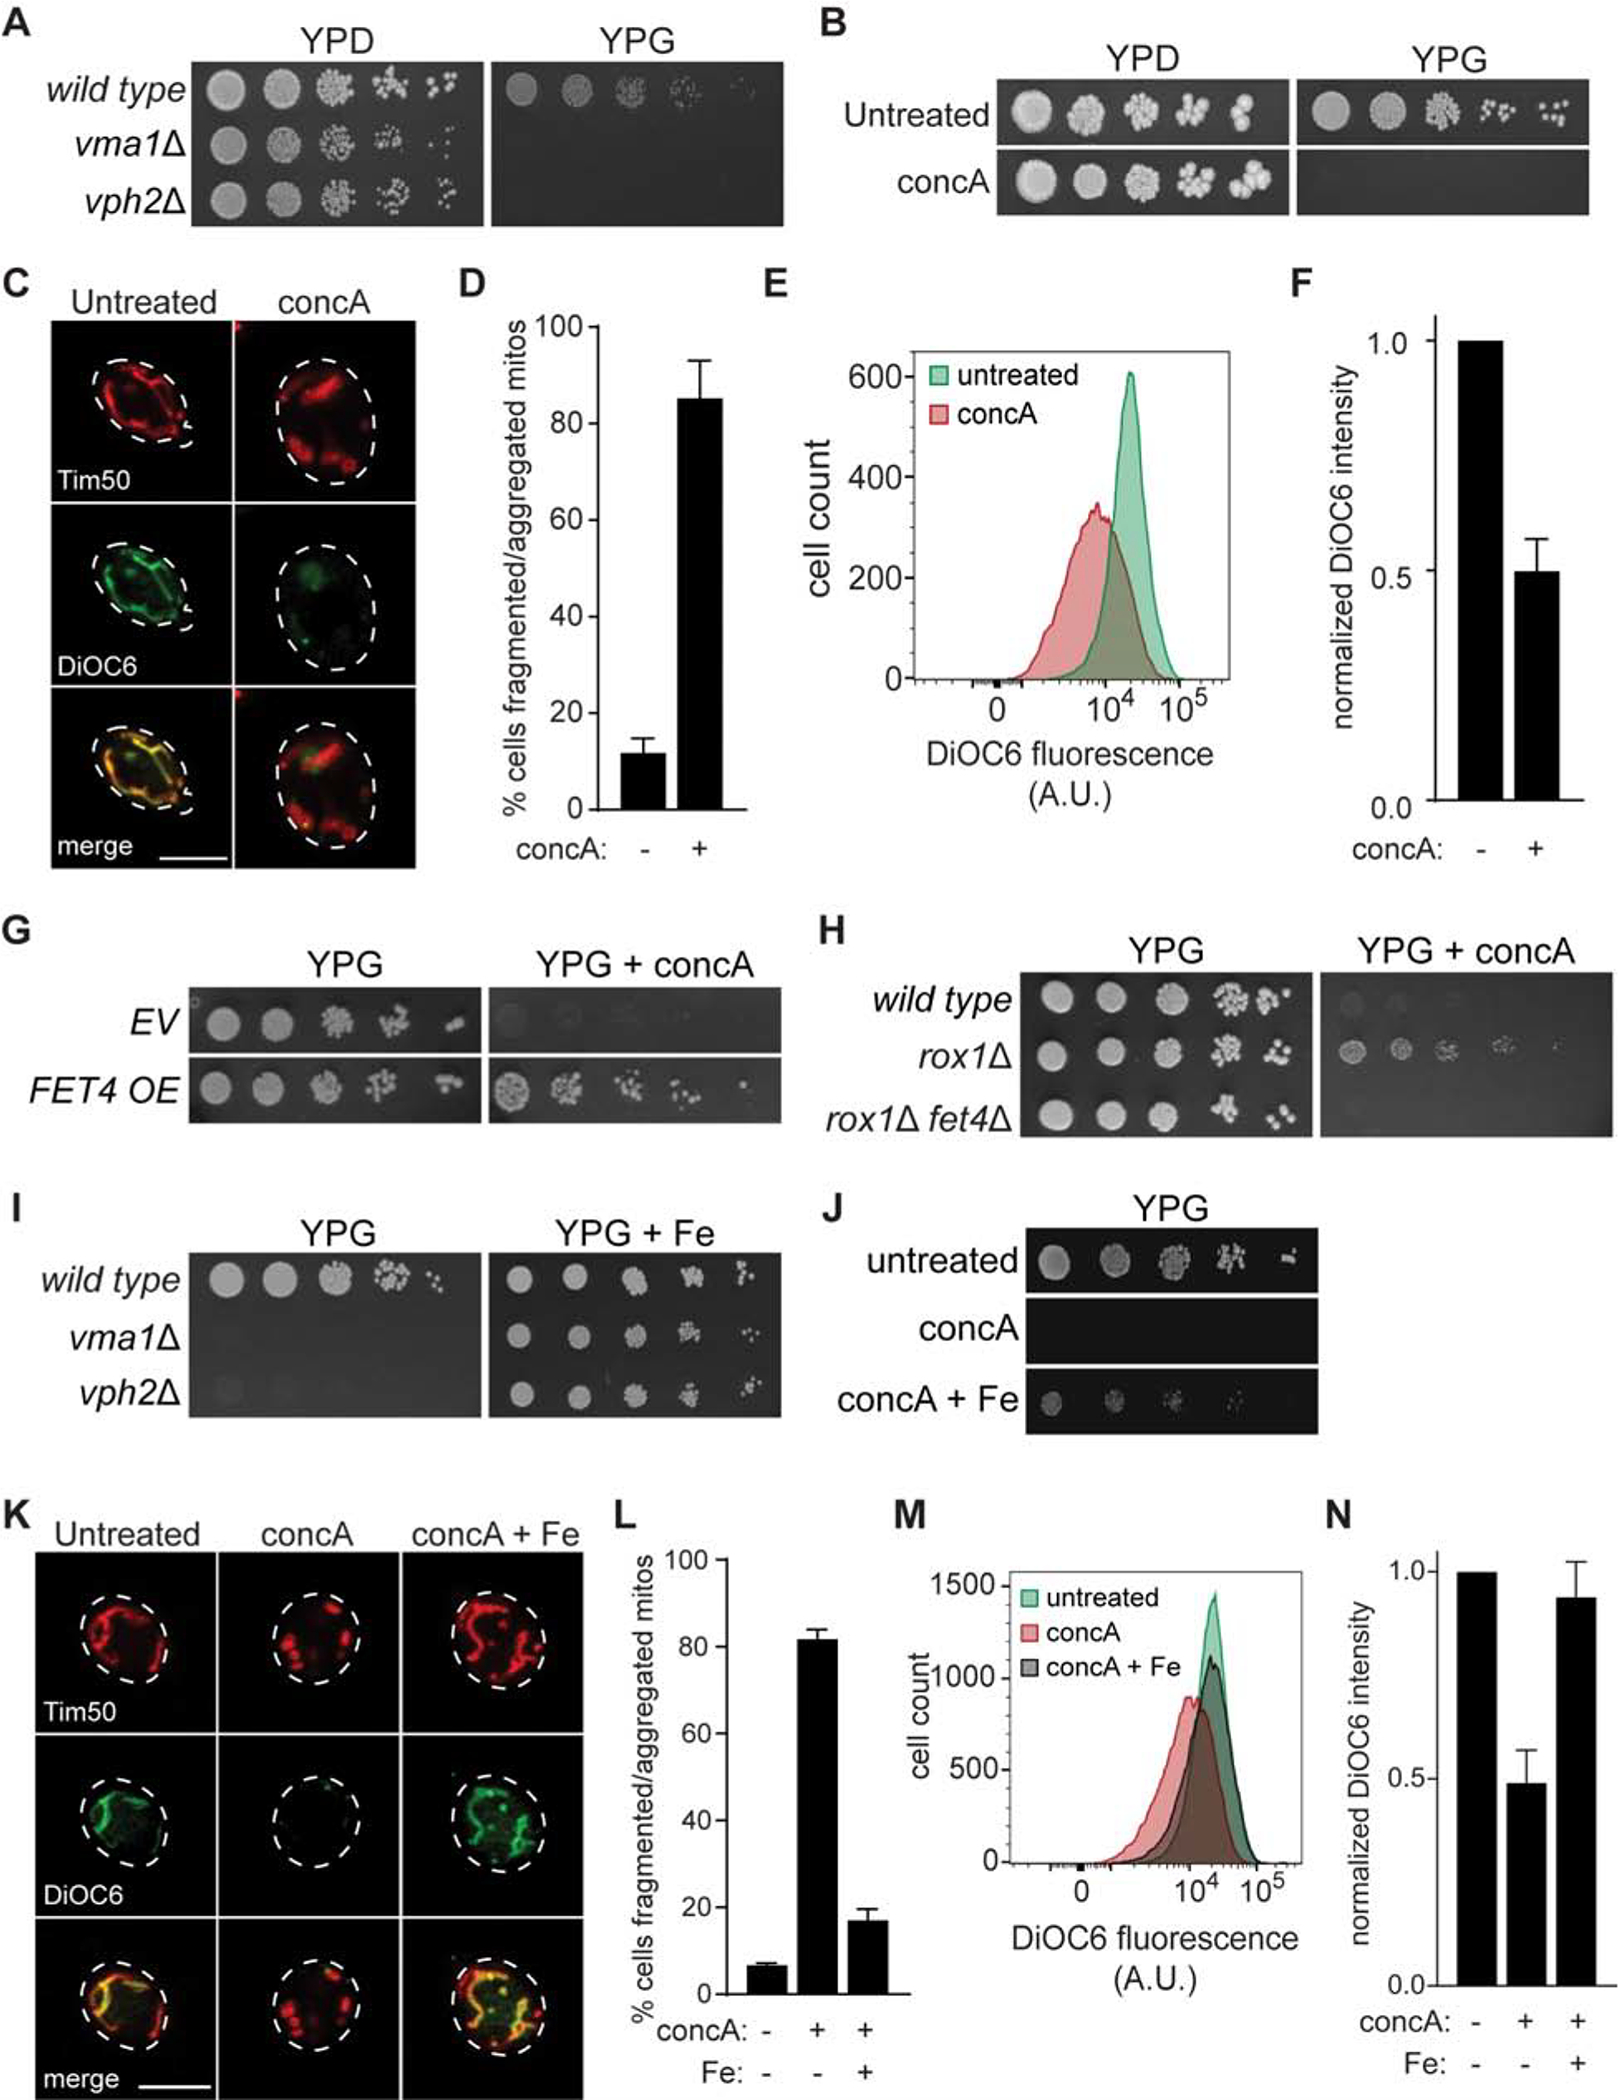
(A–B) Serial growth assays of the indicated yeast (A) on rich medium with glucose (YPD) or glycerol (YPG) as the carbon source +/− V-ATPase inhibitor concA (B). (C) Maximum-intensity projection images of yeast mitochondrial structure (Tim50-mCherry) and membrane potential (DiOC6 staining) in cells grown +/− concA for 4 hrs. Scale bar = 5 μm.
(D) Quantification of (C). Bars = mean ± SD, n=3. >100 cells per replicate.
(E) Flow cytometry analysis of DiOC6 stained yeast grown +/− concA for 4 hrs. A.U. = arbitrary units in all Figures.
(F) Quantification of (E). Median fluorescence values normalized to untreated. Bars = mean ± SD, n=3.
(G) Growth assays of yeast containing empty vector (EV) or a high-copy FET4 expression plasmid on YPG +/− concA.
(H) Growth assays of the indicated yeast on YPG +/− concA.
(I–J) Growth assays of the indicated yeast (I) on YPG +/− ferrous ammonium sulfate (Fe) +/− concA (J).
(K) Images obtained as in (C) from yeast grown +/− concA +/− Fe for 4 hrs. Scale bar = 5 μm.
(L) Quantification of (K). Bars = mean ± SD (n=3). >100 cells per replicate.
(M) Flow cytometry analysis of DiOC6 stained yeast grown +/− concA +/− Fe for 4 hrs.
(N) Quantification of (M). Median fluorescence values normalized to untreated. Bars = mean ± SD, n=3.
See also Figure S1
To dissect the functional connection between vacuoles and mitochondria, we utilized a high-copy plasmid genomic DNA library (Jones et al., 2008) to identify suppressors of the non-fermentable carbon source growth defect of V-ATPase deficient cells. Our screen uncovered a single high-copy suppressor, FET4, that permitted growth on glycerol in the presence of V-ATPase inhibition (Figure 1G). In parallel, we screened the yeast non-essential gene deletion collection (Giaever et al., 2002; Winzeler et al., 1999) and found that deletion of ROX1, a transcriptional repressor of FET4 (Jensen and Culotta, 2002; Waters and Eide, 2002), suppressed the respiratory-deficient phenotype of V-ATPase impaired cells (Figure 1H). Enhanced mitochondrial function in V-ATPase-deficient rox1Δ cells required FET4, suggesting that ROX1 deletion restores mitochondrial respiration in V-ATPase deficient cells by elevating FET4 expression (Figure 1H).
Fet4 is a plasma-membrane embedded metal permease that facilitates low-affinity iron uptake in budding yeast (Dix et al., 1994). Like FET4 overexpression, iron supplementation with exogenous ferrous ammonium sulfate restored growth of V-ATPase deficient cells on respiratory-based carbon sources (Figures 1I and 1J). Iron supplementation also suppressed mitochondrial morphology and membrane potential defects caused by acute V-ATPase inhibition (Figures 1K–N, S1C, and supplemental movie 3). Thus, genetic or pharmacologic iron supplementation restores mitochondrial health in V-ATPase-deficient cells.
Iron starvation underlies mitochondrial dysfunction in V-ATPase deficient cells
Based on our above findings that iron supplementation restores mitochondrial function in V-ATPase depleted cells and previous observations that V-ATPase inhibition causes iron starvation (Diab and Kane, 2013), we wondered whether iron limitation causes mitochondrial dysfunction upon V-ATPase deficiency. To test this, we first evaluated the impact of V-ATPase inhibition on cellular iron metabolism by monitoring activation of the Aft1-dependent iron transcriptional regulon in V-ATPase inhibited cells. Aft1 is a transcription factor that localizes to the nucleus upon iron deprivation and remodels iron metabolism through the induction of a set of genes known as the iron regulon (Chen et al., 2004; Rutherford et al., 2005; Yamaguchi-Iwai et al., 1995). Consistent with previous observations (Diab and Kane, 2013), cytoplasmic Aft1-GFP concentrated in the nucleus shortly after V-ATPase inhibition in an iron-dependent manner (Figures 2A and 2B). Aft1 nuclear translocation occurred within 30 minutes of V-ATPase impairment, similar to effects caused by the iron chelator bathophenanthroline disulphonate (BPS) (Cowart et al., 1993) (Figure S2A). Quantitative PCR (qPCR) analysis showed that Aft1 nuclear localization correlated with robust induction of iron regulon transcripts in an Aft1-dependent manner (Figure 2C).
Figure 2. V-ATPase Inhibition Causes Iron limitation and Impairs Mitochondrial Respiration.
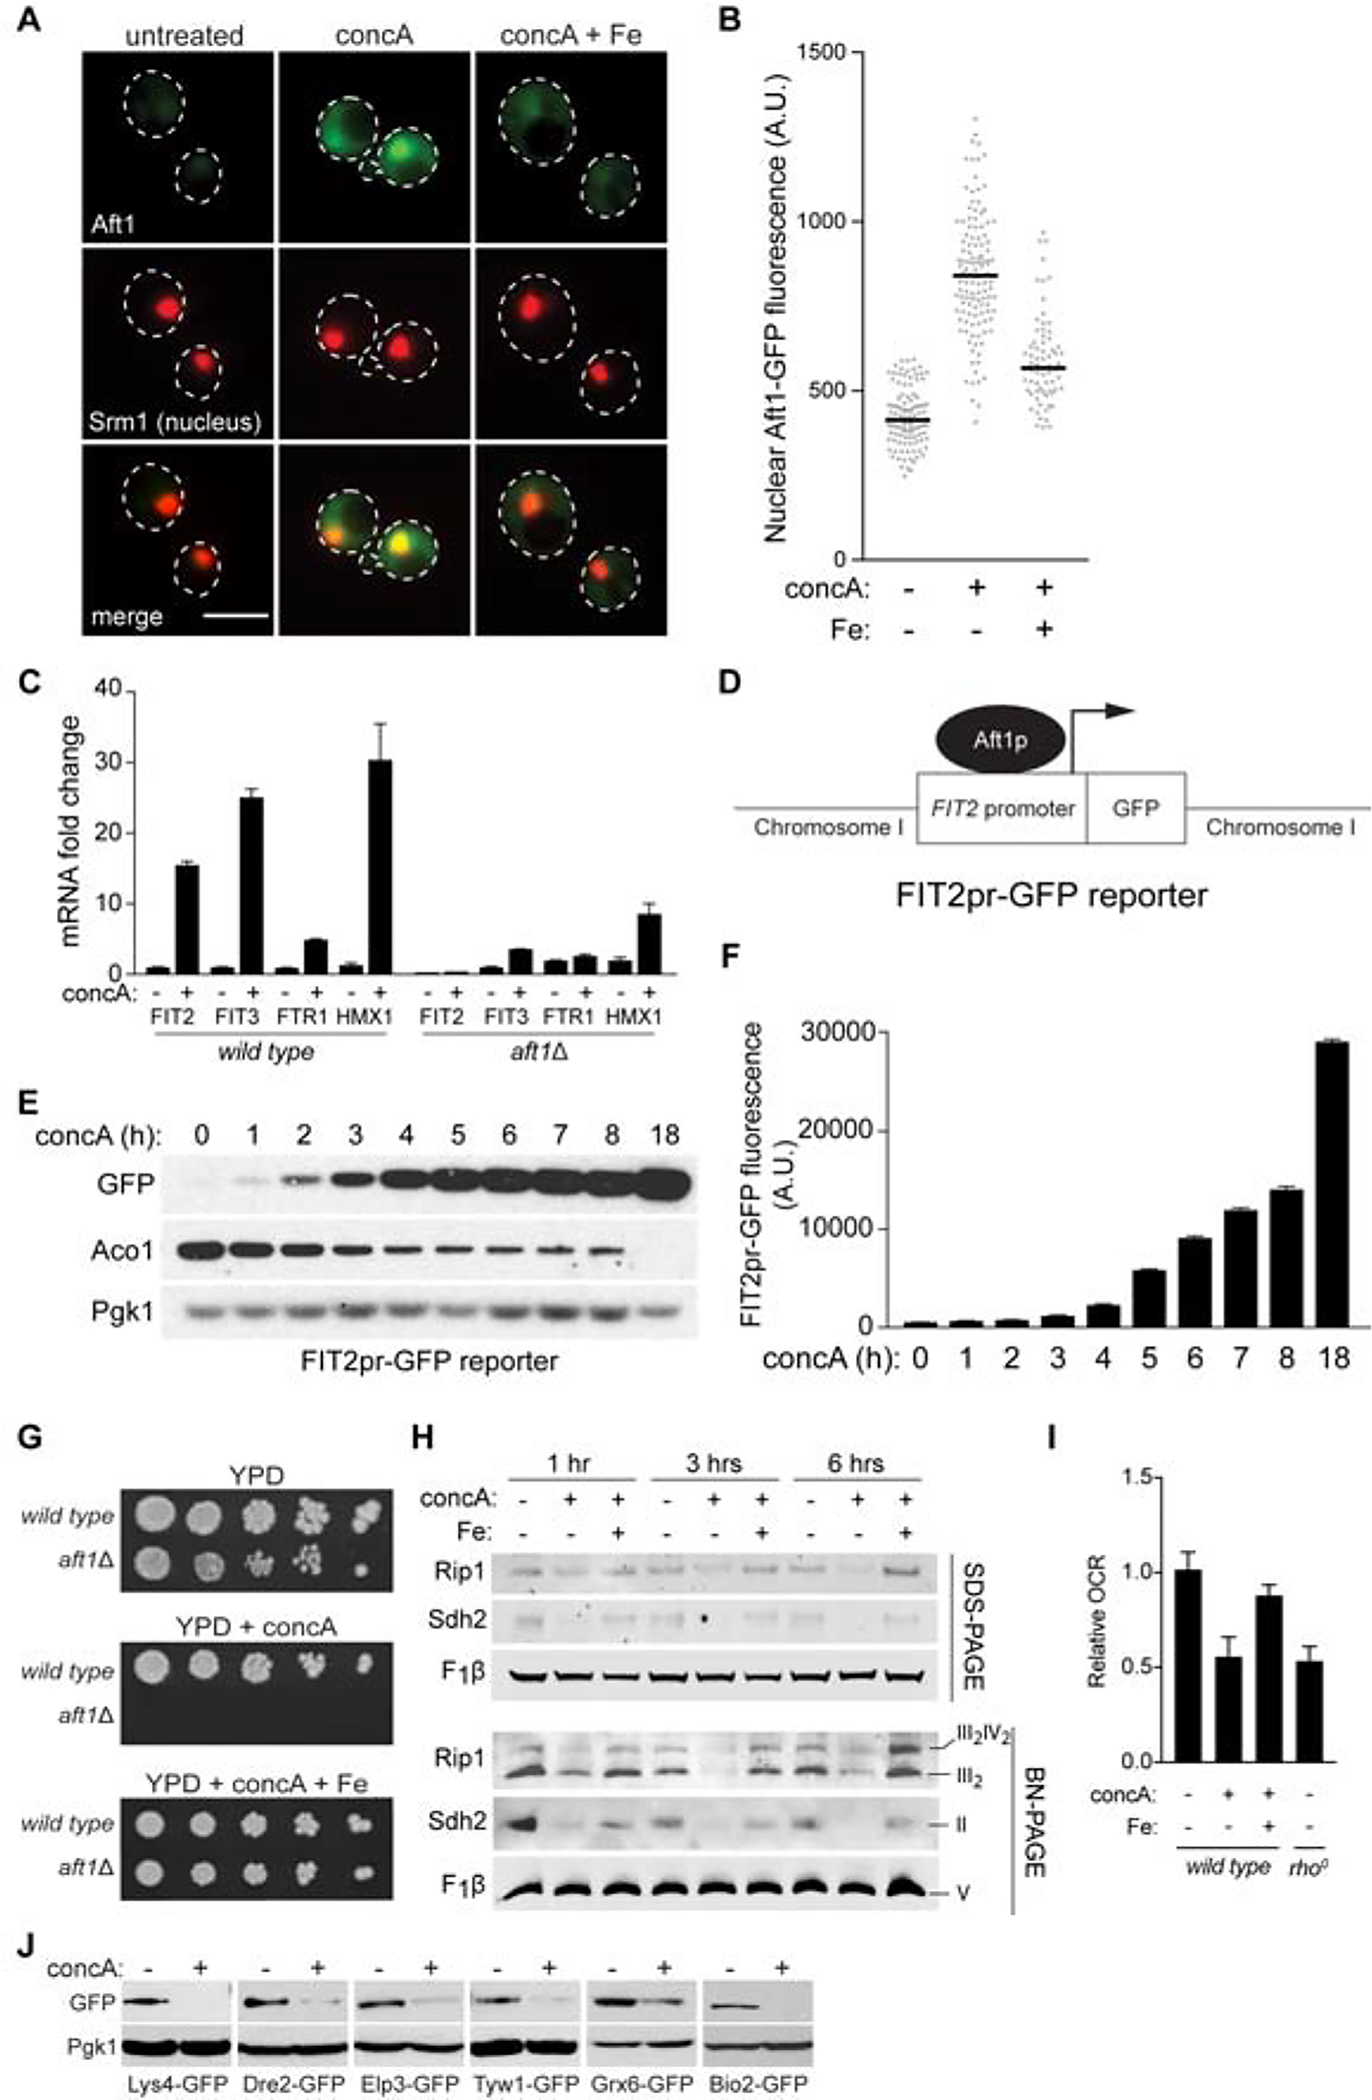
(A) Single Z-plane images showing Aft1-GFP nuclear translocation after 4 hrs concA treatment +/− Fe. Srm1-mCherry marks the nucleus. Scale bar = 5 μm.
(B) Quantification of nuclear fluorescence intensity from individual cells in (A). Bars = median. n >70 cells.
(C) qPCR showing fold change of the indicated Aft1 target genes after 6 hrs of concA treatment in wild type and aft1Δ strains. Values expressed relative to wild type DMSO treated. Bars = mean ± SD, n=3.
(D) Schematic of the Aft1 transcriptional reporter.
(E) Western blot of GFP driven from the FIT2 promoter and Aco1 during an 18-hour concA time course. Loading control, Pgk1.
(F) Flow cytometry analysis showing GFP expression from the FIT2 promoter increases in cells during 18 hours of concA treatment. Bars = mean ± SD, n=3.
(G) Growth assays of wild-type and aft1Δ yeast on YPD +/− concA +/− Fe.
(H) Steady-state levels of the indicated individual proteins (SDS-PAGE) and representative assembled respiratory complexes [Blue-Native (BN) PAGE] analyzed via Western blotting of crude mitochondrial fractions isolated from yeast treated with concA and Fe for 0–6 hrs. Rip1, Complex III; Sdh2, Complex II; F1β, Complex V.
(I) Relative oxygen consumption rate (OCR) of wild-type yeast grown −/+ concA −/+ Fe for 6 hrs and rho0 cells lacking mitochondrial DNA. Bars = mean ± SD, n=3.
(J) Western blot showing protein levels of GFP-epitope tagged ISC-containing proteins from various cellular compartments are reduced after 4 hrs concA treatment. Mitochondria, Lys4 and Bio2; cytoplasm, Dre2; nucleus, Elp3; ER, Tyw1 and Grx6; loading control, Pgk1.
See also Figure S2
To further investigate the connection between vacuole impairment and iron homeostasis, we generated a quantitative Aft1 transcriptional reporter comprised of the Aft1-responsive FIT2 promoter (FIT2pr) driving expression of GFP, integrated into an empty region of chromosome I (Figure 2D). Aft1-dependent GFP expression was robustly activated by pharmacological or genetic V-ATPase impairment, as monitored by western blot and flow cytometry (Figures 2E, 2F, S2B, and S2C). FIT2pr-based GFP expression was induced similarly by V-ATPase inhibition and complete extracellular iron chelation with BPS, was dependent on Aft1, and was suppressed by FET4 overexpression or supplementation with either ferric (Fe3+) or ferrous (Fe2+) iron (Figures S2D–G). Furthermore, loss of AFT1 was lethal in V-ATPase deficient cells, and growth was restored by iron supplementation (Figure 2G). A similar synergistic, iron-dependent lethality was observed between concA and the iron chelator BPS (Figure S2H). These results confirm that loss of V-ATPase activity limits cellular iron and activates the iron regulon, the latter of which is essential for growth in the absence of a functioning vacuole.
We next examined the connection between iron limitation and mitochondrial dysfunction in V-ATPase deficient cells. Aft1 senses intracellular iron by monitoring levels of iron-sulfur clusters (ISCs) (Chen et al., 2004; Rutherford et al., 2005). ISCs are generated from iron and cysteine in the mitochondria and are essential cofactors for proteins in mitochondrial respiration and other cellular activities (Braymer and Lill, 2017). Loss of ISCs impairs the activity and stability of ISC-containing proteins. Because of the connection between Aft1 and ISCs, we wondered if ISC containing enzymes were impacted by V-ATPase inhibition. Indeed, levels of aconitase (Aco1), a mitochondrial-localized ISC protein in the TCA cycle (Gangloff et al., 1990), declined upon V-ATPase inhibition with kinetics that paralleled activation of the iron regulon (Figure 2E). Similarly, Sdh2 and Rip1, ISC proteins in mitochondrial respiratory chain complexes II and III, respectively (Cui et al., 2012; Van Vranken et al., 2015), both declined upon V-ATPase inhibition, but not in the presence of excess iron (Figure 2H).
Paralleling the changes in these individual iron-containing respiratory chain proteins, Blue-Native PAGE (BN-PAGE) analysis indicated that assembled respiratory complexes II and III decreased with acute V-ATPase inhibition in an iron-dependent manner, while the level of non-iron containing complex V was unaffected (Figure 2H). Consistent with these observations, cellular oxygen consumption was reduced after acute V-ATPase impairment to levels present in strains lacking mitochondrial DNA (and thus respiration), and restored with iron supplementation (Figure 2I). Moreover, ISCs outside of mitochondria were also impacted by vacuole impairment, as steady-state levels of GFP-tagged ISC-containing proteins localized to the endoplasmic reticulum (ER), cytosol, and nucleus all decreased upon V-ATPase inhibition (Figure 2J). Analysis of the turnover kinetics of two ISC-containing proteins, Lys4 and Twy1, using the Recombination Induced Tag Exchange (RITE) system (Verzijlbergen et al., 2010), revealed increased turnover upon V-ATPase inhibition (Figure S2I). Thus, V-ATPase loss impairs mitochondrial function by limiting cellular iron, which hampers ISC-protein stability, depletes iron-containing respiratory chain complexes, and impairs mitochondrial respiration.
Perturbed amino acid homeostasis limits iron bioavailability upon V-ATPase impairment
We sought to identify the V-ATPase-dependent cellular function that maintains iron homeostasis and mitochondrial respiration. V-ATPase activity is required for cellular iron uptake through the Fet3 high-affinity iron uptake system (Davis-Kaplan et al., 1998; Davis-Kaplan et al., 2004), protein degradation through autophagy and the multivesicular body (MVB) pathway (Feng et al., 2014; Henne et al., 2011), and the compartmentation of amino acids and ions in the vacuole lumen via proton-dependent import (Kitamoto et al., 1988; Klionsky et al., 1990; Wiemken and Dürr, 1974). We investigated whether disruption of any of these three activities caused iron limitation in V-ATPase deficient cells. We ruled out alterations in cellular iron uptake as a possibility because total intracellular iron levels did not decline upon V-ATPase impairment as measured by inductively coupled plasma mass spectrometry (ICP-MS) (Figures S3A and S3B). In fact, intracellular iron levels increased upon acute V-ATPase inhibition, and were chronically elevated in V-ATPase mutants, despite activation of the iron regulon under these conditions (Figures S3A and S3B). Interestingly, although total intracellular iron increased in V-ATPase deficient cells, subcellular fractionation indicated that mitochondrial iron content actually declined upon V-ATPase inhibition (Figure S3C and S3D). However, attempts to restore mitochondrial function in V-ATPase mutants by overexpression of mitochondrial iron importers Mrs3 and Mrs4 were unsuccessful (Figure S3E), suggesting that the excess iron in V-ATPase cells is not bioavailable.
We next considered whether altered autophagy limited iron bioavailability in V-ATPase deficient cells. Deletion of ATG5, which is essential for autophagy (Feng et al., 2014), or PEP4, a master vacuolar protease (Jones et al., 1982), did not trigger activation of the Aft1-dependent iron regulon, indicating altered protein degradation did not cause iron starvation upon V-ATPase impairment (Figure S3F). Therefore, we investigated whether altered vacuolar nutrient compartmentation limited iron bioavailability in V-ATPase deficient cells. As depicted in Figure 3A, vacuoles serve as reservoirs for amino acids in yeast (Kitamoto et al., 1988; Klionsky et al., 1990; Wiemken and Dürr, 1974). Amino acid transport into vacuoles is driven by membrane-bound transporters of the AVT and VBA families, which harness the V-ATPase proton gradient to import neutral and basic amino acids into the vacuole lumen, limiting their cytoplasmic levels (Russnak et al., 2001; Shimazu et al., 2005). We previously showed that age-associated mitochondrial dysfunction, which is triggered by loss of vacuole acidity, is suppressed by overexpression of AVT1, a V-ATPase-dependent vacuolar neutral amino acid importer (Hughes and Gottschling, 2012; Tone et al., 2015). This result and our current observations suggest that loss of vacuolar amino acid compartmentation causes increased non-vacuolar amino acid pools, which in turn may limit the bioavailability of intracellular iron and cause mitochondrial impairment.
Figure 3. V-ATPase Inhibition Perturbs Amino Acid Homoeostasis.
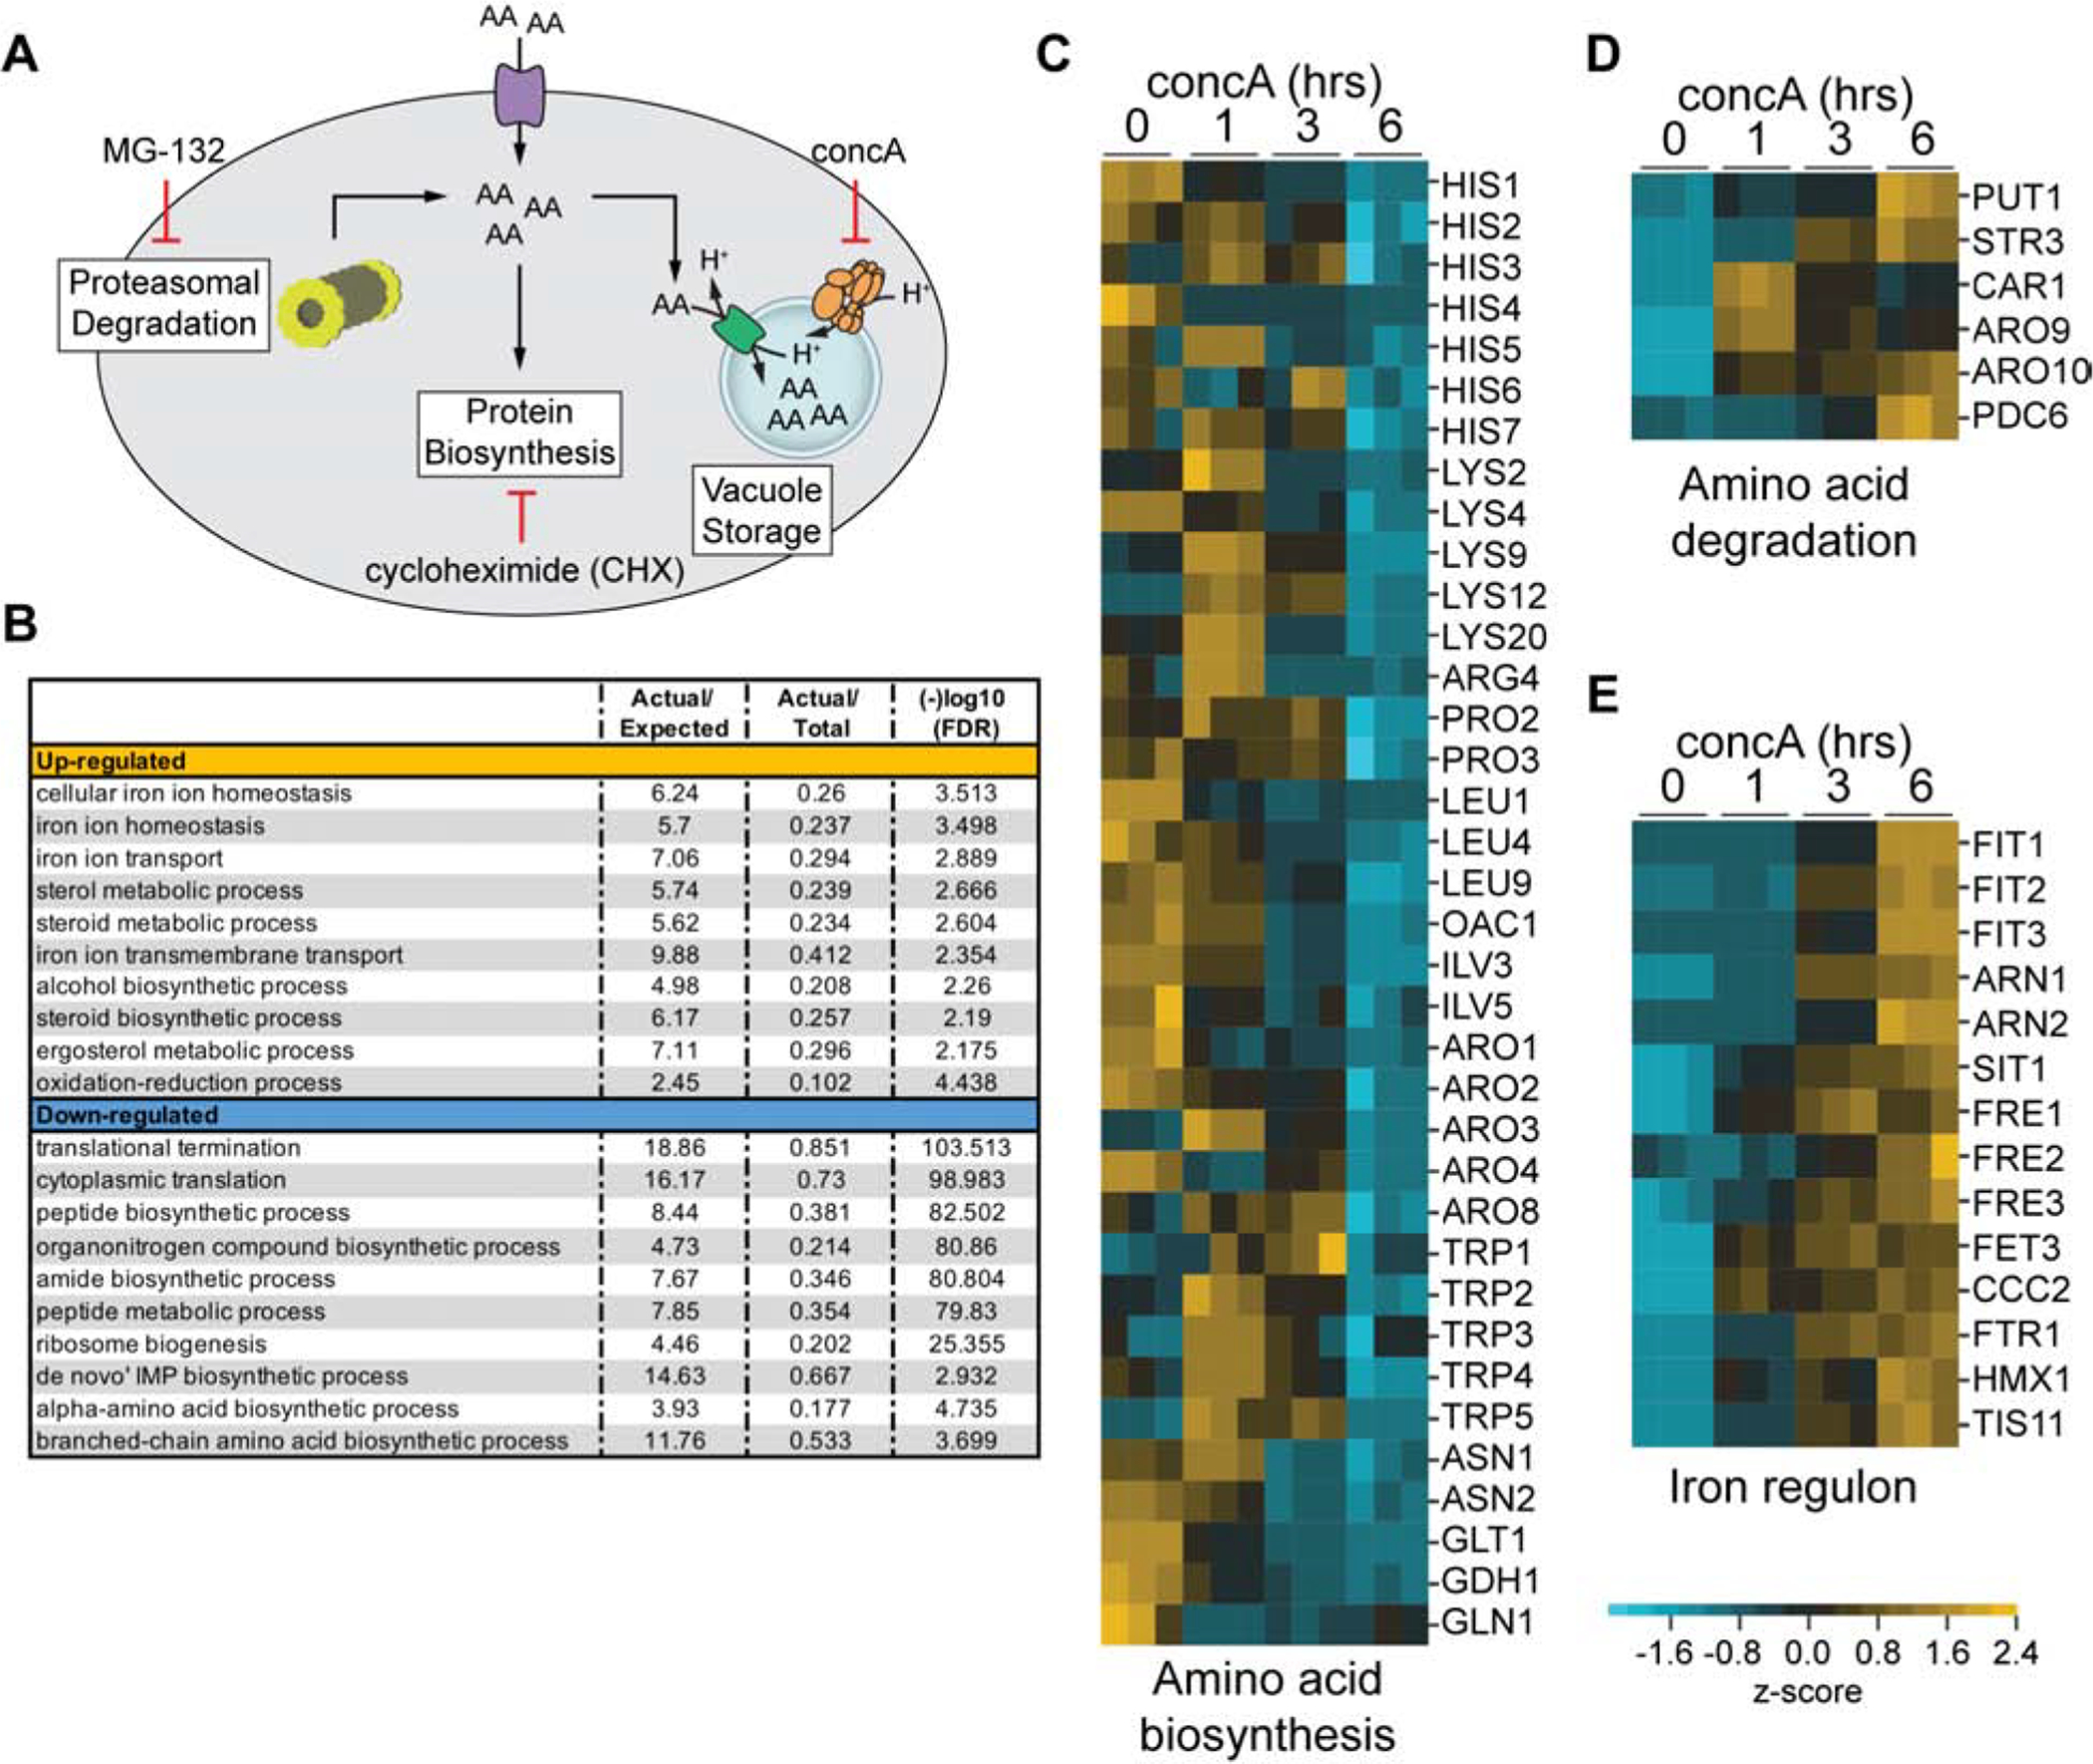
(A) Major sources and fates of intracellular amino acids, along with chemical interventions (CHX, MG-132, and concA) that alter amino acid pools.
(B) GO biological processes enriched in RNA sequencing data after 6 hrs of concA treatment. Actual/Expected = # genes observed versus # expected from category. Actual/Total = # of genes represented from category. FDR = false discovery rate.
(C–E) Heat maps showing Z-scores of transcripts from RNA sequencing analysis conducted on yeast treated with concA for the indicated time. Blue = downregulated, yellow = upregulated. Maps organized by indicated gene functions. See also Figure S3 and Table S1
Consistent with this idea, RNA-seq analysis indicated that acute V-ATPase inhibition triggered a transcriptional response indicative of perturbed intracellular amino acid homeostasis. Specifically, transcripts of genes involved in amino acid biosynthesis were downregulated upon acute V-ATPase impairment, whereas genes involved in the breakdown of amino acids, specifically components of the Ehrlich pathway (Hazelwood et al., 2008), as well as arginine, proline, and cysteine catabolism, were upregulated (Ljungdahl and Daignan-Fornier, 2012) (Figures 3B–D, Table S1). These changes, combined with the observation that V-ATPase impairment did not alter whole cell steady-state levels of amino acids (Figure S4A), strongly suggest that impairment of V-ATPase-driven vacuolar amino acid import alters intracellular amino acid distribution, resulting in cytoplasmic amino acid elevation. These perturbations in amino acid homeostasis occurred simultaneously with upregulation of the Aft1-dependent iron regulon (Figure 3E), indicating that V-ATPase inhibition causes acute amino acid stress concurrently with the deregulation of iron homoeostasis.
To directly test the hypothesis that elevated non-vacuolar amino acids impair iron homeostasis, we analyzed activation of the iron regulon upon V-ATPase impairment in amino acid limited medium. We found that concA-induced iron limitation was blunted in low amino acid medium and restored with peptone, a source of amino acids (Figure 4A). Removal of all amino acids from the medium further suppressed activation of the iron regulon in V-ATPase-deficient cells, and prevented loss of the ISC protein Aco1 (Figure 4B). Moreover, the synthetic lethality between V-ATPase deficiency and loss of AFT1 was suppressed in low amino acid medium, and restored with peptone in an iron-dependent manner (Figure 4C). These changes in Aft1 activity between high and low amino acid medium were not caused by differences in iron content of the media, as low amino acid medium contained less iron than high amino acid medium as measured by ICP-MS (Figure S4B), and cells were more sensitive to the iron chelator BPS in low amino acid medium, as measured by activation of the iron regulon (Figure S4C). Additionally, the impact of amino acids on iron homeostasis occurred intracellularly. The Aft1 regulon was still activated when cells were pre-grown in high amino acid medium prior to treatment with concA in amino acid free medium (Figure 4D).
Figure 4. Elevated Non-Vacuolar Amino Acids Limit Iron Bioavailability and Mitochondrial Function Upon V-ATPase Deficiency.
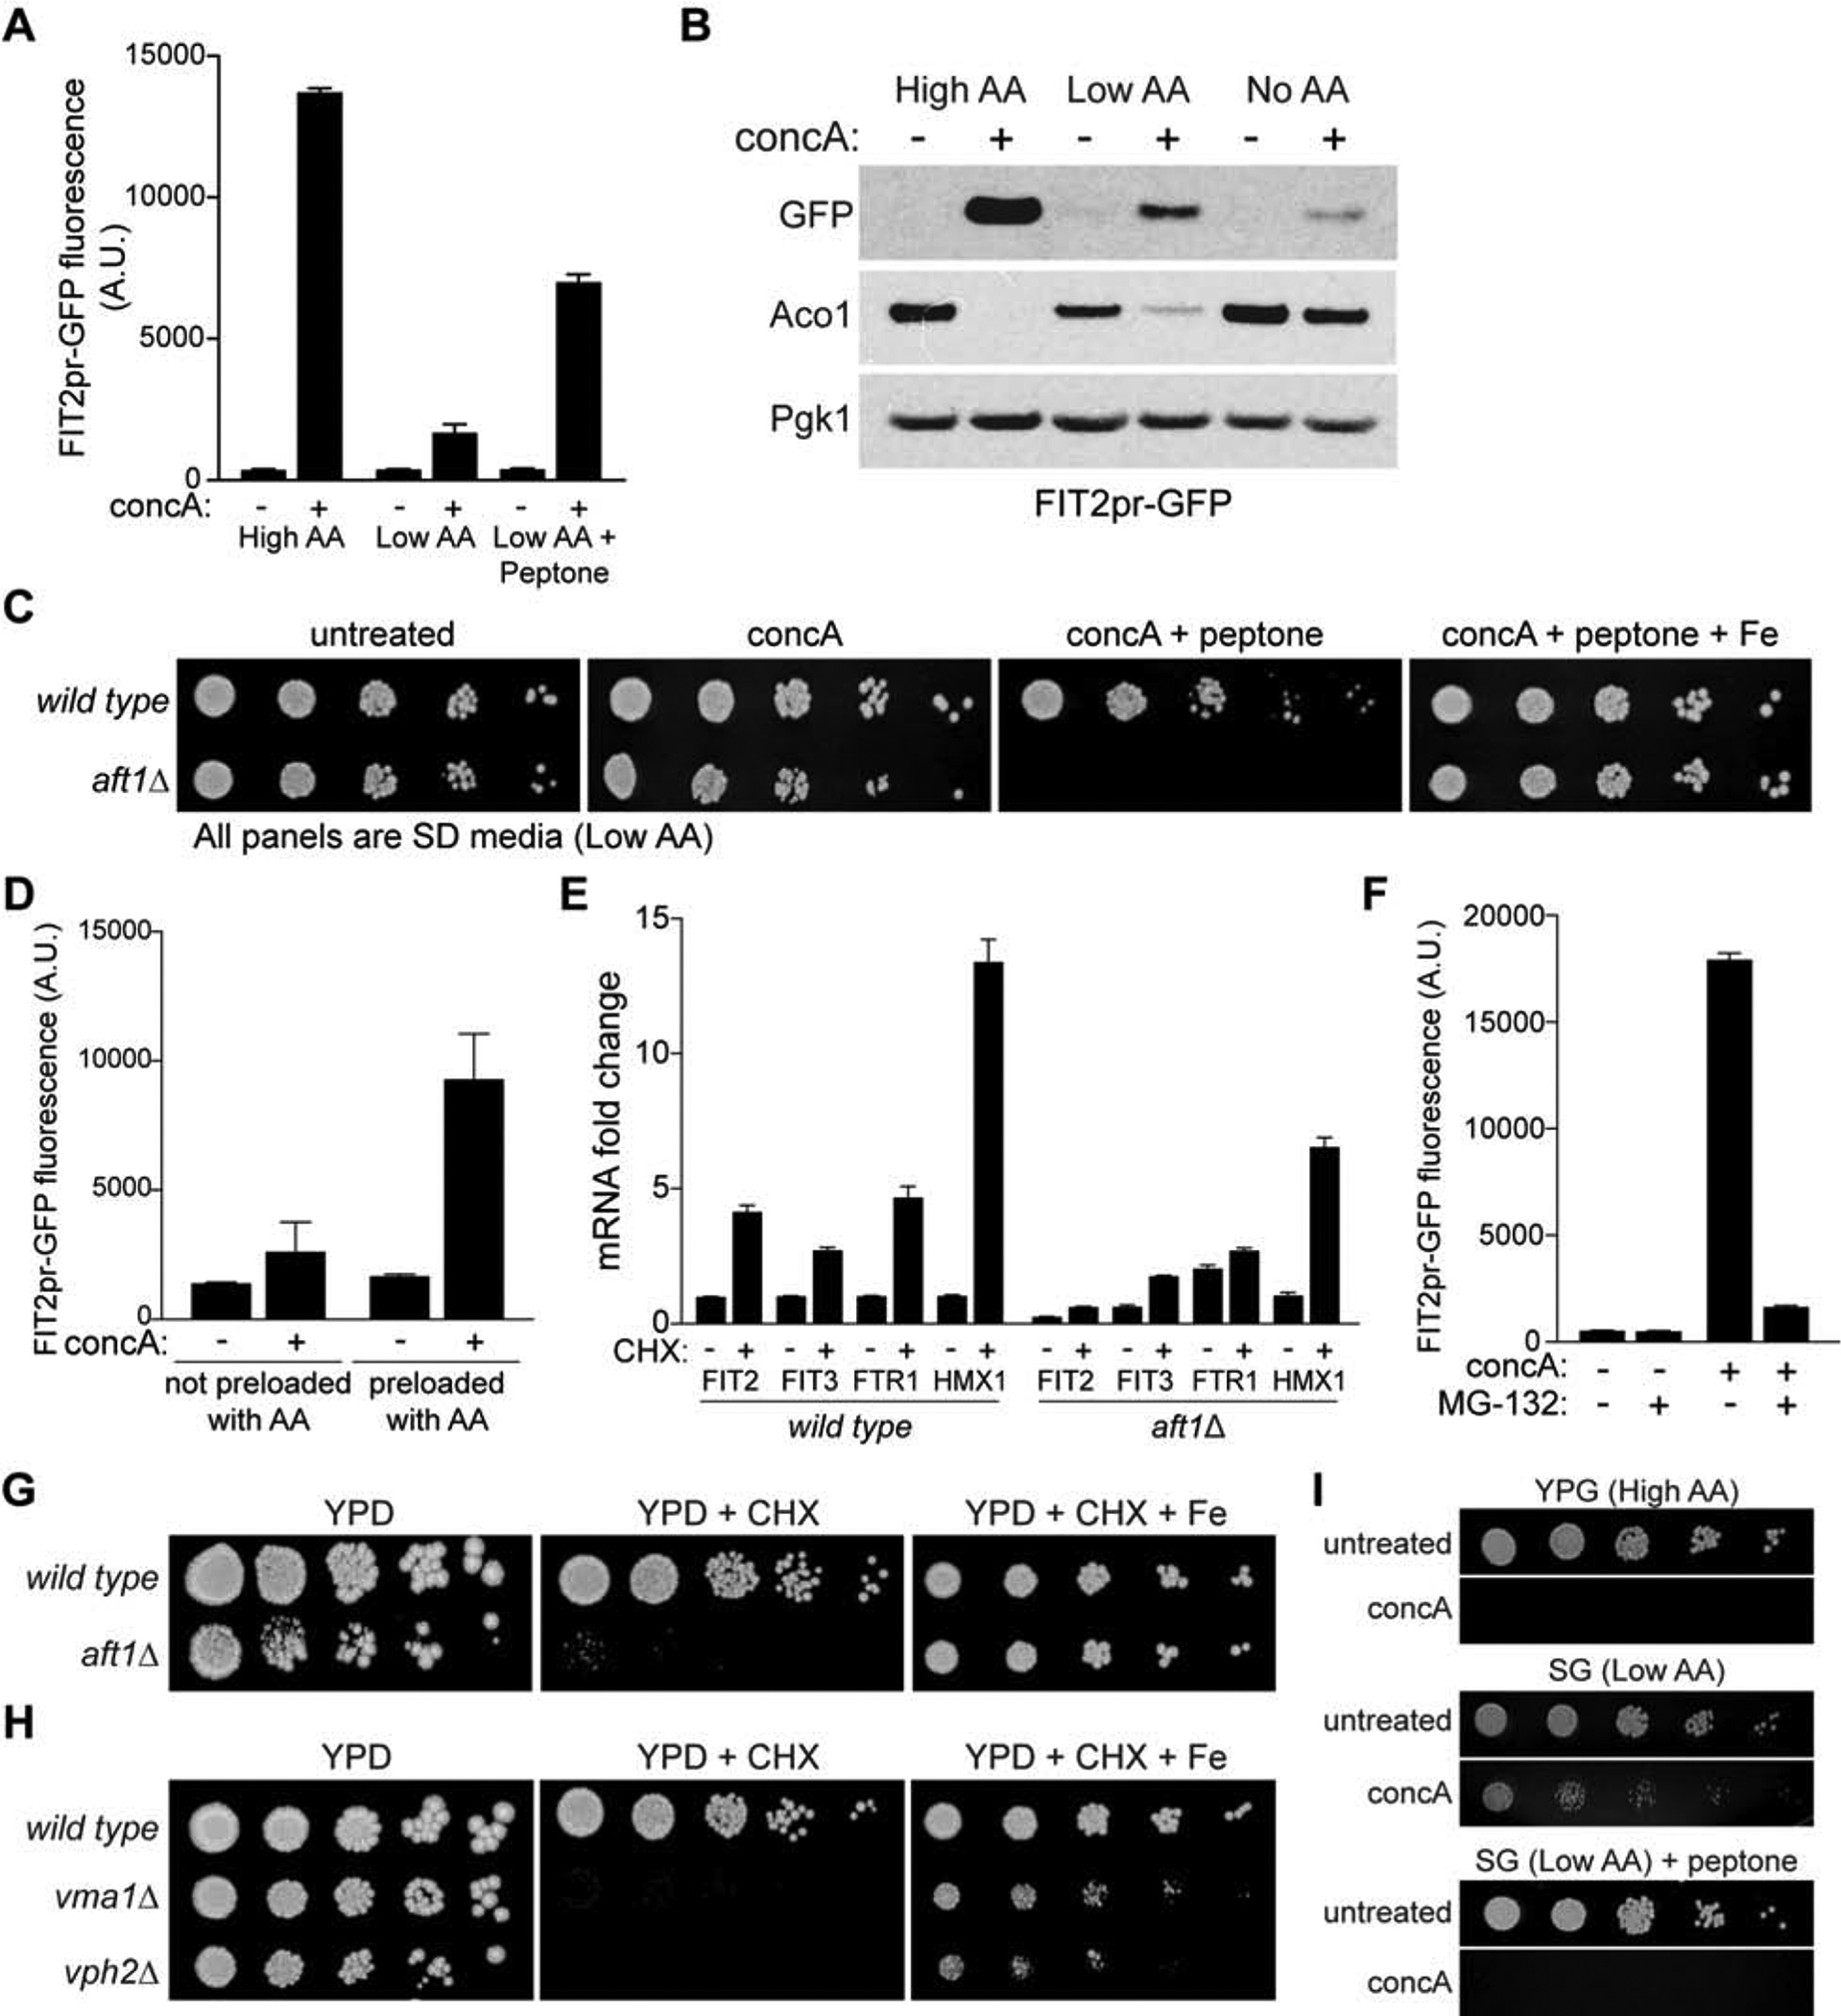
(A–B) Flow cytometry (A) or Western blot (B) analysis of FIT2pr-GFP expression and Aco1 protein levels in yeast cultured +/− concA for 6 hrs in the indicated medium. Bars = mean ± SD, n=3. Loading control, Pgk1.
(C) Growth assays of wild-type and aft1Δ yeast on low amino acid medium with the indicated additions.
(D) Flow cytometry analysis of FIT2pr-GFP fluorescence in yeast cultured +/− concA for 6 hrs in medium lacking AA after overnight growth in medium with no AA (not preloaded) or high AA (preloaded). Bars = mean ± SD, n=3.
(E) qPCR showing fold change of the indicated Aft1 target genes after 6 hrs of CHX treatment in wild-type and aft1Δ strains. Values expressed relative to wild type DMSO treated. Bars = mean ± SD, n=3.
(F) Flow cytometry analysis of FIT2pr-GFP fluorescence in pdr5Δ yeast cultured +/− concA +/− MG-132 for 6 hrs. Bars = mean ± SD, n=3.
(G) Growth assays of wild-type and aft1Δ yeast on YPD +/− 80 ng/ml CHX +/− Fe.
(H) Growth assays of wild type, vma1Δ, and vph2Δ strains on the indicated medium. [CHX] = 80 ng/ml.
(I) Growth assays of wild-type yeast on the indicated medium.
See also Figure S4
To further test whether elevated amino acids interfere with iron bioavailability, we monitored activation of the iron regulon in response to vacuole-independent perturbations in the cytoplasmic amino acid pool. Prior studies showed that cytoplasmic amino acid levels are tightly linked to protein translation and turnover rates. Specifically, inhibition of protein synthesis elevates cytoplasmic amino acids (Beugnet et al., 2003), and impairment of protein breakdown by proteasome inhibition depletes intracellular amino acids (Suraweera et al., 2012) (Figure 3A). Indeed, inhibition of protein translation with cycloheximide (CHX) activated the iron regulon (Figures S4D and 4E). Conversely, proteasome inhibition with MG-132 prevented induction of the iron regulon by V-ATPase inhibition (Figure 4F). We also found that AFT1 was essential for survival of CHX-treated cells in an iron-dependent manner, and that dual ablation of V-ATPase activity and protein translation caused iron-dependent synthetic lethality (Figures 4G and 4H). Finally, amino acid limitation restored mitochondrial function caused by V-ATPase inhibition (Figure 4I). These data suggest that high levels of non-vacuolar amino acids limit iron bioavailability and mitochondrial function in V-ATPase impaired cells.
Elevated non-vacuolar cysteine limits iron bioavailability in V-ATPase deficient cells
To identify which amino acid(s) disrupt iron homeostasis when V-ATPase function is compromised, we monitored activation of the iron regulon in V-ATPase impaired cells cultured in low amino acid medium supplemented individually with 1 mM of each proteogenic amino acid. We found that addition of cysteine, and to a lesser extent threonine, restored Aft1 activity to levels observed in high amino acid medium (Figure 5A). At concentrations higher than 1 mM, threonine-dependent induction of the iron regulon was enhanced (Figure S5A). Cysteine and threonine supplementation also re-induced respiratory growth defects caused by V-ATPase inhibition when added to low amino acid medium (Figure 5B). Remarkably, at concentrations higher than 1 mM, cysteine addition alone in the absence of vacuole impairment activated the iron regulon, impaired assembly of respiratory chain complexes, decreased oxygen consumption, and impaired cell growth in an iron-dependent manner (Figures 5C–F).
Figure 5. Cysteine Limits Iron Bioavailability and Mitochondrial Function Upon V-ATPase Deficiency.
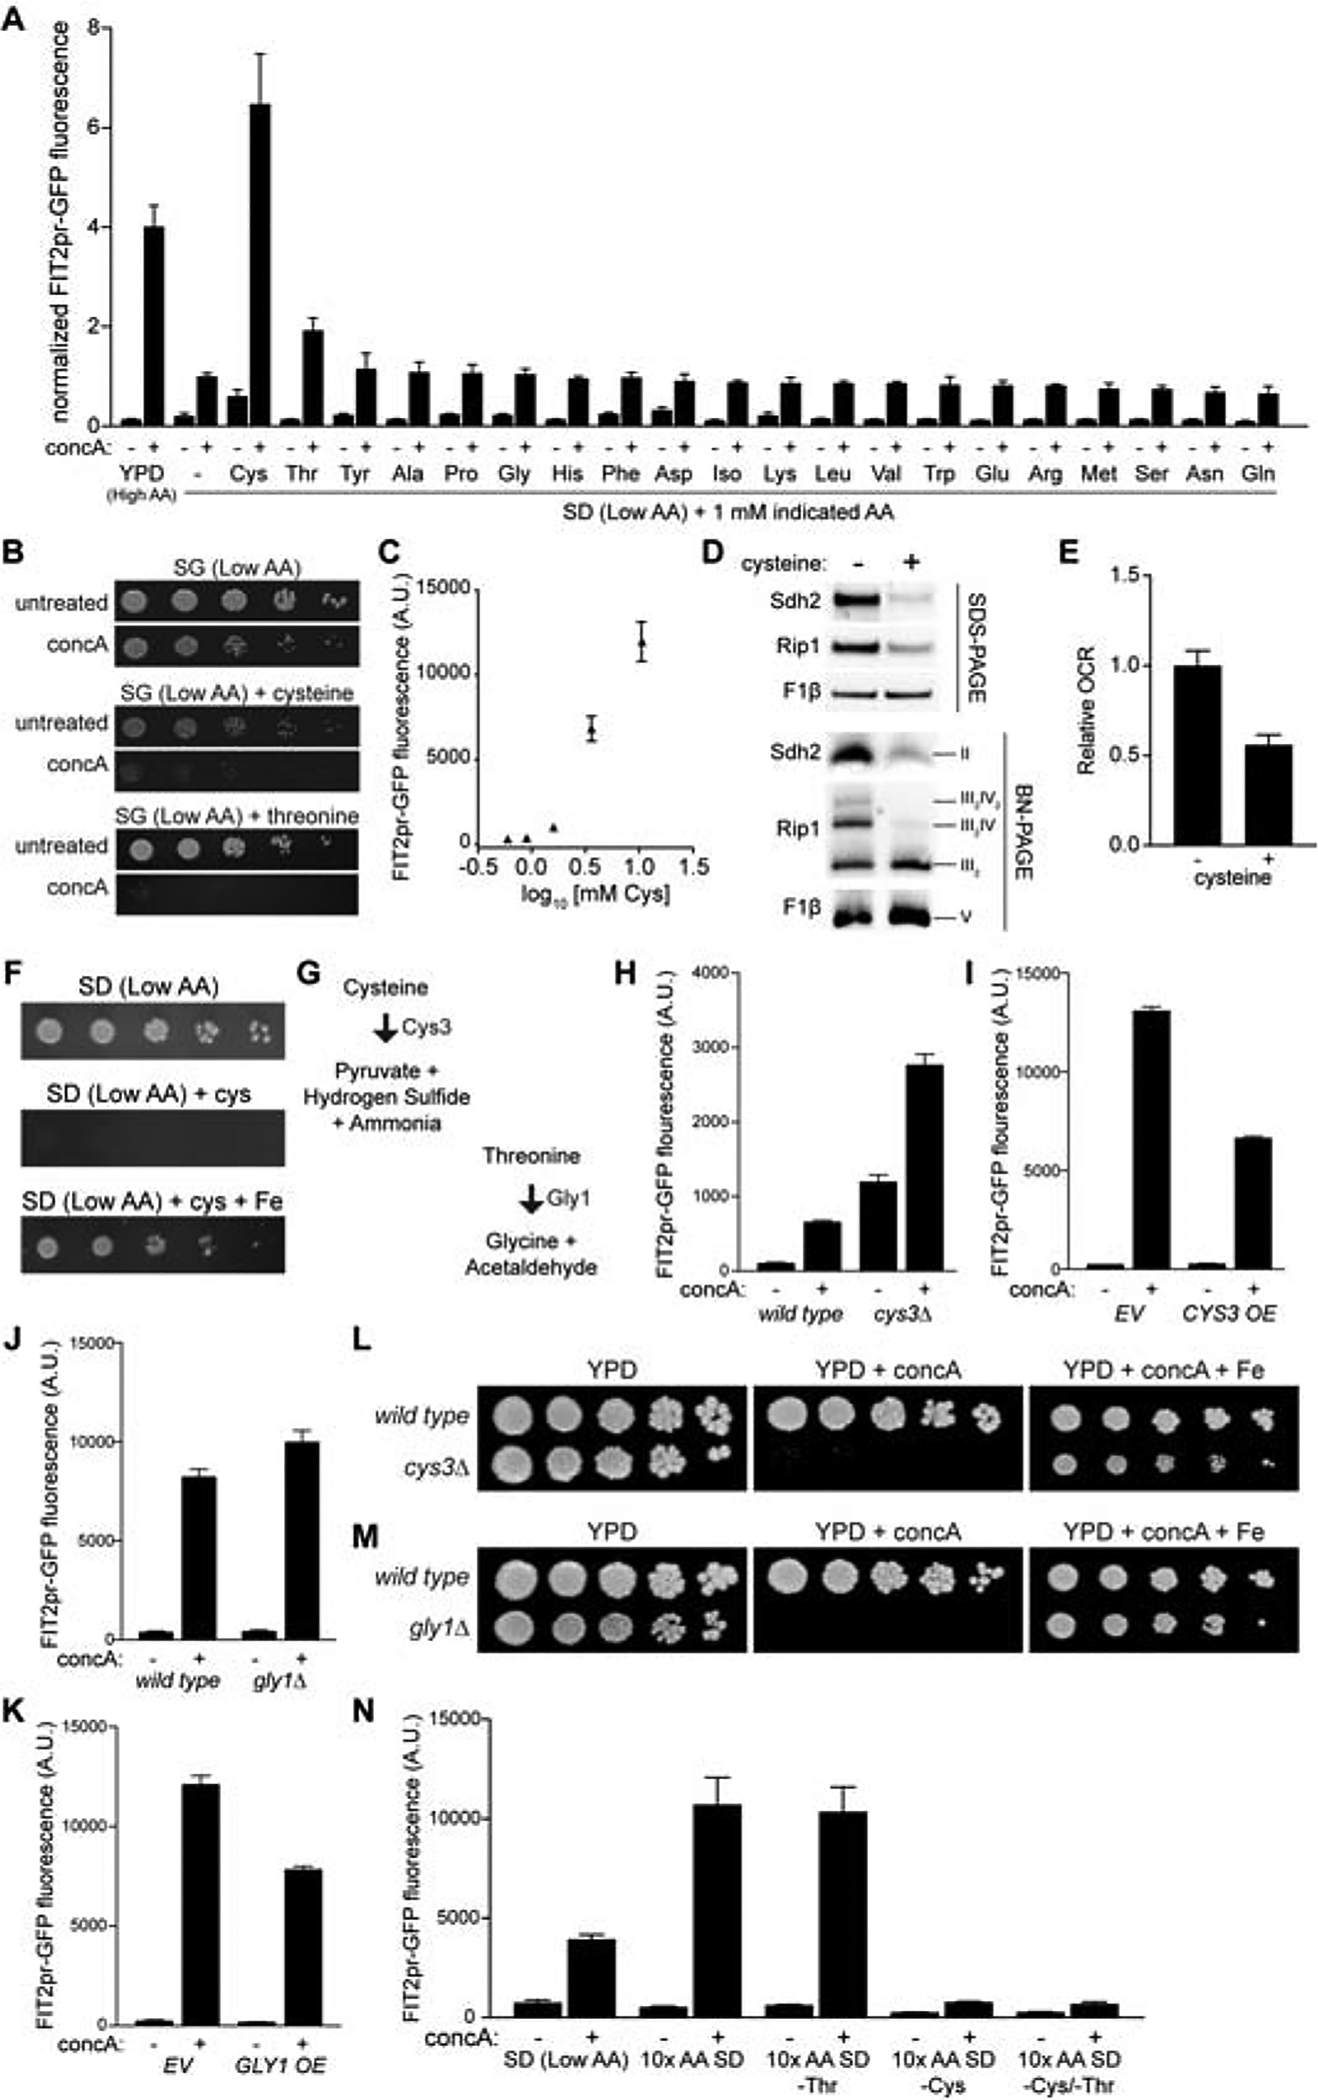
(A) Flow cytometry analysis of FIT2pr-GFP fluorescence in yeast cultured +/− concA for 6 hrs in the indicated medium. Values normalized to SD + concA. Bars = mean ± SD, n=3.
(B) Growth assays of wild-type yeast +/− concA on low amino acid glycerol medium plus indicated AA. [Cysteine] = 1 mM, [Threonine] = 15 mM.
(C) Flow cytometry analysis of FIT2pr-GFP fluorescence in yeast cultured in low amino acid medium with increasing concentrations of cysteine for 6 hrs. Plotted values = mean ± SD, n=3.
(D) Steady-state levels of the indicated individual proteins (SDS-PAGE) and representative assembled respiratory complexes [Blue-Native (BN) PAGE] analyzed via Western blotting of crude mitochondrial fractions isolated from yeast treated −/+ excess cysteine for 6 hrs. Rip1, Complex III; Sdh2, Complex II; F1β, Complex V.
(E) Relative oxygen consumption rate (OCR) of wild-type yeast grown −/+ excess cysteine for 6 hrs. Bars = mean ± SD, n=3.
(F) Growth assays of wild-type yeast on low amino acid medium +/− 15 mM cysteine +/− Fe.
(G) Two major routes of cysteine and threonine degradation.
(H–K) Flow cytometry analysis of FIT2pr-GFP fluorescence in the indicated wild type and mutant yeast strains (H and J) or in wild-type strains overexpressing the indicated gene (I and K) treated +/− concA for 6 hrs. Bars = mean ± SD, n=3.
(L–M) Growth assays of wild type and the indicated mutant yeast on YPD +/− concA +/− Fe.
(N) Flow cytometry analysis of FIT2pr-GFP fluorescence in yeast cultured +/− concA for 6 hrs in the low AA medium +/− 10X AA with or without cysteine and threonine. Bars = mean ± SD, n=3.
See also Figure S5
To determine whether the effects of cysteine and threonine resulted from changes in the intracellular pools of these amino acids, we genetically modulated enzymes that degrade these amino acids within cells, and assayed the impact of these manipulations on iron reporter activity and cell growth under conditions of V-ATPase impairment. Deletion or overexpression of cystathionine gamma-lyase (CYS3), which breaks down cysteine to pyruvate, ammonia, and hydrogen sulfide (Figure 5G) (Smacchi and Gobbetti, 1998; Stipanuk, 2004; Yamagata et al., 1993), increased or decreased iron regulon activity, respectively, upon V-ATPase inhibition (Figures 5H and 5I). Similarly, deletion or overexpression of threonine aldolase (GLY1), which breaks down threonine to glycine and acetaldehyde (Figure 5G) (Liu et al., 1997; Monschau et al., 2006), also increased or diminished V-ATPase-induced iron regulon activity, respectively (Figures 5J and 5K). Furthermore, both CYS3 and GLY1, which are dispensable for growth in untreated cells, were essential for survival upon V-ATPase impairment in an iron-dependent manner (Figures 5L and 5M).
While both cysteine and threonine were sufficient to drive iron starvation, only cysteine was necessary to induce Aft1 activity. Dropout of threonine alone from 10X amino acid concentrated synthetic medium had no impact on iron regulon activity in response to V-ATPase inhibition, while removal of cysteine fully prevented iron-regulon activation (Figure 5N). Thus, elevated cysteine is necessary and sufficient to limit intracellular iron availability in V-ATPase impaired cells. We speculate that threonine may impact iron homeostasis by allosterically regulating cysteine metabolism, as threonine and cysteine are metabolically linked through homoserine in S. cerevisiae (Cherest et al., 1969; Ramos et al., 1991) (Figure S5B). Consistent with this idea, D-threonine did not affect iron metabolism, despite being taken up by cells as efficiently as naturally occurring L-threonine (Figure S5C and S5D). Finally, our results indicate that elevated non-vacuolar cysteine, rather than a cysteine derivative, likely drives iron limitation, as other cysteine related metabolites, including homocysteine, glutathione, and methionine did not impact the iron regulon (Figures S5E, S5F, and 5A). Iron limitation was also not induced with S-methyl-l-cysteine, indicating the sulfhydryl group contributes to cysteine’s impact on iron homeostasis (Figure S5G).
Cysteine-mediated iron limitation is oxidant-linked and suppressed by hypoxia
We next investigated how elevated non-vacuolar cysteine limits intracellular iron bioavailability upon V-ATPase impairment. Cysteine is a thiol containing redox active amino acid and its toxicity across organisms and tissues is well-documented (Avcilar-Kucukgoze et al., 2016; Kumar et al., 2006; Nishiuch et al., 1976; Olney et al., 1990; Ruiz et al., 2017; Takumi and Nonaka, 2016). Prior studies suggested that cysteine toxicity is linked to its ability to generate oxidant stress via its propensity to auto-oxidize, and we confirmed that cysteine can produce hydrogen peroxide in vitro in the presence of low levels of copper (Figure 6A) (Flynn et al., 1984; Poole, 2015; Vina et al., 1983). It is also widely documented that ISCs are highly susceptible to oxidants (Djaman et al., 2004), and that V-ATPase inhibition elevates ROS levels cells (Diab and Kane, 2013; Milgrom et al., 2007). Thus, we considered the possibility that elevated cysteine in V-ATPase impaired cells limits iron bioavailability by generating ROS, which disrupts ISCs in proteins and impairs iron availability.
Figure 6. V-ATPase deficiency and Elevated Cysteine Impact Iron Homeostasis via an ROS-based mechanism.
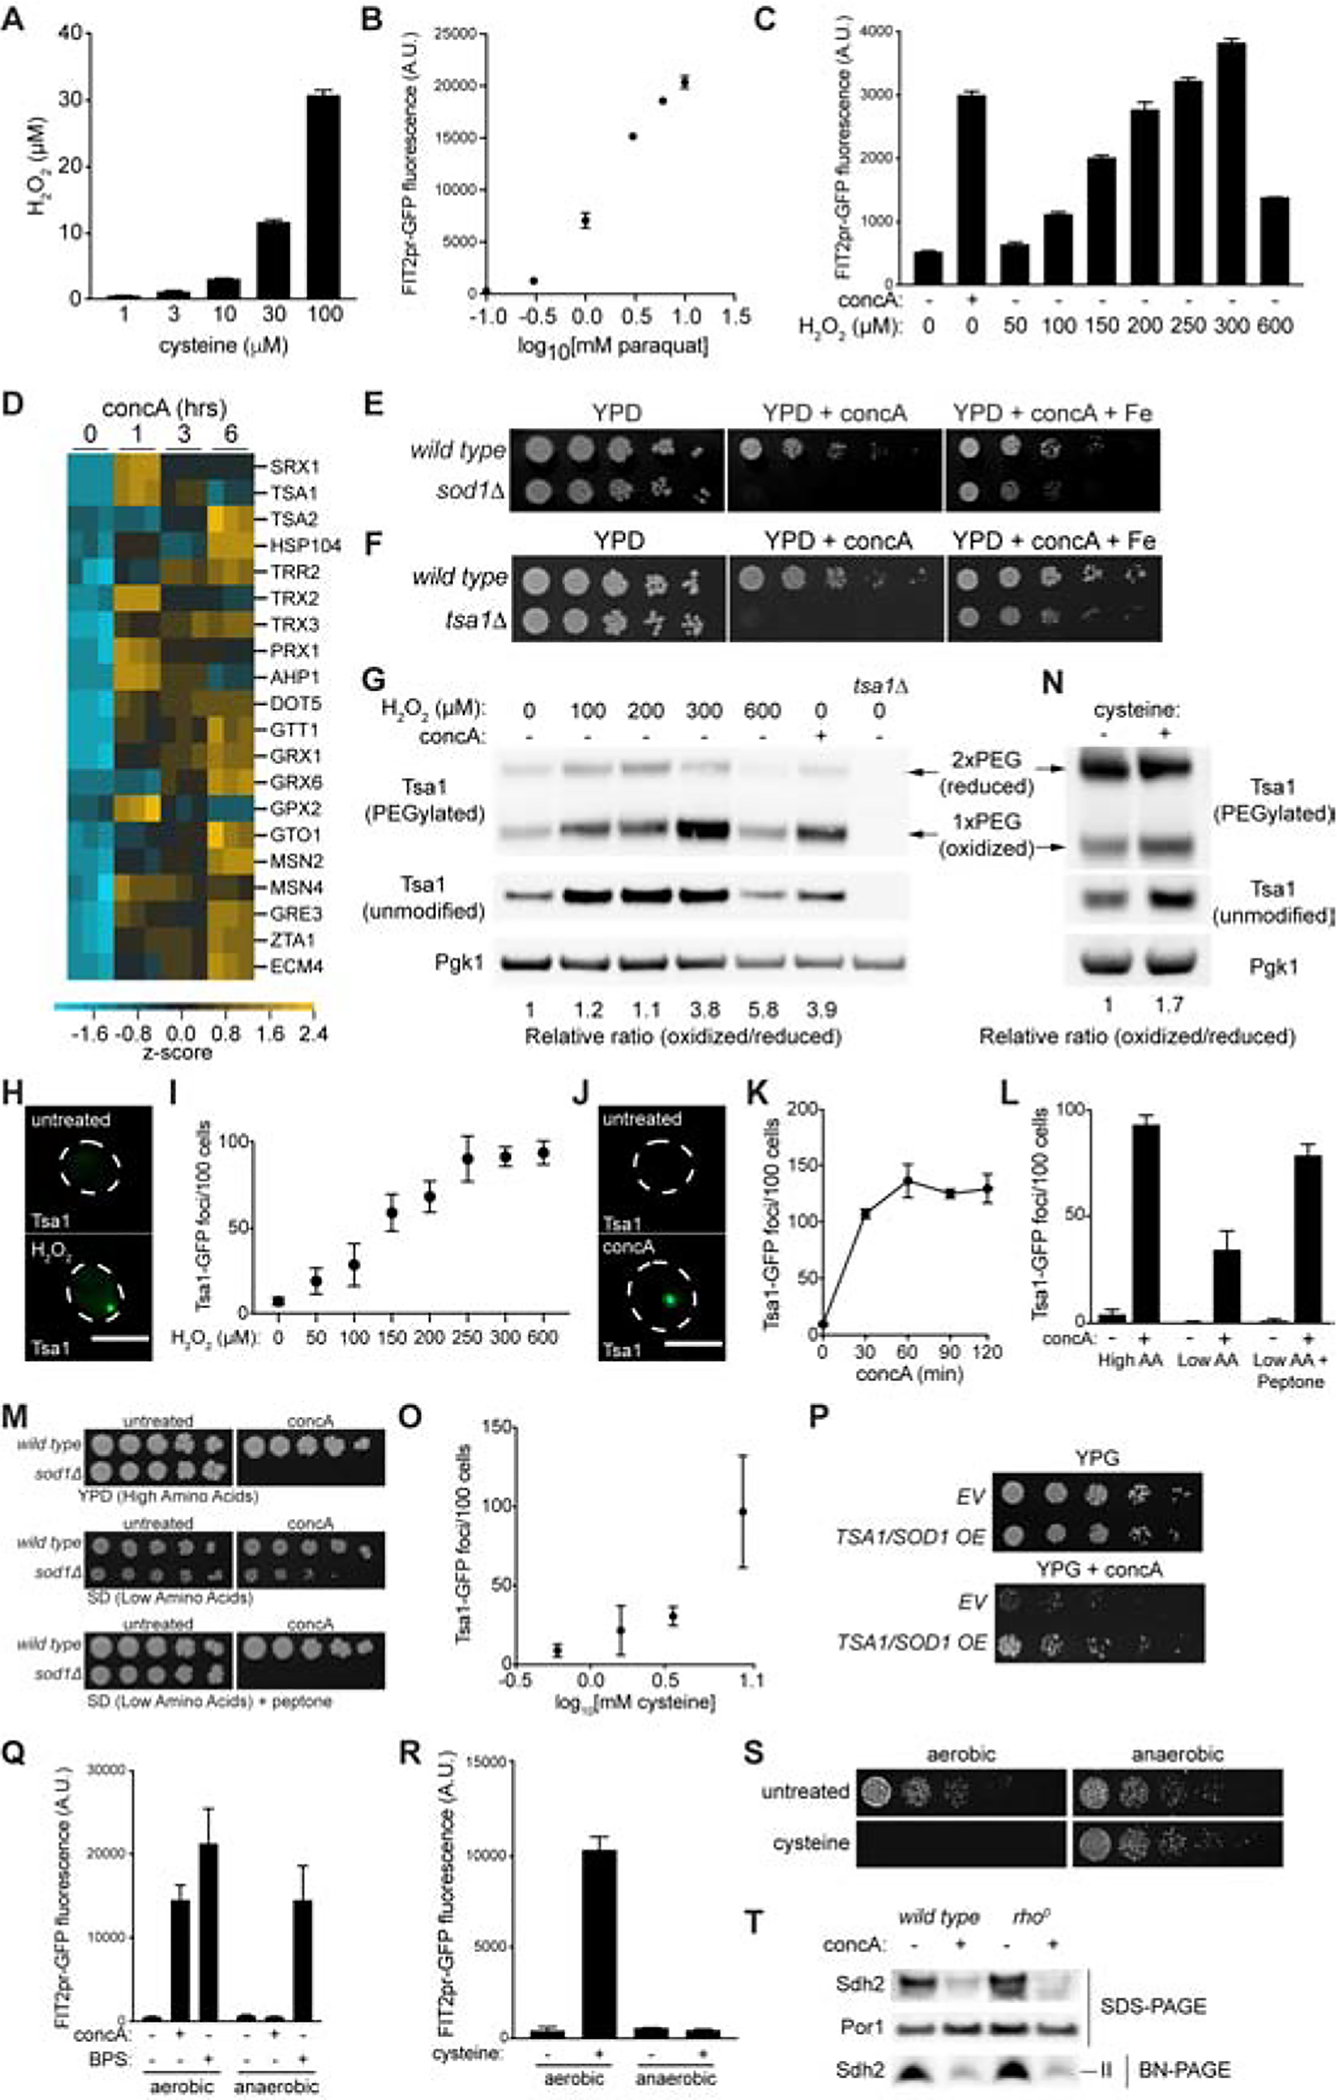
(A) Amplex red measurements of hydrogen peroxide produced by indicated concentration of cysteine incubated in the presence of copper for 1 hr. Bars = mean ± SD, n=3.
(B–C) Flow cytometry analysis of FIT2pr-GFP fluorescence in yeast cultured with increasing concentration of paraquat (B) or hydrogen peroxide (C) for 6 or 2 hrs, respectively. Bars = mean ± SD, n=3.
(D) Heat map showing Z-scores of transcripts from RNA sequencing analysis conducted on yeast treated with concA for the indicated time. Blue = downregulated, yellow = upregulated.
(E–F) Growth assays of wild-type and the indicated mutant yeast on YPD +/− concA +/− Fe.
(G and N) Western blot of whole cell lysates from cells treated with hydrogen peroxide, concA, or elevated cysteine as indicated. Lysates were incubated with (PEGylated) or without (unmodified) PEG-maleimide prior to immunoblotting. Pgk1 = loading control. Oxidized and reduced forms of Tsa1 are indicated.
(H and J) Maximum-intensity projection images showing Tsa1-GFP foci in yeast grown either +/− hydrogen peroxide (H) or +/− concA (J) for 1.5 hrs. Scale bar = 5 μm.
(I and K) Quantification of number of Tsa1-GFP foci from maximum intensity projection images of cells treated with the indicated concentration of hydrogen peroxide (I) or concA for the indicated time (K). Values = mean ± SD, n=3.
(L) Quantification of Tsa1-GFP foci from maximum intensity projection images of cells treated with concA for 1.5 hrs in the indicated medium. Bars = mean ± SD, n=3.
(M) Growth assays of wild-type and sod1Δ yeast on the indicated medium.
(O) Quantification of number of Tsa1-GFP foci from maximum intensity projection images of cells cultured in low amino acid medium with increasing concentrations of cysteine for 1.5 hrs. Values = mean ± SD, n=3.
(P) Growth assays of yeast containing empty vector (EV) or high-copy TSA1 and SOD1 expression plasmids on YPG +/− concA + low dose iron (10 μM).
(Q and R) Flow cytometry analysis of FIT2pr-GFP fluorescence in wild type yeast treated +/− concA, +/− BPS, or +/− cysteine in the presence (aerobic) or absence (anaerobic) of oxygen for 18 hrs. Bars = mean ± SD, n=3.
(S) Growth assays of wild type yeast +/− excess cysteine +/− oxygen.
(T) Steady-state levels of the indicated individual proteins (SDS-PAGE) and assembled respiratory complex II (Sdh2) [Blue-Native (BN) PAGE] analyzed via Western blotting of crude mitochondrial fractions isolated from wild type or rho0 yeast treated +/− concA for 6 hrs.
To test this hypothesis, we first confirmed that exposure of cells to oxidant stress is sufficient to impair iron homoeostasis. Addition of paraquat (Bus and Gibson, 1984) or hydrogen peroxide both activated the iron regulon in a concentration dependent manner, suggesting that oxidant stress is sufficient to impair iron availability (Figures 6B and 6C). Low-dose paraquat also impaired growth of V-ATPase deficient cells in an iron-dependent manner (Figure S6A). Next, we tested whether V-ATPase inhibition generates ROS, as previously suggested (Diab and Kane, 2013; Milgrom et al., 2007). We found via RNA-seq analysis that treatment of cells with concA significantly upregulated a host of antioxidant defense genes (Figure 6D), and that that key antioxidant genes SOD1 and TSA1 became essential for survival upon V-ATPase inhibition in an iron-dependent manner (Figures 6E and 6F). However, we initially detected no evidence of increased intracellular oxidants upon concA treatment using several common readouts of oxidative stress, including protein carbonylation, oxidation of the hydrogen peroxide sensor HyPer (Bilan et al., 2013), and hyperoxidation of the peroxiredoxin Tsa1 (Hanzen et al., 2016; Molin et al., 2011) (Figures S6B–D).
In considering the potential cause of this inconsistency, we tested whether levels of ROS produced by V-ATPase mutants were lower than the sensitivity of the latter three assays. Indeed, when cells were exposed to a range of hydrogen peroxide concentrations, we only observed changes via oxyblot, HyPer oxidation, and Tsa1 hyperoxidation at the highest concentration of hydrogen peroxide tested, 600 μM (Figures S6E–G). At 300 μM and below, no oxidation via these three assays was observable. In contrast, iron homeostasis was perturbed by low levels of hydrogen peroxide, starting at 100 μM and peaking at 300 μM (Figure 6C).
To circumvent the low sensitivity of these oxidative stress readouts, we identified two additional ROS indicators that responded to low levels of hydrogen peroxide, including levels sufficient to disrupt iron homeostasis. As shown in Figure 6G, the ratio of oxidized to reduced peroxiredoxin Tsa1, as probed by accessibility of its redox active cysteines to modification by PEG-maleimide, increased upon low dose hydrogen peroxide exposure. Additionally, accumulation of Tsa1 into cytoplasmic foci, previously shown to result from oxidant stress, robustly occurred at low doses of hydrogen peroxide (Hanzen et al., 2016; Molin et al., 2011) (Figures 6H and 6I). Utilizing these sensitive readouts for oxidant stress, we found that acute V-ATPase inhibition increased the ratio of oxidized to reduced Tsa1 within cells (Figure 6G), and generated Tsa1-GFP foci to a similar extent as low dose hydrogen peroxide (Figure 6J–K)—levels of hydrogen peroxide that are sufficient to activate the iron regulon. Importantly, Tsa1 foci generated by concA were suppressed by low oxygen, indicating they are oxidant-dependent and not caused by other stressors (Figure S6H). Thus, V-ATPase inhibition causes intracellular oxidative stress at levels high enough to impact iron homeostasis.
We next tested whether amino acids, in particular cysteine, were required for generating oxidant stress upon V-ATPase inhibition. We found that Tsa1 foci formation was blunted in low amino acid medium (Figure 6L). Furthermore, the antioxidant gene SOD1, which is essential for survival of V-ATPase deficient cells in high amino acid medium (Figure 6E), became dispensable in low amino acid conditions (Figure 6M). Finally, treatment of cells with a high concentration of cysteine, which was sufficient to cause iron limitation and impair mitochondrial function in the absence of vacuole stress (Figures 5C–E), generated oxygen-dependent Tsa1 foci and increased the ratio of oxidized to reduced Tsa1 in the absence of V-ATPase impairment (Figures 6N, 6O, and S6I). Thus, elevated non-vacuolar cysteine drives production of oxidants upon V-ATPase inhibition.
Finally, we tested whether iron limitation caused by V-ATPase impairment or cysteine excess could be suppressed by antioxidants or low oxygen. Hampering the antioxidant transcriptional response by deleting SKN7 enhanced activation of the iron regulon in V-ATPase impaired cells (Figures S6J and S6K). Likewise, combined overexpression of the antioxidant genes SOD1 and TSA1 (Aldini et al., 2018) in V-ATPase impaired cells blunted iron starvation and restored growth on non-fermentable carbon sources (Figures S6L and 6P). Finally, activation of the Aft1-dependent iron regulon by V-ATPase inhibition or cysteine treatment was blocked in the absence of oxygen (Figures 6Q, S6M, and 6R). Low oxygen did not block BPS-induced iron starvation, indicating that the GFP-based Aft1 reporter is functional in anaerobic conditions (Figure 6Q). Remarkably, oxygen deprivation also alleviated high cysteinedependent inhibition of cell growth, indicating that oxygen is required for cysteine toxicity (Figure 6S). Importantly, addition of excess iron did not prevent formation of Tsa1-foci or transcriptional activation of the antioxidant gene SRX1, indicating that ROS generated by V-ATPase impairment acts upstream of iron deprivation, and not vice versa (Figures S6N and S6O). Collectively, these data suggest that mitochondrial dysfunction in V-ATPase-deficient cells is caused by elevated non-vacuolar cysteine, through a mechanism that involves ROS-dependent iron limitation. How non-vacuolar cysteine leads to increased cellular ROS still remains to be determined, but our results suggest that cysteine itself may be the culprit, possibly via auto-oxidation, and that the mitochondrial respiratory chain is not the source of ROS in V-ATPase mutants. This latter conclusion is supported by the observation that V-ATPase impairment still caused loss of ISC proteins in cells lacking a functional mitochondrial respiratory chain (Figure 6T).
Iron and amino acids link vacuole and mitochondrial function in aging
We previously showed that vacuole dysfunction is a major driver of mitochondrial impairment and lifespan limitation during yeast replicative aging (Hughes and Gottschling, 2012), which is defined as the number of times an individual yeast cell asymmetrically divides (Mortimer and Johnston, 1959). Based on our current observations, we wondered whether cysteine-mediated iron deprivation was responsible for vacuole-induced mitochondrial decline during aging. To test this possibility, we monitored activation of the iron regulon in aged yeast via flow cytometry analysis of the FIT2pr-GFP reporter. We found that the iron regulon was activated in old cells, and blunted by addition of excess iron, indicating that iron is limiting in replicatively-aged yeast (Figure 7A).
Figure 7. Amino Acid Driven Iron Limitation Links Vacuoles and Mitochondria in Aging.
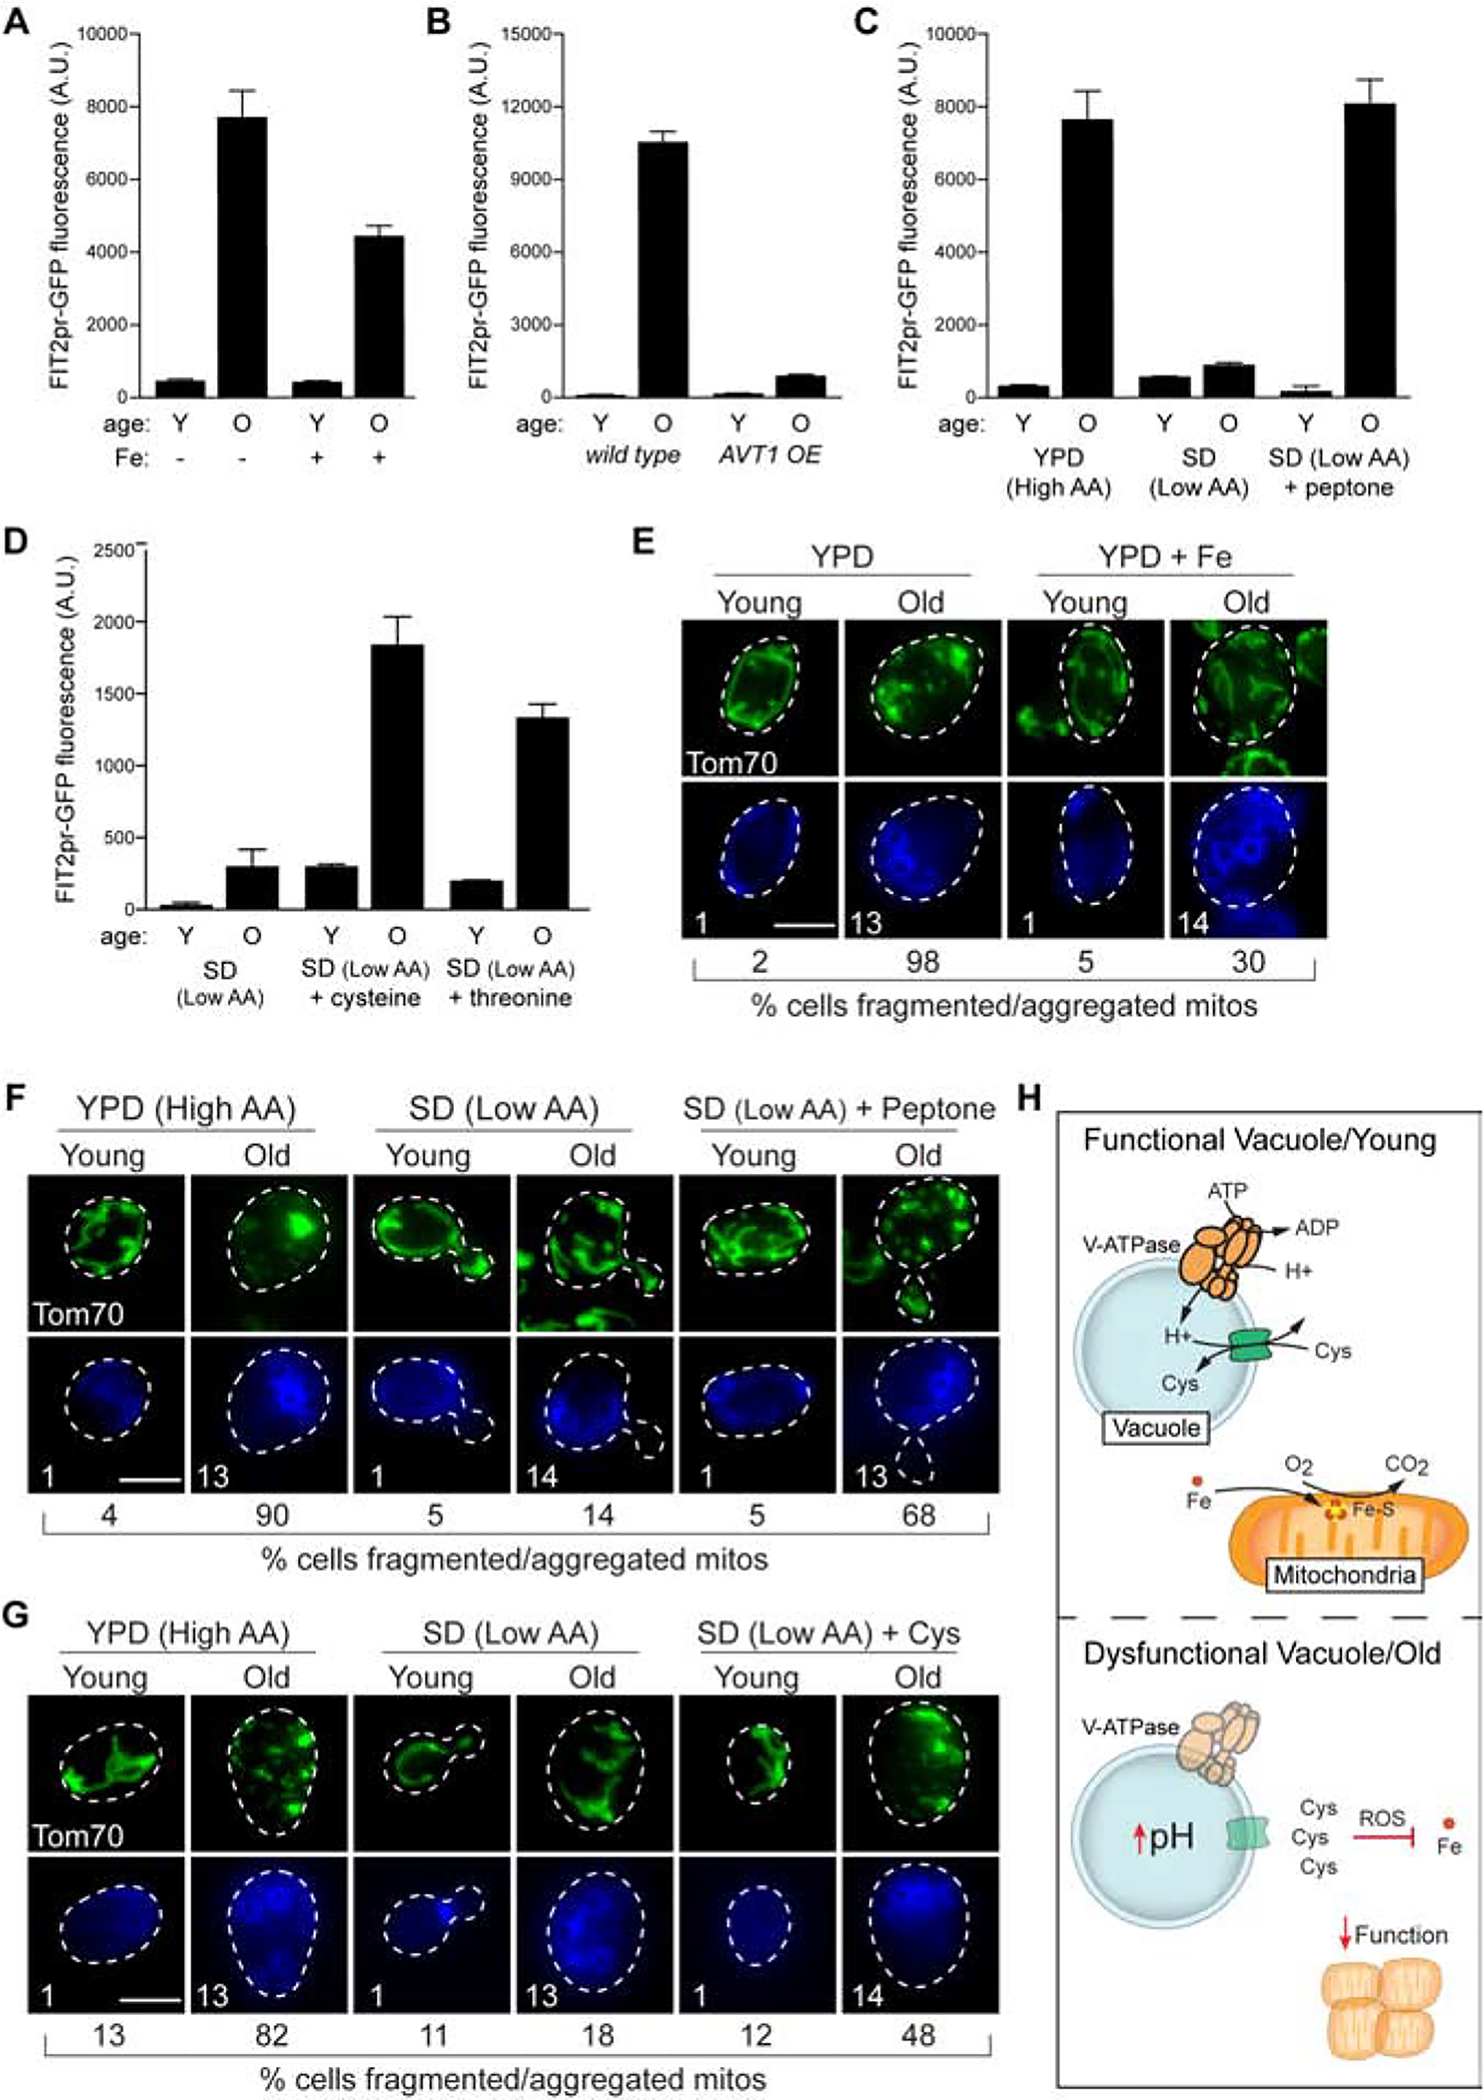
(A) Flow cytometry analysis of FIT2pr-GFP expression in young (Y) and old (O) cells grown +/− Fe. Bars = mean ± SD, n=3. Mean ages (divisions): Y = 1, O = 13. See Star Methods for age determination.
(B) Flow cytometry analysis of FIT2pr-GFP expression in young and old cells containing either empty vector or overexpressing AVT1. Bars = mean ± SD, n=3. Mean ages: Y = 1, O = 12.
(C) Flow cytometry analysis of FIT2pr-driven GFP expression in young and old cells cultured in the indicated medium. Bars = mean ± SD, n=3. Mean ages: Y = 1, O = 13.
(D) Flow cytometry analysis of FIT2 promoter-driven GFP expression in young and old cells cultured in low amino acid medium +/− excess cysteine or threonine. Bars = mean ± SD, n=3. Mean ages: Y = 1, O = 13.
(E) Maximum-intensity projection images showing yeast mitochondrial structure (Tom70-GFP) in young and old cells grown +/− Fe. For (E–G): scale bar = 5 μm, percentage of cells with fragmented or aggregated mitochondria is indicated (n=100 cells), and mean age (determined by bud scar counting) is indicated in bottom panels showing calcofluor-stained bud scars.
(F) Maximum-intensity projection images showing yeast mitochondrial structure in young and old cells cultured in the indicated medium.
(G) Maximum-intensity projection images showing yeast mitochondrial structure in young and old cells cultured in low amino acid medium +/− excess cysteine.
(H) (Top) In young cells, the V-ATPase-dependent proton gradient is harnessed by amino acid/proton antiporters to compartmentalize cysteine within vacuoles. Cysteine compartmentation ensures iron availability for ISC (Fe-S) dependent mitochondrial respiration. (Bottom) In aged yeast, the pH of the vacuole increases, blocking cysteine storage. Elevated non-vacuolar cysteine promotes ROS, which disrupts iron homeostasis and mitochondrial respiration.
To determine if iron limitation in old cells was caused by altered vacuolar amino acid compartmentation, we monitored activation of the FIT2pr-GFP reporter in cells overexpressing the vacuolar amino acid importer AVT1, which we previously showed prevented mitochondrial decline in aged cells (Hughes and Gottschling, 2012). We found that AVT1 overexpression alleviated iron starvation in old cells (Figure 7B). Consistent with this result, iron deprivation was also blocked in cells aged in low amino acid medium (Figure 7C), and addition of peptone or supplementation with cysteine and threonine restored iron starvation in aged cells (Figures 7C and 7D). Thus, non-vacuolar amino acids cause iron limitation during aging.
Finally, we assessed whether mitochondrial dysfunction in old cells was caused by amino acid-linked iron limitation by examining mitochondrial structure in aged cells subjected to iron supplementation or amino acid limitation. As we previously showed (Hughes and Gottschling, 2012), the tubular mitochondrial network aggregated and fragmented in old cells, which is a general indicator of mitochondrial dysfunction (Figure 7E). We found that mitochondrial structure was restored when cells were aged in the presence of excess iron (Figure 7E) or in media containing low amino acid levels (Figure 7F). Moreover, structural abnormalities were reintroduced by the addition of peptone to low amino acid media (Figure 7F) or by cysteine supplementation (Figure 7G). These results suggest that age-associated mitochondrial dysfunction, which we previously showed was driven by a decline in vacuole activity, results from cysteine-mediated iron limitation.
Discussion
This work outlines a mechanism linking vacuolar and mitochondrial functions with important implications for aging and disease. While it has been appreciated for almost 30 years that vacuoles and mitochondria are functionally connected (Ohya et al., 1991), the functional relationship between these two organelles has remained unclear. We now show that the spatial compartmentation of amino acids by vacuoles is required to maintain mitochondrial respiration and prevent age-related mitochondrial decline (Figure 7H). In young, healthy cells, amino acids are imported and sequestered in the vacuole in a V-ATPase-dependent manner. As cells age or V-ATPase activity is compromised, import of amino acids into vacuoles is blocked, leading to their cytoplasmic elevation. We show that elevated non-vacuolar amino acids, in particular cysteine, ultimately cause cellular toxicity by disrupting iron homeostasis through an ROS-based mechanism, which impairs iron-dependent mitochondrial respiration.
This discovery provides an important step forward in our understanding of the mechanisms driving age-related mitochondrial decline. We previously demonstrated that age-associated mitochondrial impairment in yeast is caused by vacuole dysfunction (Hughes and Gottschling, 2012). Our current data expands on this model by showing that a breakdown in the spatial compartmentation of amino acids is a key driver of age-related mitochondrial deterioration through ROS-dependent perturbation of iron homoeostasis. This model synergizes with previous observations in yeast and other eukaryotes that amino acids and ROS negatively impact organismal lifespan, and that antioxidant defense systems like superoxide dismutase Sod1 and the peroxiredoxin Tsa1 are crucial regulators of longevity (Muller et al., 2007; Soultoukis and Partridge, 2016) (Molin et al., 2011; Schleit et al., 2013). Moreover, our results also provide insight into mechanisms by which ROS and amino acids elicit their negative effects during aging—by converging on iron homeostasis.
This results of this study may also provide insights into mechanisms underlying age-related and metabolic disorders associated with an interdependent decline in lysosome and mitochondrial function, including Parkinson’s, Alzheimer’s, lysosomal storage disorders, and diabetes (Assali et al., 2018; Audano et al., 2018; Colacurcio and Nixon, 2016; de la Mata et al., 2016; Ferguson, 2015; Nixon et al., 2008; Plotegher and Duchen, 2017). Because of the lysosome’s well-known role in protein degradation (Li and Kane, 2009), altered protein homoeostasis is widely considered to be the major driver linking lysosomes and mitochondria in these diseases. Our current results raise the possibility that amino acid toxicity and/or iron limitation may also play important roles in disease development. Interestingly, it is well-documented that perturbations in iron metabolism are a hallmark of many age-related disorders (Ashraf et al., 2018). Whether iron perturbations are linked to lysosome and mitochondrial decline or amino acid toxicity in these disease states is currently unknown, and will be an interesting area of future investigation.
Finally, our work indicates that despite being essential cellular nutrients, amino acids can become toxic if their intracellular levels are not properly controlled. While the toxic nature of other cellular nutrients such as carbohydrates (carbotoxicity) (Kroemer et al., 2018) and lipids (lipotoxicity) (Unger and Scherer, 2010) is well appreciated, our understanding of amino acid toxicity and its role in aging and disease is minimal. The strongest support to date that elevated levels of amino acids are toxic for cells stems from the existence of numerous inborn errors of amino acid metabolism (Aliu et al., 2018). These disorders are caused by mutations in key metabolic enzymes that impair a cell’s ability to break down certain types of amino acids and their derivatives, which can lead to severe developmental and neurological abnormalities and even death. The extent to which amino acid toxicity functions as a driver of normal aging and age-associated disorders remains to be determined.
We identified cysteine as the problematic amino acid driving iron and mitochondrial deficits in aging. While the exact mechanism by which cysteine increases ROS and impairs iron homeostasis remain to be determined, it has been long appreciated that high levels of cysteine cause toxicity in many organisms (Avcilar-Kucukgoze et al., 2016; Kumar et al., 2006; Nishiuch et al., 1976; Olney et al., 1990; Ruiz et al., 2017; Takumi and Nonaka, 2016). Across evolution, different systems have evolved to detoxify cysteine, including transcriptional or post-translational regulation of enzymes that break down cysteine, and regulation of transporters responsible for cysteine uptake into cells (Deshpande et al., 2017; Stipanuk, 2004; Stipanuk et al., 2009; Takumi and Nonaka, 2016). Here, we identify vacuoles as a key player in cysteine detoxification, likely by limiting cysteine’s cytoplasmic levels through spatial compartmentation. A recent study demonstrated that cystine, the oxidized form of cysteine, is compartmentalized in mammalian lysosomes in a V-ATPase dependent manner (Abu-Remaileh et al., 2017). This raises the possibility that lysosomal compartmentation of cysteine may be a fundamental mechanism across organisms to minimize its toxicity. Importantly, cysteine is only one of many amino acids that yeast vacuoles compartmentalize (Kitamoto et al., 1988). Whether vacuolar compartmentation of other amino acids also functions to limit their toxicity remains to be determined, but is an exciting possibility moving forward.
STAR METHODS
KEY RESOURCES TABLE
| REAGENT or RESOURCE | SOURCE | IDENTIFIER |
|---|---|---|
| Antibodies | ||
| Mouse monoclonal anti-GFP clones 7.1 and 13.1 | Roche | RRID:AB_390913; Cat # 11814460001 |
| Mouse monoclonal anti-PGK1 clone 22C5D8 | Abcam | RRID:AB_10861977; Cat # ab113687 |
| Rabbit polyclonal anti-Aco1 | Roland Lill Lab (Marburg) | N/A |
| Rabbit polyclonal anti-Rip1 | Dennis Winge Lab (Utah) | N/A |
| Rabbit polyclonal anti-Sdh2 | Dennis Winge Lab (Utah) | N/A |
| Rabbit polyclonal anti-F1β | Alexander Tzagoloff Lab (Columbia) | N/A |
| Mouse monoclonal anti-Por1 clone 16G9E6BC4 | Abcam | RRID:AB_10865182; Cat # ab110326 |
| Rabbit polyclonal anti-HSP70 | Kostas Tokatlidis Lab (Glasgow) | N/A |
| Mouse monoclonal anti-CpY (Prc1) clone 10A5B5 | Thermo Fisher | RRID:AB_2536203; Cat # A-6428 |
| Mouse monoclonal anti-Pep12 clone 2C3G4 | Thermo Fisher | RRID:AB_2535823; Cat # A-21273 |
| Mouse monoclonal anti-2 Cys Peroxiredoxin clone 6E5 | Abcam | RRID:AB_443456; Cat # ab16765 |
| Rabbit polyclonal anti-Peroxiredoxin-SO3 | Abcam | RRID:AB_443491; Cat # ab16830 |
| Bacterial and Virus Strains | ||
| Yeast Genomic Tiling Collection | Dharmacon | Cat # YSC4613 |
| E. coli: DH5α | Jared Rutter Lab (Utah) | N/A |
| Chemicals | ||
| Lyticase from Anthrobacter luteus | Sigma-Aldrich | Cat # L4025; CAS: 1032350-13-2 |
| Concanamycin A | Santa Cruz | Cat # 202111; CAS: 80890-47-7 |
| Ammonium Iron(II) Sulfate Hexahydrate | Sigma-Aldrich | Cat # 215406; CAS: 7783-85-9 |
| Iron(III) chloride | Sigma-Aldrich | Cat # 157740; CAS: 7705-08-0 |
| Concanavalin A | Sigma-Aldrich | Cat # L7647; CAS: 11028-71-0 |
| DiOC6 (3, 3’ Dihexyloxacarbocyanine Iodide) | Thermo Fisher | Cat # D273; CAS: 53213-82-4 |
| BPS (Bathophenanthrolinedisulfonic Acid Disodium Salt Hydrate) | Sigma-Aldrich | Cat # 146617; CAS: 52746-49-3 |
| RNase Free DNase | Qiagen | Cat # 79254 |
| β-Estradiol | Sigma-Aldrich | Cat # E8875; CAS: 50-28-2 |
| MG-132 | Cayman Chemical | Cat # 10012628; CAS: 133407-82-6 |
| Cycloheximide | Sigma-Aldrich | Cat # C1988; CAS: 66-81-9 |
| EZ Link Sulfo-NHS-LC-Biotin | Thermo Fisher | Cat # 21335 |
| µMACS Streptavidin MicroBeads | Miltenyi Biotec | Cat # 120-001-017 |
| Alexa Fluor 660 NHS Ester (Succinimidyl Ester) | Thermo Fisher | Cat # A20007 |
| Fluorescent Brightener 28 (Calcofluor White MR2) | Sigma-Aldrich | Cat # F3543; CAS: 4404-43-7 |
| Digitonin special-grade (water-soluble) | Gold Biotechnology | Cat # D-180; CAS: 11024-24-1 |
| NativePAGE 20X Running Buffer | Thermo Fisher | Cat # BN2001 |
| NativePAGE 20X Cathode Buffer Additive | Thermo Fisher | Cat # BN2002 |
| 20X Bolt MES SDS Running Buffer | Thermo Fisher | Cat # B000202 |
| cOmplete Protease Inhibitor Cocktail | Sigma-Aldrich | Cat # 11697498001 |
| Peptone (Granulated) | Thermo Fisher | Cat # BP9725; CAS: 73049-73-7 |
| Casamino acids (Acid hydrolyzed casein) | US Biological | Cat # 0012501A; CAS: 65072-00-6 |
| D-Threonine | Thermo Fisher | Cat # AC346970250; CAS: 632-20-2 |
| L-Glutathione, reduced | Sigma-Aldrich | Cat # G4251; CAS: 70-18-8 |
| L-Homocysteine | Chem-Impex Int’l Inc. | Cat # 21338; CAS: 6027-13-0 |
| S-Methyl-L-cysteine | Sigma-Aldrich | Cat # M6626; CAS: 1187-84-4 |
| Hydrogen peroxide | Sigma-Aldrich | Cat # H1009; CAS: 7722-84-1 |
| Paraquat dichloride hydrate | Sigma-Aldrich | Cat # 36541; CAS: 75365-73-0 |
| Methoxypolyethylene glycol maleimide (PEG-maleimide) | Sigma-Aldrich | Cat # 63187; CAS: 99126-64-4 |
| U-13C/U-15N stable isotope labeled amino acids | Cambridge Isotope Laboratories | Cat # CNLM-6696-1 |
| Methoxylamine Hydrochloride (MOX) | MP Biomedicals | Cat # 02155405; CAS: 593-56-6 |
| Pyridine | EMD Millipore | Cat # PX2012–7; CAS: 110-86-1 |
| N-methyl-N-trimethylsilyltrifluoracetamide (MSTFA) | Thermo Fisher | TS-48913 |
| Critical Commercial Assays | ||
| Gibson Assembly Master Mix | New England Biolabs | Cat # E2611 |
| Gateway BP Clonase II Enzyme Mix | Thermo Fisher | Cat # 11789020 |
| Gateway LR Clonase II Enzyme Mix | Thermo Fisher | Cat # 11791020 |
| RNeasy Mini Kit | Qiagen | Cat # 74104 |
| SuperScript IV First-Strand Synthesis | Thermo Fisher | Cat # 18091050 |
| KAPA SYBR FAST ROX Low qPCR Kit | Kapa Biosystems | Cat # KK4621 |
| Ribo-Zero Gold rRNA Removal Kit (yeast) | Illumina | Cat # MRZY1306 |
| TruSeq Stranded Total Rna Kit | Illumina | Cat # RS-122–2302 |
| D1000 ScreenTape Assay | Agilent | Cat # 5067–5582 |
| Pierce BCA Protein Assay Kit | Thermo Fisher | Cat # 23225 |
| Amplex Red Hydrogen Peroxide/Peroxidase Assay Kit | Thermo Fisher | Cat # A22188 |
| OxyBlot Protein Oxidation Kit | Millipore Sigma | Cat # S7150 |
| Deposited Data | ||
| See Table S1, RNA sequencing deposited at GEO | This study | Accession # GSE133214 |
| Experimental Models: Organisms/Strains | ||
| Yeast Homozygous Diploid Collection | (Winzeler et al., 1999); Dharmacon | Cat # YSC1056 |
| S. cerevisiae: wild type: BY4741 MATa his3Δ1 leu2Δ0 ura3Δ0 met15Δ0 | (Brachmann et al., 1998); ATCC | Cat # 201388 |
| S. cerevisiae: wild type: BY4742 MATα his3Δ1 leu2Δ0 ura3Δ0 lys2Δ0 | (Brachmann et al., 1998); ATCC | Cat # 201389 |
| S. cerevisiae: wild type; BY4743 MATa/α his3Δ1/his3Δ1 leu2Δ0/leu2Δ0 ura3Δ0/ura3Δ0 met15Δ0/+ lys2Δ0/+ | (Brachmann et al., 1998); ATCC | Cat # 201390 |
| S. cerevisiae: vph2Δ: BY4741 vph2Δ::KanMX | (Winzeler et al., 1999); Dharmacon | MATa deletion collection |
| S. cerevisiae: Tim50-GFP: BY4743 Tim50-yeGFP: His3MX/Tim50-yeGFP:His3MX Tom70-mCherry: KanMX/Tom70-mCherry:KanMX | This study | AHY7356 |
| S. cerevisiae: Tim50-mCherry: BY4743 Tim50-mCherry: KanMX/Tim50-mCherry:KanMX | This study | AHY8455 |
| S. cerevisiae: wild type Aft1 reporter: BY4741 chrI(199456–199457)::PFIT2-yeGFP-TermADH1:KanMX | This study | AHY2993 |
| S. cerevisiae: vma1Δ Aft1 reporter: BY4741 chrI(199456–199457)::PFIT2-yeGFP-TermADH1:KanMX vma1Δ::URA3 | This study | AHY5012 |
| S. cerevisiae: vph2Δ Aft1 reporter: BY4741 chrI(199456–199457)::PFIT2-yeGFP-TermADH1:KanMX vph2Δ::URA3 | This study | AHY5010 |
| S. cerevisiae: rox1Δ: BY4741 rox1Δ::URA3 | This study | AHY1776 |
| S. cerevisiae: rox1Δ fet4Δ: BY4741 rox1Δ::URA3 fet4Δ::LEU2 | This study | AHY2926 |
| S. cerevisiae: Aft1-GFP: BY4742 AFT1-yeGFP:HphMX SRM1-mCherry:KanMX | This study | AHY2977 |
| S. cerevisiae: wild type Aft1 reporter: chrI(199456–199457)::PFIT2-yeGFP-TermADH1:HphMX | This study | AHY5005 |
| S. cerevisiae: aft1Δ: BY4741 aft1Δ::KanMX | (Winzeler et al., 1999); Dharmacon | MATa deletion collection |
| S. cerevisiae: aft1Δ Aft1 reporter: chrI(199456–199457)::PFIT2-yeGFP-TermADH1:HphMX aft1Δ::KanMX | This study | AHY5007 |
| S. cerevisiae: Lys4-GFP: BY4741 LYS4-GFP:His3MX | Thermo Fisher | GFP clone collection |
| S. cerevisiae: Dre2-GFP: BY4741 DRE2-GFP:His3MX | Thermo Fisher | GFP clone collection |
| S. cerevisiae: Elp3-GFP: BY4741 ELP3-GFP:His3MX | Thermo Fisher | GFP clone collection |
| S. cerevisiae: Tyw1-GFP: BY4741 TYW1-GFP:His3MX | Thermo Fisher | GFP clone collection |
| S. cerevisiae: Grx6-GFP: BY4741 GRX6-GFP:His3MX | Thermo Fisher | GFP clone collection |
| S. cerevisiae: Bio2-GFP: BY4741 BIO2-GFP:His3MX | Thermo Fisher | GFP clone collection |
| S. cerevisiae: RITE-tag parent: BY4742 TermCYC1:URA3-PGPD/TDH3-cre-EBD78:TermCYC1 | Dan Gottschling Lab (Calico) | UCC6886 |
| S. cerevisiae: Lys4-RITE: UCC6886 LYS4-V5-loxP-HA-GFP:HphMX-loxP-T7-mRFP:KanMX | This study | AHY1758 |
| S. cerevisiae: Tyw1-RITE: UCC6886 TYW1-V5-loxP-HA-GFP:HphMX-loxP-T7-mRFP:KanMX | This study | AHY1759 |
| S. cerevisiae: Pgk1-RITE: UCC6886 PGK1-V5-loxP-HA-GFP:HphMX-loxP-T7-mRFP:KanMX | This study | AHY1761 |
| S. cerevisiae: rho0: BY4741 rho0 | This study | AHY1772 |
| S. cerevisiae: atg5Δ Aft1 reporter: BY4741 chrI(199456–199457)::PFIT2-yeGFP-TermADH1-KanMX atg5::URA3 | This study | AHY5014 |
| S. cerevisiae: pep4Δ Aft1 reporter: BY4741 chrI(199456–199457)::PFIT2-yeGFP-TermADH1-KanMX pep4::URA3 | This study | AHY5016 |
| S. cerevisiae: pdr5Δ Aft1 reporter: BY4741 chrI(199456–199457)::PFIT2-yeGFP-TermADH1-KanMX pdr5::URA3 | This study | AHY6133 |
| S. cerevisiae: cys3Δ Aft1 reporter: BY4741 chrI(199456–199457)::PFIT2-yeGFP-TermADH1-KanMX cys3::URA3 | This study | AHY5020 |
| S. cerevisiae: gly1Δ Aft1 reporter: BY4741 chrI(199456–199457)::PFIT2-yeGFP-TermADH1-KanMX gly1::URA3 | This study | AHY8052 |
| S. cerevisiae: gly1Δ: BY4741 gly1::KanMX | (Winzeler et al., 1999); Dharmacon | Yeast MATa Collection |
| S. cerevisiae: Tsa1-GFP: BY4741 TSA1-GFP-His3MX | Thermo Fisher | GFP clone collection |
| S. cerevisiae: tsa1Δ: BY4741 tsa1::KanMX | (Winzeler et al., 1999); Dharmacon | Yeast MATa Collection |
| S. cerevisiae: sod1Δ: BY4741 sod1::URA3 | This study | AHY1762 |
| S. cerevisiae: skn7Δ Aft1 reporter: BY4741 chrI(199456–199457)::PFIT2-yeGFP-TermADH1-KanMX skn7::URA3 | This study | AHY6316 |
| S. cerevisiae: AVT1 OE Aft1 reporter: BY4741 chrI(199456–199457)::PFIT2-yeGFP-TermADH1-KanMX avt1Δ::PGPD1-AVT1-TermCYC1-URA3 | This study | AHY4577 |
| S. cerevisiae: Tom70-GFP: BY4743 hoΔ::PSCW11-cre-EBD78-NatMX/hoΔ::PSCW11-cre-EBD78- NatMX loxP-CDC20-Intron-loxP-HphMX/loxP-CDC20-Intron-loxPHphMX loxP-UBC9-loxp-LEU2/loxP-UBC9-loxp-LEU2 TOM70-yeGFP-KanMX/+ | Hughes et al., 2016 | AHY548 |
| Oligonucleotides | ||
| See Table S2 | This study | N/A |
| Recombinant DNA | ||
| Plasmid: pKT127 | (Sheff and Thorn, 2004); Addgene | Plasmid # 8728 |
| Plasmid: pKT127-mCherry | Dan Gottschling Lab (Calico) | N/A |
| Plasmid: pRS306 | (Brachmann et al., 1998); ATCC | N/A |
| Plasmid: pGP564 | Dharmacon | N/A |
| Plasmid: pGP564 FET4 | This study | N/A |
| Plasmid: pLV015 | Fred van Leeuwen Lab (Netherlands Cancer Institute); (Verzijlbergen et al., 2010) | N/A |
| Plasmid: p2FG2.0 | This study | N/A |
| Plasmid: pHLUM | (Mulleder et al., 2012); Addgene | Plasmid #40276 |
| Plasmid: pDONR221 | Thermo Fisher | Cat # 12536017 |
| Plasmid: pAG426 GPD ccdb | (Alberti et al., 2007); Addgene | Plasmid # 14156 |
| Plasmid: pAG426 GPD-FET4 | This study | N/A |
| Plasmid: pAG426 GPD-GLY1 | This study | N/A |
| Plasmid: pAG426 GPD-CYS3 | This study | N/A |
| Plasmid: pAG426 GPD-TSA1 | This study | N/A |
| Plasmid: pAG425 GPD ccdb | (Alberti et al., 2007); Addgene | Plasmid # 14154 |
| Plasmid: pAG425 GPD-SOD1 | This study | N/A |
| Plasmid: pAG415 GPD ccdb | (Alberti et al., 2007); Addgene | Plasmid # 14146 |
| Plasmid: pAG415 GPD HyPer-3 (yeast codons) | This study | N/A |
| Plasmid: pAG415 GPD HyPer-3 C199S (yeast codons) | This study | N/A |
| Plasmid: pAG306 GPD chrI ccdb | (Hughes and Gottschling, 2012) | N/A |
| Plasmid: pAG306 GPD-AVT1 chrI | (Hughes and Gottschling, 2012) | N/A |
| Plasmid: pAG306 GPD-MRS3 chrI | This study | N/A |
| Plasmid: pAG306 GPD-MRS4 chrI | This study | N/A |
| Software and Algorithms | ||
| FIJI | (Schindelin et al., 2012) | Version 1 |
| FlowJo | FlowJo | Version 10.3 |
| Prism | Graphpad Software | Version 7 |
| SnapGene | GSL Biotech | Version 4.2 |
| Image Lab | BioRad | Version 2 |
| QuantStudio | Applied Biosystems | Version 1.3 |
| EVOS FL Auto software | Thermo Fisher | Version 1.6 |
| Zen Blue | Carl Zeiss | Version 2.6 |
| Zen Black | Carl Zeiss | Version 2.3 |
| FACSDiva | BD Biosciences | Version 8.0.1.1 |
| MassHunter Qual | Agilent | Version B.07.00 |
| MassHunter Quant | Agilent | Version B.07.00 |
| STAR Aligner | (Dobin et al., 2013) | Version 2.5.2b |
| featureCounts | (Liao et al., 2014) | Version 1.5.1 |
| XPRESSplot | (Berg, 2019) | Version 0.0.4beta |
| matplotlib | (Hunter, 2007) | Version 3.1.0 |
| Other | ||
| NativePAGE 4–16% Bis-Tris Gel (15 well) | Thermo Fisher | Cat # BN2112BX10 |
| Bolt 4–12% Bis-Tris Plus Gel (15 well) | Thermo Fisher | Cat # NW04125BOX |
Lead Contact and Materials Availability
Further information and requests for resources and reagents should be directed to and will be fulfilled by the Lead Contact, Adam L. Hughes (hughes@biochem.utah.edu). All unique/stable reagents generated in this study are available from the Lead Contact without restriction.
Experimental Model and Subject Details
Yeast Strains and Culture
All yeast strains were derived from Saccharomyces cerevisiae S288C (BY background) (Brachmann et al., 1998). Petite strains lacking mitochondrial DNA (rho0) were generated by incubating wild-type yeast with ethidium bromide, and isolating clones that lacked mitochondrial DNA by DAPI staining and failed to grow on medium containing glycerol as a carbon source. For PCR-mediated homologous recombination are listed in Table S2. Deletion strains were created by one-step PCR-mediated gene replacement using the plasmid template pRS306 (Brachmann et al., 1998), with the exception of the aft1Δ FIT2pr-GFP strain (AHY5007), which was created with genomic DNA from the aft1Δ MATa deletion collection strain (Dharmacon) (Giaever et al., 2002; Winzeler et al., 1999) as the PCR template. Strains expressing fluorescently tagged Tom70, Tim50, Aft1, and Srm1 from their native loci were created using one-step PCR-mediated C-terminal endogenous epitope tagging with plasmid templates pKT127 (yeGFP) and pKT127-mCherry (mCherry) (Shaner et al., 2004; Sheff and Thorn, 2004). The Aft1 reporter strain was generated by one step-PCR mediated homologous recombination of the reporter cassette (PFIT2-yeGFP-TermADH1-KanMX) into to an empty region on chromosome I with plasmid template p2FG2.0. Recombination Induced Tag Exchange (RITE)-tagged strains were generated using one-step PCR-mediated C-terminal endogenous epitope tagging with plasmid template pLV015 in strain UCC6886, which expresses Cre recombinase (Verzijlbergen et al., 2010). Strains overexpressing AVT1, MRS3, and MRS4 were constructed by transformation of pAG306 GPD-AVT1 chrI, pAG306 GPD-MRS3 chrI, and pAG306 GPD-MRS4 chrI after NotI digestion as previously described (Hughes and Gottschling, 2012). Correct integrations and gene deletions for all strains were confirmed by colony PCR across the chromosomal insertion site and, where appropriate, microscopy visualizing the correct subcellular localization of the fusion protein. The vph2Δ (Figure 1, screen), gly1Δ (Figure 5), and tsa1Δ (Figure 6) strains were from the yeast MATa deletion collection (Dharmacon) (Giaever et al., 2002; Winzeler et al., 1999), and strains expressing GFP tagged ISC proteins (Lys4, Dre2, Elp3, Tyw1, Grx6, Bio2, Figure 2I) and Tsa1-GFP (Figure 6) were from the yeast GFP collection (Thermo Fisher) (Huh et al., 2003).
Unless otherwise noted, yeast were grown at 30°C i n high amino acid, rich medium (YP), which contained 1% yeast extract, 2% peptone, and 0.005% adenine. Low amino acid, synthetic medium (S), when utilized as indicated in Figure Legends and text, contained 0.67% yeast nitrogen base without amino acids, 0.074 g/L each adenine, alanine, arginine, asparagine, aspartic acid, cysteine, glutamic acid, glutamine, glycine, histidine, myo-inositol, isoleucine, lysine, methionine, phenylalanine, proline, serine, threonine, tryptophan, tyrosine, uracil, valine, 0.369 g/L leucine, 0.007 g/L para-aminobenzoic acid. No amino acid, minimal medium (Min, utilized where indicated) contained 0.67% yeast nitrogen base without amino acids. Glucose (D) was added at 2% w/v and glycerol (G) at 3% w/v. When indicated, peptone was added to synthetic media at 2% w/v, casein amino acids at 2% w/v, and individual amino acids at 1 mM unless otherwise noted. Anaerobic growth was carried out in an Oxoid anaerobic jar (Thermo Fisher) with Oxiod Anaerogen sachets (Thermo Fisher). For experiments in minimal medium and those that require single amino acid additions, yeast strains utilized were rendered prototrophic by transformation with the pHLUM plasmid (Addgene) (Mulleder et al., 2012).
Prior to each experiment, yeast were grown exponentially overnight to a final density of 1–4 × 10⁶ cells/ml. Overnight exponential growth was important to ensure vacuolar and mitochondrial uniformity across the population. Yeast were seeded for experiments such that the density of each culture was 1 ×10⁷ cells/ml at the time of harvest to avoid artifacts from differing growth phases. Drug treatments were carried out for the time indicated in the Figure Legends. Unless otherwise indicated, final concentrations of drugs/additions were as follows: concanamycin A (500 nM), ferrous ammonium sulfate (denoted as iron or Fe in figures and text) (2 mM), bathophenanthroline disulphonate (BPS) (250 μM), cycloheximide (50 μg/ml), MG-132 (5 μM), paraquat (5 mM), and hydrogen peroxide (0.6 mM).
Method Details
Plasmid Construction
PCRs for plasmid construction were carried out with either Phusion (NEB) or KOD (Novagen) polymerases and the oligonucleotides listed in the Table S2. Cloning strategies were designed in SnapGene. To create pGP564 FET4, the FET4 DNA sequence flanked by 1,000 base pairs to include regulatory elements was amplified from genomic DNA with oligos FET4 +1kb (+) and FET4 −1kb (−) and cloned into the BamHI sites of pGP564 (Jones et al., 2008). P2FG2.0, the plasmid template for genomic integration of the FIT2pr-GFP Aft1 reporter, was constructed via Gibson assembly of PCR fragments amplified from pKT127 (GFP), genomic DNA (FIT2 promoter), and pGP564 using oligos pF2G term F1, pF2G term R1, pF2G term F2, pF2G term R2, pF2G term FV, and pF2G term RV. Overexpression plasmids (FET4, GLY1, CYS3) were created by PCR amplification from genomic DNA using oligos FET4 OE attb1 FW GTWY, FET4 OE attb2 RV GTWY, GLY1 gtwy for, GLY1 gtwy rev, CYS3 gtwy for, and CYS3 gtwy rev, followed by BP/LR Clonase Gateway reactions (Thermo Fisher) to move the genes into pAG426 GPD-ccdB (Alberti et al., 2007).
Overexpression plasmids (SOD1, TSA1, MRS3, MRS4) were created by LR Clonase gateway reactions using pDONR vectors from the HIP FLEXGene Saccharomyces cerevisiae ORF collection (Harvard Medical School) and pAG425 GPD-ccdb (SOD1), pAG426 GPD-ccdb (TSA1), or pAG306 GPD chrI-ccdb (MRS3, MRS4) as the destination vectors (Alberti et al., 2007). A yeast codon optimized hydrogen peroxide sensor, HyPer-3 (Bilan et al., 2013), and its redox insensitive mutant HyPer-3 C199S, were synthesized (Integrated DNA Technologies) with flanking attB Gateway recombination sites, and cloned into pAG415 GPD-ccdb by BP/LR Clonase Gateway reactions (Thermo Fisher). All DNA constructs were verified by Sanger sequencing (GENEWIZ).
Genome-Wide Screens
The high-copy suppressor screen in Figure 1 was performed in a vph2Δ strain using the Prelich Yeast Genomic Tiling Collection (Dharmacon), which consists of 1,589 plasmids containing sequence-verified genome fragments covering all yeast protein coding genes cloned into high copy plasmid pGP564 (Jones et al., 2008). A pooled plasmid library was prepared by culturing arrayed E. coli strains in deep well 96-well plates, followed by culture pooling and plasmid extraction using standard plasmid purification techniques. For screening, vph2Δ cells were transformed with 1 μg of pooled library and transformants were recovered on SD-leu agar plates for 1 day, followed by replica plating onto YPG agar plates. 1 × 10⁴ total colonies were screened. Colonies were counterscreened by colony PCR for VPH2 to remove plasmids that directly complemented the genetic lesion. Thirteen colonies negative for VPH2 were recovered. Plasmids were purified by miniprep of spheroplasted yeast followed by amplification by transformation and isolation from E. coli. In total, plasmid YGPM32b05 containing FET4 was recovered 8 times, and 5 additional plasmids were recovered a single time (YGPM 2i13, 14n23, 21n09, 27n08, and 14n23).
The deletion collection screen was conducted using the Yeast Homozygous Diploid Collection (Dharmacon) (Giaever et al., 2002; Winzeler et al., 1999). Library strains were grown to saturation in 96-well plate format in YPD for two days. 1 ul of each saturated culture was inoculated into 200 ul YPD, and cultures were grown to log-phase for 4 hours. 2 ul of each log-phase culture were spotted on YPG plates with and without concA (500 nM) and allowed to grow for 4 days before scoring growth.
Yeast Serial-Dilution Growth Assays
Five-fold serial dilutions of exponentially growing yeast cells were prepared in water and 3 μl of each dilution was spotted onto the agar medium denoted in each Figure Legend. Total cells plated in each dilution spot were 5,000, 1,000, 200, 40, and 8.
Isolation of Aged Yeast Cells
Yeast cells were aged and purified as previously described (Hughes and Gottschling, 2012). Briefly, 2.5 × 10⁷ cells from a 15-hour YPAD exponentially growing log-phase culture were washed twice in phosphate buffered saline, pH 7.4 (PBS), and resuspended in PBS containing 3 mg/ml Sulfa-NHS-LC-Biotin (Pierce) at a final concentration of 2.5 × 10⁷ cells/ml. Cells were incubated for 30 minutes, then washed twice in PBS and once in YPAD. Biotinylated cells were then seeded in YPAD at a final density of 1 × 10⁴ cells/ml. Cell densities of these cultures never surpassed 1 × 10⁷ cells/ml. Cells were collected by centrifugation, washed twice, resuspended at a density of 2 × 10⁸ cells/ml in PBS, and incubated for 30 minutes with 50 μl streptavidin-coated magnetic beads (MicroMACS, Miltenyi Biotec). After incubation, cells were washed twice with PBS, and loaded onto an equilibrated LS MACS column (Miltenyi Biotec). Columns were washed twice and cells eluted in PBS. After elution, cells were pelleted and resuspended in YPD for a one-hour recovery incubation at 30°C before microscopy. Age of purified yeast cells was determined by calcofluor staining of bud scars using Fluorescent Brightener 28 (Sigma Aldrich). Young cell fractions were obtained by collecting the flow through of unlabeled young cells that eluted from the LS MACS column on the first pass.
Microscopy
Images (except where noted below) were acquired with an AxioImager M2 (Carl Zeiss) equipped with an Axiocam 506 monochromatic camera (Carl Zeiss) and a 63x oil-immersion objective (Carl Zeiss, Plan Apochromat, NA 1.4), or with an EVOS FL Auto (Thermo Fisher) equipped with an 60x oil-immersion objective (Olympus, Plan Apochromat, NA 1.42). Images in Figure 1 were acquired using an LSM800 (Carl Zeiss) equipped with an Airyscan detector and a 63x oil-immersion objective (Carl Zeiss, Plan Apochromat, NA 1.4). Time-lapse imaging was carried out with an LSM880 (Carl Zeiss) equipped with an Airyscan detector (Carl Zeiss), a 63x oil-immersion objective (Carl Zeiss, Plan Apochromat, NA 1.4), and an environmental chamber set at 30°C (Carl Zeiss). Images were acquired with ZEN software (Carl Zeiss) or EVOS software (Thermo Fisher) and processed with Fiji (Schindelin et al., 2012). Image panels depicting mitochondrial morphology were individually contrast enhanced, while all others where processed identically.
DiOC6 Staining for Microscopy
DiOC6 staining was carried out according to manufacturer’s instructions. Briefly, 2 × 10⁶ logarithmically growing cells were washed once in 10 mM HEPES, pH 7.6, plus 5% glucose and resuspended in 1 ml of the same buffer containing 175 nM DiOC6. Cells were incubated for 15 min at room temperature and then washed twice with 10 mM HEPES, pH 7.6, plus 5% glucose. Cells were resuspended in 10 mM HEPES, pH 7.6, plus 5% glucose for image acquisition.
Quantification of Mitochondrial Morphology
Z-stack images were acquired on an AxioImager M2 and maximum intensirty projections processed in Fiji. Cells with tubular, well connected mitochondrial morphologies were scored as reticular. Cells with fragmented, aggregated, or spherical mitochondrial morphologies were scored as aggregated/fragmented. Analysis of mitochondrial morphology in young and old cells in Figure 7 was performed identically.
Time-lapse Imaging
Yeast were pretreated with conditions indicated in Figure Legends for 45 minutes and then flowed through concanavalin A-coated homemade microscopy chambers made from standard microscope slides, coverslips, and parafilm as previously described (Fees et al., 2017). Cells were allowed to adhere for 5 minutes at room temperature, after which the medium was replaced with SD + casein amino acids with or without the indicated drug treatment, and chambers were sealed with vaseline. Time-lapse images were acquired on an Airyscan LSM880 equipped with an environmental chamber set at 30°C. Z-stacks were obtained every minute for 105 m inutes. Automated Airyscan processing was performed in Zen. Movies are maximum intensity projections of Z-stacks made in Fiji.
Aft1 Translocation Assay
Images of AHY2977 (Aft1-GFP/Srm1-mCherry) yeast treated as described in the text were taken on an EVOS FL Auto, with each image containing >15 cells. In Fiji, the SRM1 channel was thresholded at identical pixel intensities for all images and these binary images were used to determine the boundaries of each nucleus, which were overlaid on the Aft1-yeGFP channel. The mean Aft1-yeGFP fluorescence intensity of each nucleus was measured and plotted. There was little to no variance in measurements between pictures of the same culture. Representative pictures for image panels were acquired on an AxioImager M2 and processed identically in Fiji.
Tsa1 Foci Quantification
TSA1-GFP expressing strains treated as described in the text were imaged on an AxioImager M2. Three Z-stacks per culture were acquired, each containing >30 cells per field of view. Maximum intensity projections were thresholded identically and particles counted in Fiji and scored as foci.
Flow Cytometry
Cells were analyzed on a BD Celeste FACSCelesta or a FACSCanto with BD FACSDiva 8.0.1.1 (BD Biosciences, San Jose, CA), which are maintained by the University of Utah Flow Cytometry Facility. Cells were differentiated from debris by forward scatter and side scatter. Unless otherwise indicated, the fluorescence of 1 × 10⁴ cells was analyzed per sample. The median fluorescence value was used for bar graphs to minimize effects from outliers and non-linearity of photomultiplier tubes. Data analysis was carried out in FlowJo.
DiOC6 Staining for Flow Cytometry Analysis
DiOC6 staining was carried out to measure mitochondrial membrane potential as described above in BY4741 yeast. DiOC6 fluorescence was measured on a FACSCelesta with a 488 nM laser and 530/30 bandpass (FITC) emission filter.
FIT2pr-GFP Aft1 Reporter Assay
For young cell assays, Aft1 reporter yeast (AHY2993 and derivatives) containing the FIT2pr-GFP transgene were treated as indicated in the text, washed, and resuspended in optically inert SD medium. GFP fluorescence was measured on a FACSCelesta with a 488 nM laser and 530/30 bandpass (FITC) emission filter.
To analyze FIT2pr-GFP expression in aged yeast (Figure 7), 2.5 × 10⁴ cells were washed twice in PBS and resuspended in PBS containing 100 μg/ml Alexa Fluor - 660 NHS-Ester (Thermo Fisher) for 30 minutes at room temperature to fluorescently label the cell wall of young cells. Labelled yeast were inoculated into 100 ml of the indicated medium, and grown for 12–16 hours. Cells pellets were collected by centrifugation, washed 1X in SD medium, resuspended at a concentration of 5.0 × 10¹⁰ cells/ml in SD, and analyzed by flow cytometry. Old cells, which retain their cell wall fluorescent label throughout their lifespan, were differentiated from newborn young cells by AlexaFluor 660 fluorescence on a FACSCelesta using a 640 nM laser and a 670/30 bandpass (APC) emission filter. FIT2pr-GFP Aft1 reporter activity was determined by GFP fluorescence with a 488 nM laser and 530/30 bandpass (FITC) emission filter. Control experiments were run to ensure there was no bleed-through between the Aft1 GFP reporter and the AlexaFluor 660 and that old cells were not autofluorescent. The gate for AlexaFluor 660 positive cells was set to mirror the expected percentage of old cells in the population after aging (0.02%). 5 × 10³ old cells were analyzed per experiment. Estimated ages of old cells were obtained by counting bud scars of aged yeast obtained from a parallel biotinylated culture as described above in the isolation of aged yeast section.
HyPer-3 Measurement of Cytoplasmic Hydrogen Peroxide
BY4741 transformed with HyPer-3 pAG415 GPD or HyPer-3 C199S pAG415 GPD were treated as described in the text, and ratiometric changes in HyPer-3 were measured by flow cytometry on a FACSCelesta. HyPer-3 in the reduced state was measured with a 405 nm laser and a 525/50 bandpass (BV510) filter, while oxidized HyPer-3 was measured with a 488 nm laser and a 530/30 bandpass (FITC) filter. The HyPer-3 C199S mutant was treated and measured in parallel to control for changes in cytoplasmic pH. The ratio of oxidized/reduced HyPer-3 was calculated in FlowJo.
Mitochondrial Fractionation
Crude yeast mitochondria fractions were prepared from 1 × 10¹⁰ cells as previously described (Van Vranken et al., 2016). Yeast were grown and treated as described in the text, harvested, washed with ddH20, and incubated in TD buffer (100 mM Tris-SO4, pH 9.4 and 100 mM DTT) for 15 minutes at 30°C. Yeast w ere spheroplasted by incubation in SP buffer (1.2 M sorbitol and 20 mM potassium phosphate, pH 7.4) supplemented with lyticase (2 mg/g of cell pellet) (Sigma-Aldrich) for 1 hour at 30°C. All subsequent steps were carried out on ice or at 4°C. Spheroplas ts were washed once and homogenized in ice-cold SH buffer (1.2 M sorbitol, 20 mM HEPES-KOH, pH 7.4, 2 mM MgCl2, 1 mM EGTA, and 1 mM PMSF) with 20 strokes of a dounce homogenizer. The crude mitochondrial fraction was obtained by differential centrifugation. In short, cell debris was removed by two 3,000xg 5-minute centrifugations, and the resulting supernatant was centrifuged twice at 10,000xg for 10 minutes to pellet mitochondria. Mitochondrial protein content was determined by bicinchoninic acid (BCA) assay (Thermo Fisher).
For ICP-MS measurements, mitochondria were further purified on a continuous Nycodenz (Nycodenz = Histodenz (Sigma-Aldrich)) gradient. Gradients were made by layering 2.1 ml of 5, 10, 15, 20, and 25% Nycodenz which were allowed to diffuse by incubation at room temperature for 3–4 hours. Crude mitochondria were loaded on top of the chilled gradient and separated by centrifugation at 100,000×g for 1 hour. Intact purified mitochondria were recovered from a brown band at around 16% Nycodenz concentration.
Western Blotting
Western blotting of whole-cell yeast extracts was carried out as described previously (Hughes et al., 2016). 2 × 10⁷ yeast cells were harvested, washed in ddH20, and incubated in NaOH (0.1 M) for 5 minutes. Cells were pelleted by a 10-minute, 20,000×g spin at 4°C and resuspended in SDS lysis buffer (10 mM Tris-HCl pH 6.8, 100 mM NaCl, 1% SDS, 1 mM EGTA, 1 mM EDTA, 1x cOmplete protease inhibitors) and incubated for 10 minutes. Extracts were prepared for electorphoresis by incubating in SDS-PAGE loading buffer (30 mM Tris-HCl pH 6.8, 3% SDS, 5% glycerol, 0.004% bromophenol blue, 2.5% β-mercaptoethanol) for 15 minutes at 42°C, and extra cts were clarified by centrifugation at 20,000 × g for 5 minutes. Clarified extracts were resolved on Bolt 4–12% Bis-Tris Plus Gels with MES/SDS buffer (Thermo Fisher) and transferred to nitrocellulose membranes with a Pierce Power Station (Thermo Fisher). Membranes were blocked and probed in blocking buffer (TBS - Tris buffered saline (50 mM Tris-HCl pH 7.4, 150 mM NaCl), 0.05% Tween20, 5% non-fat dry milk) using the primary antibodies listed in the STAR table and HRP conjugated secondary antibodies (Jackson ImmunoResearch). Antibodies were visualized with Supersignal Enhanced Chemiluminescence Solution (dura, pico, or femto) (Thermo Fisher) and film or a Chemidoc MP System (BioRad).
Blue-Native PAGE
Blue-Native PAGE was carried out as previously described (Van Vranken et al., 2016). Crude mitochondria were resuspended in 1x lysis buffer (Thermo Fisher) containing 1% digitonin and 1x cOmplete protease inhibitors and incubated for 15 minutes on ice. Mitochondrial lysates were cleared by centrifugation at 20,000×g for 20 minutes, resolved on NativePAGE 4–16% Bis-Tris Gels (Thermo Fisher), transferred to PVDF membranes with a Criterion Blotter (BioRad), and immunoblotted with TBS + 5% BSA as the blocking buffer.
RITE-Tag Protein Turnover Assays
Tag switching (See Figure S2I schematic) of exponentially growing RITE-tagged yeast strains was induced with β-estradiol (1 μM) (Sigma-Aldrich) as described previously (Hughes et al., 2016; Verzijlbergen et al., 2010). Tag switching was monitored by the presence of RFP fluorescence on an EVOS FL Auto. Cells were treated with or without concA 3 hours after 100% of cells displayed RFP fluorescence to allow for GFP tagged transcripts to be fully turned over. Equal volumes of culture were harvested at each time point, and the stability of GFP tagged proteins was analyzed by western blot. The cell density never surpassed 1 × 10⁷ cells/ml during treatment.
Tsa1 oxidation state by PEG-maleimide modification
Monitoring of Tsa1 oxidation state was adapted from (MacDiarmid et al., 2013). 6 × 10⁷ exponentially growing yeast were harvested, washed in ddH20, washed in ice-cold 10% trichloroacetic acid, and pelleted by centrifugation for 5 min at 14,000xg and 4°C. Cell pellets were resuspended in ice cold 10% trichloroacetic acid and disrupted by micro-bead beating. The precipitated protein was collected by centrifugation for 5 min at 14,00×g and 4°C, and the pellet washed twice with ice cold acetone. The pellet was dried en vacuo, then resuspended in buffer (100 mM Tris-HCl pH 8, 1 % SDS, 1 mM EDTA, 1x cOmplete protease inhibitors) with and without 2 mM PEG-maleimide. Samples treated with PEG-maleimide were incubated in the dark at 37°C for 12 hours, then prepared for western blotting by boiling in SDS-PAGE loading buffer for 5 min at 95°C.
Determination of Tsa1 Hyperoxidation
Protein extracts for measurement of Tsa1-SO3H were prepared as in (Hanzen et al., 2016; Molin et al., 2011). 6 × 10⁷ yeast were disrupted by micro-bead beating in 160 μl ice cold water with 1x cOmplete protease inhibitors. 20 μl of Buffer I (3% SDS, 50% β-mercaptoethanol, 280 mM Tris-HCl, 220 mM Tris) was added and the samples boiled for 5 min at 95°C.
Samples were placed on ice, 20 μl Buffer II (240 mM Tris-HCl, 475 mM Tris, 50 mM MgCl2, 1 mg/ml DNase I) was added, and samples were incubated on ice for 15 min. After clearing the extracts by centrifugation (20,000×g for 15 min at 4°C), supernatants were prepared for western blotting by boiling in SDS-PAGE loading buffer for 5 min at 95°C. After electrophoresis, proteins were transfer red to PVDF membranes with a Criterion Blotter (BioRad) and probed with a Tsa1 Cys48-SO3H specific antibody (Abcam).
Measurement of Protein Side Chain Oxidation
Protein extracts were prepared as for Tsa1 hyperoxidation measurements, and carbonyl groups were derivatized and detected using the OxyBlot Protein Oxidation Detection Kit (Millipore Sigma) as per the manufacturer’s instructions.
Oxygen Consumption
Yeast were treated as indicated in the text and harvested at a density of 1 × 10⁷, collected by centrifugation, and brought up at a density of 2 × 10⁷ in fresh YPD without any drug or amino acid supplement. Yeast were allowed to recover for 15 min at 30°C, then oxygen consumption was measured using a Clark-Type oxygen electrode. The slope of the linear region of the oxygen consumption recording, normalized to cell density, was used as the oxygen consumption rate.
Quantitative PCR
To quantify the expression of iron regulon genes, 2–4 × 10⁷ yeast were lysed via micro-bead beating, and total RNA enriched using RNeasy mini kit (Qiagen). Contaminating DNA was removed by on-column RNase-free DNase (Qiagen) treatment. cDNA was synthesized from 1 μg of total RNA using SuperScript IV First Strand Synthesis (Thermo Fisher) and the Oligo d(T)20 primer. Quantification of gene expression was carried out with KAPA SYBR FAST ROX Low master mix (Kapa Biosystems) on an Applied Biosystems Quantstudio 6 Flex Real-Time PCR system, 384-well. Primerquest (Integrated DNA Technologies, https://www.idtdna.com/Primerquest) was used to design primers, and three primer pairs per target were compared for melt curve analysis, variance, and linearity across a 1 × 10⁴-fold dilution. Actin (ACT1) was used for normalization and relative gene expression was determined by the 2−ΔΔCt method as compared to wild type, DMSO treated yeast. Primers pairs are listed in Table S2.
RNA Sequencing
RNA sequencing (RNA-seq) analysis was conducted with the High-Throughput Genomics and Bioinformatic Analysis Shared Resource at Huntsman Cancer Institute at the University of Utah. For RNA sequencing, RNA was purified from wild type BY4741 yeast as described above in the quantitative PCR section. Total RNA samples (100–500 ng) were hybridized with Ribo-Zero Gold rRNA Removal Kit Yeast (Illumina MRZY1306) to substantially deplete rRNA from the samples. Stranded RNA sequencing libraries were prepared as using the Illumina TruSeq Stranded Total RNA Kit. Purified libraries were qualified on an Agilent Technologies 2200 TapeStation using a D1000 ScreenTape assay. The molarity of adapter-modified molecules was defined by quantitative PCR using the Kapa Biosystems Kapa Library Quant Kit. Individual libraries were normalized to 10 nM and equal volumes were pooled in preparation for Illumina sequence analysis.
Sequencing libraries (25 pM) were chemically denatured and applied to an Illumina HiSeq v4 single read flow cell using an Illumina cBot. Hybridized molecules were clonally amplified and annealed to sequencing primers with reagents from an Illumina HiSeq SR Cluster Kit v4-cBot (GD-401–4001). Following the transfer of the flowcell to an Illumina HiSeq 2500 instrument (HCSv2.2.38 and RTA v1.18.61), a 50-cycle single-read sequence run was performed using HiSeq SBS Kit v4 sequencing reagents (FC-401–4002).
RNA Sequencing Bioinformatics
Sequence reads were trimmed and aligned using STAR (v2.5.2b) (Dobin et al., 2013), with alignIntronMax set to 2000, twopassMode set to Basic, and clip3pAdapterSeq set to AGATCGGAAGAGCACACGTCTGAACTCCAGTCA and AGATCGGAAGAGCGTCGTGTAGGGAAAGAGTGT. Aligned reads were then counted using featurecounts (v1.5.1) (Liao et al., 2014), setting -s equal to 2 for a reversely stranded library. Reads were processed using S. cerevisiae R64-1-1 Ensembl release 90.
Differential expression analysis was performed using DESeq2 (v1.20.0) (Love et al., 2014). Genes differentially expressed at 6 hr concA treatment (FDR < 0.01, |log2FoldChange| > 1) were analyzed using Panther (v14.1) and the Gene Ontology Database (Release 2019-07-03), performed 18 Apr 2019. GO terms were selected using a Fisher’s Exact test (FDR < 0.01) and a selection criterion that required at least 10% of total GO term gene members to be represented in the differential expression analysis.
RNA-seq read counts were RPKM normalized. Heatmaps were generated by gene-standardizing the RPKM values (mean = 0, stdev = 1) and plotting using XPRESSplot v0.0.4-beta (Berg, 2019, doi: 10.1101/704320) and Matplotlib (Hunter, 2007). Scripts used to perform these analyses can be found at https://github.com/j-berg/hughes_rnaseq_2019.
Quantification of Iron via ICP-MS
Total iron analysis was performed at the Iron and Heme Core Facility at the University of Utah. Yeast were harvested and washed twice in metal-free H20. A 5:1 mixture of nitric acid (OPTIMA Grade, 70%, Fisher Scientific) and ultrapure hydrogen peroxide (ULTREX II, 30%, Fisher Scientific) was added to cell pellets. This mixture was allowed to digest overnight, heated until dry, and resuspended in 2% nitric acid for analysis using an Agilent 7900 ICP-MS. Calibration standard solutions for determination of Fe were prepared from Agilent multi-element calibration standard-2A. An Agilent Environmental Calibration Standard was used as an independent control. Buffer-only control digestions were used to measure background. Metal readings were normalized to lysate protein concentration determined using a BCA assay.
Metabolite Extraction
Metabolite extraction and gas chromatography mass spectrometry (GC-MS) analysis were carried out by the University of Utah Metabolomics Core Facility. Yeast pellets were extracted following a previously described method with slight modifications (Canelas et al., 2009). 5 mL of boiling 75% EtOH (aq) was added to each cell pellet, samples were then vortexed and incubated at 90°C fo r five minutes. The EtOH solution contained a mixture of U-13C/U-15N stable isotope labeled amino acids (Cambridge Isotope Laboratories) at 5 ug/sample, and d4-succinate added at 1 ug/sample. Cell debris was removed by centrifugation at 5000×g for three minutes. The supernatant was removed to new tubes and dried en vacuo.
Amino Acid Quantification via GC-MS
All GC-MS analysis was performed with an Agilent 7200 GC-MS QTOF and an Agilent 7693A automatic liquid sampler. Dried samples were suspended in 40 μL of a 40 mg/mL O-methoxylamine hydrochloride (MOX) (MP Biomedicals) in dry pyridine (EMD Millipore) and incubated for one hour at 37 °C in a sand bath. 13 μL of this solution was added to auto sampler vials. 60 μL of N-methyl-N-trimethylsilyltrifluoracetamide (MSTFA with 1%TMCS) (Thermo Fisher) was added automatically via the auto sampler and incubated for 30 minutes at 37 °C. After incubation, samples were vortexed and 1 μL of the prepared sample was injected into the gas chromatograph inlet in the split mode with the inlet temperature held at 250°C. A 50:1 sp lit ratio was used for analysis. For highly abundant metabolites that saturated at the 50:1 split, a split ratio of 100:1 was used for analysis. The gas chromatograph had an initial temperature of 60°C for one minute followed by a 10°C/min ramp to 325°C and a h old time of 2 minutes. A 30-meter Agilent Zorbax DB-5MS with 10 m Duraguard capillary column was employed for chromatographic separation. Helium was used as the carrier gas at a rate of 1 mL/min.
Data was collected using MassHunter software (Agilent). Metabolites were identified and their peak area was recorded using MassHunter Quant. Metabolite identity was established using a combination of an in-house metabolite library developed using pure purchased standards, the NIST library and the Fiehn Library. Values for each metabolite were normalized to the total ion count and the internal standard in each sample and are displayed as fold change to DMSO.
Amplex Red Measurement of in vitro Generated Hydrogen Peroxide
A range of cysteine concentrations was incubated in buffer (50 mM sodium phosphate pH 7.4, 400 nM CuSO4) at 37°C for 1 hour. After incubation, hydrogen pe roxide levels were determined by the oxidation of Amplex Red to resorufin using an Amplex Red Hydrogen Peroxide/Peroxidase Assay Kit (Thermo Fisher). Resorufin was measured by absorbance at 560 nm, and hydrogen peroxide concentrations determined by comparing to a standard curve measured in parallel.
Quantification and Statistical Analysis
The number of replicates, what n represents, precision measurements, and meaning of error bars are indicated in Figure Legends. In general, bar graphs are mean of three biological replicates and error bars represent standard deviation. In experiments with data depicted from a single biological replicate, the experiment was repeated with the same results.
Data and Software Availability
RNA sequencing data was deposited at NCBI Gene Expression Omnibus GEO (accession # GSE133214). Scripts used to perform RNA-seq analysis can be found at https://github.com/j-berg/hughes_rnaseq_2019.
Supplementary Material
Figure S1 (related to Figure 1). Iron Suppresses Mitochondrial Alterations Caused by V-ATPase Inhibition
(A–C) Time-lapse maximum-intensity projection confocal microscopy images of mitochondrial morphology (Tim50-GFP) in untreated (A), concA treated (B), or concA + Fe treated (C) cells. Images are stills from Movies S1–S3. Scale bars = 5 μm.
Figure S2 (related to Figure 2). V-ATPase Deficiency Causes Iron Limitation
(A) Acute V-ATPase inhibition causes nuclear translocation of Aft1. Nuclear intensity of Aft1-GFP quantified from single Z-plane microscopy images of cells expressing nuclear marker Srm1-mCherry treated with concA or BPS for the indicated time. Plotted points = median values ± SD, n=50 cells.
(B) Flow cytometry histogram showing GFP expression from the FIT2 promoter increases after 6 hrs of concA treatment.
(C) Genetic ablation of the V-ATPase activates the Aft1-dependent iron regulon. Flow cytometry analysis of FIT2 promoter-driven GFP expression in wild type and vma1Δ cells treated +/− concA for 6 hrs. Bars = mean ± SD, n=3.
(D) Activation of the Aft1 reporter is similar with complete extracellular iron chelation and V-ATPase inhibition, and requires Aft1. Flow cytometry analysis of FIT2 promoter-driven GFP expression in wild type and aft1Δ cells treated with concA or BPS for 6 hrs. Bars = mean ± SD, n=3.
(E) Iron supplementation suppresses concA-induced activation of the Aft1 regulon. Flow cytometry analysis of FIT2 promoter-driven GFP expression in cells treated with concA and increasing ferrous ammonium sulfate (Fe2+) or ferric chloride (Fe3+) for 6 hrs. Bars = mean ± SD, n=3.
(F) Iron supplementation suppresses concA-induced activation of the Aft1 regulon. Western blot analysis of FIT2 promoter-driven GFP expression in cells treated +/− concA +/− Fe for 6 hrs. Loading control, Pgk1.
(G) FET4 overexpression suppresses activation of the iron regulon. Flow cytometry analysis of FIT2 promoter-driven GFP expression in cells containing an empty vector or overexpressing FET4 grown +/− concA for 6 hrs. Bars = mean ± SD, n=3.
(H) Loss of V-ATPase activity is lethal in combination with mild external iron chelation. Growth assays of wild-type yeast on YPD medium with the indicated treatments. [BPS] = 75 μM.
(I) Acute V-ATPase inhibition destabilizes ISC-containing proteins. GFP versions of the RITE tagged ISC proteins Lys4 and Twy1, and the control protein Pgk1 were switched to RFP with β-estradiol using RITE technology (top panel). After confirmation via microscopy that all cells in the population had stopped producing the GFP tagged versions of the protein, cells were cultured +/− concA. At the indicated times, equal volumes of cells were harvested and levels of GFP tagged proteins were analyzed by Western blot (bottom panel).
Figure S3 (related to Figure 3). Altered Iron Uptake and Protein Degradation Do Not Drive Iron Limitation Upon V-ATPase Impairment
(A) Total intracellular iron levels are stable upon acute V-ATPase inhibition. Yeast containing the FIT2pr-GFP reporter treated with concA for the indicated time were analyzed for GFP expression by Western blot and total iron by ICP-MS. Bars = mean ± SD, n=3.
(B) V-ATPase mutants activate the iron regulon despite containing high iron. The indicated strains containing FIT2pr-GFP were assayed for total iron by ICP-MS and GFP expression by Western blot. Bars = mean ± SD, n=3.
(C) Mitochondrial iron levels decline upon acute V-ATPase inhibition. Isolated mitochondrial fractions from cells treated with concA for 4 hrs were analyzed for total iron by ICP-MS. Bars = mean ± SD, n=3.
(D) Western blot showing purity of nycodenz-isolated mitochondrial fractions analyzed in C. WC = whole cell; M = mitochondria. Por1 = mitochondria, Hsp70 = cytosol, Prc1 = vacuole, Pep12 = Golgi.
(E) Overexpression of MRS3 or MRS4 does not suppress concA-mediated respiratory deficiency. Growth assays of yeast containing empty vector (EV) or overexpressing MRS3 or MRS4 on YPG −/+ concA.
(F) Loss of autophagy or vacuole protein degradation does not cause iron starvation. Flow cytometry analysis of FIT2pr-GFP fluorescence in wild type and the indicated mutant strains. Bars = mean ± SD, n=3.
Figure S4 (related to Figure 4). High Amino Acids Limit Iron Bioavailability
(A) Total intracellular levels of many amino acids are unchanged by V-ATPase inhibition. GC-MS analysis of relative amino acid abundance in wild-type yeast treated +/− concA for 6 hrs. Bars = mean ± SD, n=3.
(B) Iron content of YPD is higher than SD medium. YPD (high AA) and SD (low AA) media was analyzed for iron content by ICP-MS. Bars = mean ± SD, n=3.
(C) Response to mild BPS chelation confirms iron content of YPD medium is higher than SD medium. Flow cytometry analysis of FIT2pr-GFP fluorescence in wild type yeast cultured in the indicated medium treated +/− 50 μM BPS for 6 hrs. Bars = mean ± SD, n=3.
(D) Translation inhibition induces nuclear translocation of Aft1. Nuclear intensity of Aft1-GFP quantified from single Z-plane microscopy images of cells expressing nuclear marker Srm1-mCherry treated with CHX for the indicated time. Plotted points = median values, n=50 cells.
Figure S5 (related to Figure 5). Cysteine and Threonine Limit Iron Bioavailability and Mitochondrial Function Upon V-ATPase Deficiency
(A) Threonine potentiates iron starvation caused by V-ATPase inhibition at higher concentrations. Flow cytometry analysis of FIT2pr-GFP fluorescence in yeast cultured +/− concA for 6 hrs in low AA medium with increasing concentrations of threonine. Plotted values = mean ± SD, n=3.
(B) Diagram of cysteine and threonine metabolic interconnectivity.
(C) Effect of threonine on concA-induced iron starvation is stereoselective. Flow cytometry analysis of FIT2pr-GFP fluorescence in yeast cultured +/− concA for 6 hrs in low AA medium +/− 15 mM L- or D-threonine. Bars = mean ± SD, n=3.
(D) L- and D-threonine are taken up into cells at equal levels. GC-MS analysis of relative threonine abundance in wild-type yeast cultured +/− concA for 6 hrs in low AA medium +/− L- or D-threonine. Bars = mean ± SD, n=3.
(E–G) Other cysteine related metabolites do not cause iron starvation. Flow cytometry analysis of FIT2pr-GFP fluorescence in yeast cultured +/− concA for 6 hrs in low amino acid medium plus the indicated metabolite. Hcy = homocysteine, GSH = glutathione, S-methyl-cys = S-methyl-l-cysteine. Bars = mean ± SD, n=3.
Figure S6 (related to Figure 6). Vacuole Dysfunction Disrupts Iron Homeostasis by Increasing ROS
(A) V-ATPase mutants are sensitive to paraquat in an iron dependent manner. Growth assays of wild type and the indicated mutant strains on YPD medium +/− paraquat +/− Fe.
(B and E) Only high doses of hydrogen peroxide and not concA generate detectable amounts of protein carbonylation. Oxyblots of whole cell lysates treated with concA for the indicated time (B) or the indicated concentration of hydrogen peroxide for 1 hr (E). Pgk1 = loading control.
(C and F) Only high doses of hydrogen peroxide and not concA promote oxidation of HyPer. Oxidized to reduced ratio of Hyper or redox insensitive C199S HyPer expressed in wild type yeast treated with concA for the indicated time (C) or the indicated concentration of hydrogen peroxide for 1 hr (F). Oxidized versus reduced HyPer ratio was calculated as described in Star Methods. Bars = mean ± SD, n=3.
(D and G) Only high doses of hydrogen peroxide and not concA generate detectable amounts of Tsa1 hyperoxidation. Whole cell lysates from wild type or tsa1Δ yeast treated with concA for the indicated time (D) or the indicated concentration of hydrogen peroxide for 1 hr (G) subjected to Western blotting with antibodies against the normal or hyperoxidized forms of Tsa1 (Tsa1 or Tsa1-SO3H). Pgk1 = loading control. (H and I) Tsa1-GFP foci are oxygen dependent. Quantification of Tsa1-GFP foci produced by upon treatment with concA (H) or cysteine (I) for 18 hrs in the presence or absence of oxygen.
(J) Many oxidative stress transcripts induced by V-ATPase inhibition are Skn7-dependent. qPCR showing fold change of the indicated genes after 1 hr concA treatment in wild-type and skn7Δ strains. Values expressed relative to wild type DMSO treated. Bars = mean ± SD, n=3.
(K) Loss of SKN7 enhances concA-induced iron starvation. Flow cytometry analysis of FIT2pr-GFP fluorescence in wild type and skn7Δ yeast treated +/− concA for 6 hrs. Bars = mean ± SD, n=3.
(L) Overexpression of antioxidant genes suppresses iron starvation upon V-ATPase inhibition. Flow cytometry analysis of FIT2pr-GFP fluorescence in wild-type strains expressing empty vector or overexpressing a combination of SOD1 and TSA1 treated +/− concA for 6 hrs. Bars = mean ± SD, n=3.
(M) Oxygen restriction suppresses iron starvation induced by V-ATPase depletion. Flow cytometry analysis of FIT2pr-GFP fluorescence in wild-type and vma1Δ yeast grown in the presence (aerobic) or absence (anaerobic) of oxygen for 18 hrs. Bars = mean ± SD, n=3.
(N) Iron supplementation does not suppress concA-induced Tsa1 foci. Quantification of Tsa1-GFP foci from maximum intensity projection images of cells grown +/− concA +/− Fe for 1.5 hrs. Bars = mean ± SD, n=3.
(O) Iron supplementation does not suppress concA-induced expression of oxidative stress transcripts. qPCR showing fold change of SRX1 after 1 hr of concA treatment +/− Fe. Values expressed relative to DMSO treated. Bars = mean ± SD, n=3.
Movie S1. Related to Figures 1 and S1. Time-Lapse Imaging of Mitochondria in Untreated Cells
Maximum-intensity projection movie of yeast mitochondria visualized with Tim50-GFP. Cells were imaged every minute from 45 to 150 minutes after resuspension in imaging medium (SD + 2% casein amino acids). Movie speed = 12 frames/second.
Movie S2. Related to Figures 1 and S1. Time-Lapse Imaging of Mitochondrial Structure Alterations Upon Acute V-ATPase Inhibition
Maximum-intensity projection movie of yeast mitochondria visualized with Tim50-GFP. Cells were imaged every minute from 45 to 150 minutes after resuspension in imaging medium containing concA. Movie speed = 12 frames/second.
Movie S3. Related to Figures 1 and S1. Time-Lapse Imaging Showing Iron Suppresses V-ATPase-Inhibition Mediated Mitochondrial Structural Alterations
Maximum-intensity projection movie of yeast mitochondria visualized with Tim50-GFP. Cells were imaged every minute from 45 to 150 minutes after resuspension in imaging medium containing concA + Fe. Movie speed = 12 frames/second.
Table S1. Related to Figures 3 and 6. Gene Expression Data Set from RNA Sequencing Experiments
Table includes tabs with raw sequencing reads, fold-change (log2) and p-value (−log10) for all genes at each concA timepoint (0, 1, 3, 6 hours).
Table S2. Related to STAR Methods. Oligonucleotides Used in This Study
Elevated cysteine disrupts mitochondrial respiration in vacuole-impaired cells
Cysteine inhibits mitochondrial function by limiting iron bioavailability
Vacuoles sequester cysteine to promote efficient mitochondrial respiration
Cysteine restriction or iron supplementation sustains mitochondrial health in aging
ACKNOWLEDGEMENTS
We thank Janet Shaw (University of Utah) and members of the Hughes and Shaw labs for insightful discussions and critical review of the manuscript, Roland Lill (Philipps-Universität Marburg), Alexander Tzagoloff (Columbia University) and Kostas Tokatlidis (University of Glasgow) for antibodies, Jared Rutter (University of Utah), Dan Gottschling (Calico) and Fred van Leeuwen (Netherlands Cancer Institute) for strains and plasmids, and Markus Babst (Utah) for assistance with oxygen consumption measurements. Portions of this research were conducted in conjunction with the University of Utah’s Flow Cytometry Facility (supported by NIH award CA042014), Iron and Heme Core Facility (supported by NIH award DK110858), Metabolomics Core Facility (supported by NIH awards OD016232, OD021505 and DK110858), and the Huntsman Cancer Institute’s High-Throughput Genomics and Bioinformatic Analysis Shared Resource (supported by NIH award CA042014). Research was also supported by a pilot project award from the Utah Center for Iron and Heme Disorders (DK110858) and NIH awards AG043095, GM119694, AG061376, and AG055648 to A.L.H., NIH award GM110755 to D.R.W., NIH T32 DK091317 to T.K.C., NIH T32 DK007115 to C.E.H., and NIH T32 DK110966 to J.A.B. A.L.H. was further supported by an American Federation for Aging Research Junior Research Grant, a Searle Scholars Award, and a Glenn Foundation for Medical Research Award.
Footnotes
Publisher's Disclaimer: This is a PDF file of an unedited manuscript that has been accepted for publication. As a service to our customers we are providing this early version of the manuscript. The manuscript will undergo copyediting, typesetting, and review of the resulting proof before it is published in its final form. Please note that during the production process errors may be discovered which could affect the content, and all legal disclaimers that apply to the journal pertain.
DECLARATION OF INTERESTS
The authors declare no competing interests.
REFERENCES
- Abu-Remaileh M, Wyant GA, Kim C, Laqtom NN, Abbasi M, Chan SH, Freinkman E, and Sabatini DM (2017). Lysosomal metabolomics reveals V-ATPase- and mTOR-dependent regulation of amino acid efflux from lysosomes. Science 358, 807–813. [DOI] [PMC free article] [PubMed] [Google Scholar]
- Alberti S, Gitler AD, and Lindquist S (2007). A suite of Gateway cloning vectors for high-throughput genetic analysis in Saccharomyces cerevisiae. Yeast 24, 913–919. [DOI] [PMC free article] [PubMed] [Google Scholar]
- Aldini G, Altomare A, Baron G, Vistoli G, Carini M, Borsani L, and Sergio F (2018). N-Acetylcysteine as an antioxidant and disulphide breaking agent: the reasons why. Free Radic Res 52, 751–762. [DOI] [PubMed] [Google Scholar]
- Aliu E, Kanungo S, and Arnold GL (2018). Amino acid disorders. Ann Transl Med 6, 471. [DOI] [PMC free article] [PubMed] [Google Scholar]
- Ashraf A, Clark M, and So PW (2018). The Aging of Iron Man. Front Aging Neurosci 10, 65. [DOI] [PMC free article] [PubMed] [Google Scholar]
- Assali EA, Shlomo D, Zeng J, Taddeo EP, Trudeau KM, Erion KA, Colby AH, Grinstaff MW, Liesa M, Las G, et al. (2018). Nanoparticle-mediated lysosomal reacidification restores mitochondrial turnover and function in beta cells under lipotoxicity. FASEB J 33, 4154–4165. [DOI] [PMC free article] [PubMed] [Google Scholar]
- Audano M, Schneider A, and Mitro N (2018). Mitochondria, lysosomes, and dysfunction: their meaning in neurodegeneration. J Neurochem 147, 291–309. [DOI] [PubMed] [Google Scholar]
- Avcilar-Kucukgoze I, Bartholomäus A, Cordero Varela JA, Kaml RF-X, Neubauer P, Budisa N, and Ignatova Z (2016). Discharging tRNAs: a tug of war between translation and detoxification in Escherichia coli. Nucleic acids research 44, 8324–8334. [DOI] [PMC free article] [PubMed] [Google Scholar]
- Beugnet A, Tee AR, Taylor PM, and Proud CG (2003). Regulation of targets of mTOR (mammalian target of rapamycin) signalling by intracellular amino acid availability. The Biochemical journal 372, 555–566. [DOI] [PMC free article] [PubMed] [Google Scholar]
- Bilan DS, Pase L, Joosen L, Gorokhovatsky AY, Ermakova YG, Gadella TW, Grabher C, Schultz C, Lukyanov S, and Belousov VV (2013). HyPer-3: a genetically encoded H(2)O(2) probe with improved performance for ratiometric and fluorescence lifetime imaging. ACS Chem Biol 8, 535–542. [DOI] [PubMed] [Google Scholar]
- Brachmann CB, Davies A, Cost GJ, Caputo E, Li J, Hieter P, and Boeke JD (1998). Designer deletion strains derived from Saccharomyces cerevisiae S288C: a useful set of strains and plasmids for PCR-mediated gene disruption and other applications. Yeast 14, 115–132. [DOI] [PubMed] [Google Scholar]
- Braymer JJ, and Lill R (2017). Iron-sulfur cluster biogenesis and trafficking in mitochondria. J Biol Chem 292, 12754–12763. [DOI] [PMC free article] [PubMed] [Google Scholar]
- Bus JS, and Gibson JE (1984). Paraquat: model for oxidant-initiated toxicity. Environ Health Perspect 55, 37–46. [DOI] [PMC free article] [PubMed] [Google Scholar]
- Canelas AB, ten Pierick A, Ras C, Seifar RM, van Dam JC, van Gulik WM, and Heijnen JJ (2009). Quantitative evaluation of intracellular metabolite extraction techniques for yeast metabolomics. Anal Chem 81, 7379–7389. [DOI] [PubMed] [Google Scholar]
- Chandel NS (2014). Mitochondria as signaling organelles. BMC biology 12, 34. [DOI] [PMC free article] [PubMed] [Google Scholar]
- Chen OS, Crisp RJ, Valachovic M, Bard M, Winge DR, and Kaplan J (2004). Transcription of the yeast iron regulon does not respond directly to iron but rather to iron-sulfur cluster biosynthesis. J Biol Chem 279, 29513–29518. [DOI] [PubMed] [Google Scholar]
- Cherest H, Eichler F, and Robichon-Szulmajster H (1969). Genetic and regulatory aspects of methionine biosynthesis in Saccharomyces cerevisiae. Journal of bacteriology 97, 328–336. [DOI] [PMC free article] [PubMed] [Google Scholar]
- Colacurcio DJ, and Nixon RA (2016). Disorders of lysosomal acidification-the emerging role of v-ATPase in aging and neurodegenerative disease. Ageing research reviews 32, 75–88. [DOI] [PMC free article] [PubMed] [Google Scholar]
- Cowart RE, Singleton FL, and Hind JS (1993). A comparison of bathophenanthrolinedisulfonic acid and ferrozine as chelators of iron(II) in reduction reactions. Anal Biochem 211, 151–155. [DOI] [PubMed] [Google Scholar]
- Cui T-Z, Smith PM, Fox JL, Khalimonchuk O, and Winge DR (2012). Late-stage maturation of the Rieske Fe/S protein: Mzm1 stabilizes Rip1 but does not facilitate its translocation by the AAA ATPase Bcs1. Molecular and cellular biology 32, 4400–4409. [DOI] [PMC free article] [PubMed] [Google Scholar]
- Davis-Kaplan SR, Askwith CC, Bengtzen AC, Radisky D, and Kaplan J (1998). Chloride is an allosteric effector of copper assembly for the yeast multicopper oxidase Fet3p: an unexpected role for intracellular chloride channels. Proceedings of the National Academy of Sciences of the United States of America 95, 13641–13645. [DOI] [PMC free article] [PubMed] [Google Scholar]
- Davis-Kaplan SR, Ward DM, Shiflett SL, and Kaplan J (2004). Genome-wide analysis of iron-dependent growth reveals a novel yeast gene required for vacuolar acidification. J Biol Chem 279, 4322–4329. [DOI] [PubMed] [Google Scholar]
- de la Mata M, Cotan D, Villanueva-Paz M, de Lavera I, Alvarez-Cordoba M, Luzon-Hidalgo R, Suarez-Rivero JM, Tiscornia G, and Oropesa-Avila M (2016). Mitochondrial Dysfunction in Lysosomal Storage Disorders. Diseases 4, pii: E31. [DOI] [PMC free article] [PubMed] [Google Scholar]
- Deshpande AA, Bhatia M, Laxman S, and Bachhawat AK (2017). Thiol trapping and metabolic redistribution of sulfur metabolites enable cells to overcome cysteine overload. Microb Cell 4, 112–126. [DOI] [PMC free article] [PubMed] [Google Scholar]
- Diab HI, and Kane PM (2013). Loss of vacuolar H+-ATPase (V-ATPase) activity in yeast generates an iron deprivation signal that is moderated by induction of the peroxiredoxin TSA2. J Biol Chem 288, 11366–11377. [DOI] [PMC free article] [PubMed] [Google Scholar]
- Dimmer KS, Fritz S, Fuchs F, Messerschmitt M, Weinbach N, Neupert W, and Westermann B (2002). Genetic basis of mitochondrial function and morphology in Saccharomyces cerevisiae. Molecular biology of the cell 13, 847–853. [DOI] [PMC free article] [PubMed] [Google Scholar]
- Dix DR, Bridgham JT, Broderius MA, Byersdorfer CA, and Eide DJ (1994). The FET4 gene encodes the low affinity Fe(II) transport protein of Saccharomyces cerevisiae. J Biol Chem 269, 26092–26099. [PubMed] [Google Scholar]
- Djaman O, Outten FW, and Imlay JA (2004). Repair of oxidized iron-sulfur clusters in Escherichia coli. J Biol Chem 279, 44590–44599. [DOI] [PubMed] [Google Scholar]
- Dobin A, Davis CA, Schlesinger F, Drenkow J, Zaleski C, Jha S, Batut P, Chaisson M, and Gingeras TR (2013). STAR: ultrafast universal RNA-seq aligner. Bioinformatics 29, 15–21. [DOI] [PMC free article] [PubMed] [Google Scholar]
- Drose S, Bindseil KU, Bowman EJ, Siebers A, Zeeck A, and Altendorf K (1993). Inhibitory effect of modified bafilomycins and concanamycins on P- and V-type adenosinetriphosphatases. Biochemistry 32, 3902–3906. [DOI] [PubMed] [Google Scholar]
- Elbaz-Alon Y, Rosenfeld-Gur E, Shinder V, Futerman AH, Geiger T, and Schuldiner M (2014). A dynamic interface between vacuoles and mitochondria in yeast. Developmental cell 30, 95–102. [DOI] [PubMed] [Google Scholar]
- Fees CP, Estrem C, and Moore JK (2017). High-resolution Imaging and Analysis of Individual Astral Microtubule Dynamics in Budding Yeast. J Vis Exp, 122. [DOI] [PMC free article] [PubMed] [Google Scholar]
- Feng Y, He D, Yao Z, and Klionsky DJ (2014). The machinery of macroautophagy. Cell research 24, 24–41. [DOI] [PMC free article] [PubMed] [Google Scholar]
- Ferguson SM (2015). Beyond indigestion: emerging roles for lysosome-based signaling in human disease. Current opinion in cell biology 35, 59–68. [DOI] [PMC free article] [PubMed] [Google Scholar]
- Flynn SM, Clydesdale FM, and Zajicek OT (1984). Complexation, Stability and Behavior of L-Cysteine and L-Lysine with Different Iron Sources. J Food Prot 47, 36–40. [DOI] [PubMed] [Google Scholar]
- Forgac M (2007). Vacuolar ATPases: rotary proton pumps in physiology and pathophysiology. Nat Rev Mol Cell Biol 8, 917–929. [DOI] [PubMed] [Google Scholar]
- Friedman JR, and Nunnari J (2014). Mitochondrial form and function. Nature 505, 335–343. [DOI] [PMC free article] [PubMed] [Google Scholar]
- Gangloff SP, Marguet D, and Lauquin GJ (1990). Molecular cloning of the yeast mitochondrial aconitase gene (ACO1) and evidence of a synergistic regulation of expression by glucose plus glutamate. Molecular and cellular biology 10, 3551–3561. [DOI] [PMC free article] [PubMed] [Google Scholar]
- Giaever G, Chu AM, Ni L, Connelly C, Riles L, Veronneau S, Dow S, Lucau-Danila A, Anderson K, Andre B, et al. (2002). Functional profiling of the Saccharomyces cerevisiae genome. Nature 418, 387–391. [DOI] [PubMed] [Google Scholar]
- Hanzen S, Vielfort K, Yang J, Roger F, Andersson V, Zamarbide-Fores S, Andersson R, Malm L, Palais G, Biteau B, et al. (2016). Lifespan Control by Redox-Dependent Recruitment of Chaperones to Misfolded Proteins. Cell 166, 140–151. [DOI] [PubMed] [Google Scholar]
- Hazelwood LA, Daran JM, van Maris AJ, Pronk JT, and Dickinson JR (2008). The Ehrlich pathway for fusel alcohol production: a century of research on Saccharomyces cerevisiae metabolism. Appl Environ Microbiol 74, 2259–2266. [DOI] [PMC free article] [PubMed] [Google Scholar]
- Henne WM, Buchkovich NJ, and Emr SD (2011). The ESCRT pathway. Developmental cell 21, 77–91. [DOI] [PubMed] [Google Scholar]
- Hirata R, Ohsumk Y, Nakano A, Kawasaki H, Suzuki K, and Anraku Y (1990). Molecular structure of a gene, VMA1, encoding the catalytic subunit of H(+)-translocating adenosine triphosphatase from vacuolar membranes of Saccharomyces cerevisiae. J Biol Chem 265, 6726–6733. [PubMed] [Google Scholar]
- Honscher C, Mari M, Auffarth K, Bohnert M, Griffith J, Geerts W, van der Laan M, Cabrera M, Reggiori F, and Ungermann C (2014). Cellular metabolism regulates contact sites between vacuoles and mitochondria. Developmental cell 30, 86–94. [DOI] [PubMed] [Google Scholar]
- Hughes AL, and Gottschling DE (2012). An early age increase in vacuolar pH limits mitochondrial function and lifespan in yeast. Nature 492, 261–265. [DOI] [PMC free article] [PubMed] [Google Scholar]
- Hughes AL, Hughes CE, Henderson KA, Yazvenko N, and Gottschling DE (2016). Selective sorting and destruction of mitochondrial membrane proteins in aged yeast. eLife 5, pii: e13943. [DOI] [PMC free article] [PubMed] [Google Scholar]
- Huh W-K, Falvo JV, Gerke LC, Carroll AS, Howson RW, Weissman JS, and O’Shea EK (2003). Global analysis of protein localization in budding yeast. Nature 425, 686–691. [DOI] [PubMed] [Google Scholar]
- Hunter JD (2007). Matplotlib: A 2D graphics environment. Computing in Science and Engineering 9, 90–95. [Google Scholar]
- Jackson DD, and Stevens TH (1997). VMA12 encodes a yeast endoplasmic reticulum protein required for vacuolar H+-ATPase assembly. J Biol Chem 272, 25928–25934. [DOI] [PubMed] [Google Scholar]
- Jensen LT, and Culotta VC (2002). Regulation of Saccharomyces cerevisiae FET4 by oxygen and iron. Journal of Molecular Biology 318, 251–260. [DOI] [PubMed] [Google Scholar]
- Jones EW, Zubenko GS, and Parker RR (1982). PEP4 gene function is required for expression of several vacuolar hydrolases in Saccharomyces cerevisiae. Genetics 102, 665–677. [DOI] [PMC free article] [PubMed] [Google Scholar]
- Jones GM, Stalker J, Humphray S, West A, Cox T, Rogers J, Dunham I, and Prelich G (2008). A systematic library for comprehensive overexpression screens in Saccharomyces cerevisiae. Nat Methods 5, 239–241. [DOI] [PubMed] [Google Scholar]
- Kim HS, Mendiratta S, Kim J, Pecot CV, Larsen JE, Zubovych I, Seo BY, Kim J, Eskiocak B, Chung H, et al. (2013). Systematic identification of molecular subtype-selective vulnerabilities in non-small-cell lung cancer. Cell 155, 552–566. [DOI] [PMC free article] [PubMed] [Google Scholar]
- Kitamoto K, Yoshizawa K, Ohsumi Y, and Anraku Y (1988). Dynamic aspects of vacuolar and cytosolic amino acid pools of Saccharomyces cerevisiae. Journal of bacteriology 170, 2683–2686. [DOI] [PMC free article] [PubMed] [Google Scholar]
- Klionsky DJ, Herman PK, and Emr SD (1990). The fungal vacuole: composition, function, and biogenesis. Microbiological reviews 54, 266–292. [DOI] [PMC free article] [PubMed] [Google Scholar]
- Kroemer G, López-Otín C, Madeo F, and de Cabo R (2018). Carbotoxicity-Noxious Effects of Carbohydrates. Cell 175, 605–614. [DOI] [PMC free article] [PubMed] [Google Scholar]
- Kumar A, John L, Alam MM, Gupta A, Sharma G, Pillai B, and Sengupta S (2006). Homocysteine- and cysteine-mediated growth defect is not associated with induction of oxidative stress response genes in yeast. The Biochemical journal 396, 61–69. [DOI] [PMC free article] [PubMed] [Google Scholar]
- Lawrence RE, and Zoncu R (2019). The lysosome as a cellular centre for signalling, metabolism and quality control. Nature cell biology 21, 133–142. [DOI] [PubMed] [Google Scholar]
- Li SC, and Kane PM (2009). The yeast lysosome-like vacuole: endpoint and crossroads. Biochim Biophys Acta 1793, 650–663. [DOI] [PMC free article] [PubMed] [Google Scholar]
- Liao Y, Smyth GK, and Shi W (2014). featureCounts: an efficient general purpose program for assigning sequence reads to genomic features. Bioinformatics 30, 923–930. [DOI] [PubMed] [Google Scholar]
- Liu JQ, Nagata S, Dairi T, Misono H, Shimizu S, and Yamada H (1997). The GLY1 gene of Saccharomyces cerevisiae encodes a low-specific L-threonine aldolase that catalyzes cleavage of L-allo-threonine and L-threonine to glycine--expression of the gene in Escherichia coli and purification and characterization of the enzyme. Eur J Biochem 245, 289–293. [DOI] [PubMed] [Google Scholar]
- Ljungdahl PO, and Daignan-Fornier B (2012). Regulation of amino acid, nucleotide, and phosphate metabolism in Saccharomyces cerevisiae. Genetics 190, 885–929. [DOI] [PMC free article] [PubMed] [Google Scholar]
- Love MI, Huber W, and Anders S (2014). Moderated estimation of fold change and dispersion for RNA-seq data with DESeq2. Genome Biol 15, 550. [DOI] [PMC free article] [PubMed] [Google Scholar]
- MacDiarmid CW, Taggart J, Kerdsomboon K, Kubisiak M, Panascharoen S, Schelble K, and Eide DJ (2013). Peroxiredoxin chaperone activity is critical for protein homeostasis in zinc-deficient yeast. J Biol Chem 288, 31313–31327. [DOI] [PMC free article] [PubMed] [Google Scholar]
- Merz S, and Westermann B (2009). Genome-wide deletion mutant analysis reveals genes required for respiratory growth, mitochondrial genome maintenance and mitochondrial protein synthesis in Saccharomyces cerevisiae. Genome Biol 10, R95. [DOI] [PMC free article] [PubMed] [Google Scholar]
- Milgrom E, Diab H, Middleton F, and Kane PM (2007). Loss of vacuolar proton-translocating ATPase activity in yeast results in chronic oxidative stress. J Biol Chem 282, 7125–7136. [DOI] [PubMed] [Google Scholar]
- Molin M, Yang J, Hanzen S, Toledano MB, Labarre J, and Nystrom T (2011). Life span extension and H(2)O(2) resistance elicited by caloric restriction require the peroxiredoxin Tsa1 in Saccharomyces cerevisiae. Mol Cell 43, 823–833. [DOI] [PubMed] [Google Scholar]
- Monschau N, Stahmann KP, Sahm H, McNeil JB, and Bognar AL (2006). Identification of Saccharomyces cerevisiae GLY1 as a threonine aldolase: a key enzyme in glycine biosynthesis. FEMS Microbiol Lett 150, 55–60. [DOI] [PubMed] [Google Scholar]
- Mortimer RK, and Johnston JR (1959). Life span of individual yeast cells. Nature 183, 1751–1752. [DOI] [PubMed] [Google Scholar]
- Mulleder M, Capuano F, Pir P, Christen S, Sauer U, Oliver SG, and Ralser M (2012). A prototrophic deletion mutant collection for yeast metabolomics and systems biology. Nature biotechnology 30, 1176–1178. [DOI] [PMC free article] [PubMed] [Google Scholar]
- Muller FL, Lustgarten MS, Jang Y, Richardson A, and Van Remmen H (2007). Trends in oxidative aging theories. Free Radic Biol Med 43, 477–503. [DOI] [PubMed] [Google Scholar]
- Nishiuch Y, Sasaki M, Nakayasu M, and Oikawa A (1976). Cytotoxicity of cysteine in culture media. In Vitro 12, 635–638. [DOI] [PubMed] [Google Scholar]
- Nixon RA, Yang D-S, and Lee J-H (2008). Neurodegenerative lysosomal disorders: a continuum from development to late age. Autophagy 4, 590–599. [DOI] [PubMed] [Google Scholar]
- Nunnari J, and Suomalainen A (2012). Mitochondria: in sickness and in health. Cell 148, 1145–1159. [DOI] [PMC free article] [PubMed] [Google Scholar]
- Ohya Y, Umemoto N, Tanida I, Ohta A, Iida H, and Anraku Y (1991). Calcium-sensitive cls mutants of Saccharomyces cerevisiae showing a Pet- phenotype are ascribable to defects of vacuolar membrane H(+)-ATPase activity. J Biol Chem 266, 13971–13977. [PubMed] [Google Scholar]
- Olney JW, Zorumski C, Price MT, and Labruyere J (1990). L-cysteine, a bicarbonate-sensitive endogenous excitotoxin. Science 248, 596–599. [DOI] [PubMed] [Google Scholar]
- Plotegher N, and Duchen MR (2017). Crosstalk between Lysosomes and Mitochondria in Parkinson’s Disease. Front Cell Dev Biol 5, 110. [DOI] [PMC free article] [PubMed] [Google Scholar]
- Poole LB (2015). The basics of thiols and cysteines in redox biology and chemistry. Free Radic Biol Med 80, 148–157. [DOI] [PMC free article] [PubMed] [Google Scholar]
- Ramos C, Delgado MA, and Calderon IL (1991). Inhibition by different amino acids of the aspartate kinase and the homoserine kinase of the yeast Saccharomyces cerevisiae. FEBS Letters 278, 123–126. [DOI] [PubMed] [Google Scholar]
- Ruiz SJ, van ‘t Klooster JS, Bianchi F, and Poolman B (2017). Growth inhibition by amino acids inSaccharomyces cerevisiae. bioRxiv doi: 10.1101/222224. [DOI] [PMC free article] [PubMed] [Google Scholar]
- Russnak R, Konczal D, and McIntire SL (2001). A family of yeast proteins mediating bidirectional vacuolar amino acid transport. J Biol Chem 276, 23849–23857. [DOI] [PubMed] [Google Scholar]
- Rutherford JC, Ojeda L, Balk J, Muhlenhoff U, Lill R, and Winge DR (2005). Activation of the iron regulon by the yeast Aft1/Aft2 transcription factors depends on mitochondrial but not cytosolic iron-sulfur protein biogenesis. J Biol Chem 280, 10135–10140. [DOI] [PubMed] [Google Scholar]
- Rutter J, and Hughes AL (2015). Power(2): the power of yeast genetics applied to the powerhouse of the cell. Trends in endocrinology and metabolism: TEM 26, 59–68. [DOI] [PMC free article] [PubMed] [Google Scholar]
- Schindelin J, Arganda-Carreras I, Frise E, Kaynig V, Longair M, Pietzsch T, Preibisch S, Rueden C, Saalfeld S, Schmid B, et al. (2012). Fiji: an open-source platform for biological-image analysis. Nat Methods 9, 676–682. [DOI] [PMC free article] [PubMed] [Google Scholar]
- Schleit J, Johnson SC, Bennett CF, Simko M, Trongtham N, Castanza A, Hsieh EJ, Moller RM, Wasko BM, Delaney JR, et al. (2013). Molecular mechanisms underlying genotype-dependent responses to dietary restriction. Aging cell 12, 1050–1061. [DOI] [PMC free article] [PubMed] [Google Scholar]
- Shaner NC, Campbell RE, Steinbach PA, Giepmans BN, Palmer AE, and Tsien RY (2004). Improved monomeric red, orange and yellow fluorescent proteins derived from Discosoma sp. red fluorescent protein. Nature biotechnology 22, 1567–1572. [DOI] [PubMed] [Google Scholar]
- Sheff MA, and Thorn KS (2004). Optimized cassettes for fluorescent protein tagging in Saccharomyces cerevisiae. Yeast 21, 661–670. [DOI] [PubMed] [Google Scholar]
- Shimazu M, Sekito T, Akiyama K, Ohsumi Y, and Kakinuma Y (2005). A family of basic amino acid transporters of the vacuolar membrane from Saccharomyces cerevisiae. J Biol Chem 280, 4851–4857. [DOI] [PubMed] [Google Scholar]
- Smacchi E, and Gobbetti M (1998). Purification and characterization of cystathionine gamma-lyase from Lactobacillus fermentum DT41. FEMS Microbiol Lett 166, 197–202. [DOI] [PubMed] [Google Scholar]
- Soultoukis GA, and Partridge L (2016). Dietary Protein, Metabolism, and Aging. Annu Rev Biochem 85, 5–34. [DOI] [PubMed] [Google Scholar]
- Stipanuk MH (2004). Sulfur amino acid metabolism: pathways for production and removal of homocysteine and cysteine. Annual review of nutrition 24, 539–577. [DOI] [PubMed] [Google Scholar]
- Stipanuk MH, Ueki I, Dominy JE Jr., Simmons CR, and Hirschberger LL (2009). Cysteine dioxygenase: a robust system for regulation of cellular cysteine levels. Amino Acids 37, 55–63. [DOI] [PMC free article] [PubMed] [Google Scholar]
- Suraweera A, Münch C, Hanssum A, and Bertolotti A (2012). Failure of amino acid homeostasis causes cell death following proteasome inhibition. Molecular Cell 48, 242–253. [DOI] [PMC free article] [PubMed] [Google Scholar]
- Takumi K, and Nonaka G (2016). Bacterial Cysteine-Inducible Cysteine Resistance Systems. Journal of bacteriology 198, 1384–1392. [DOI] [PMC free article] [PubMed] [Google Scholar]
- Tone J, Yoshimura A, Manabe K, Murao N, Sekito T, Kawano-Kawada M, and Kakinuma Y (2015). Characterization of Avt1p as a vacuolar proton/amino acid antiporter in Saccharomyces cerevisiae. Bioscience, biotechnology, and biochemistry 79, 782–789. [DOI] [PubMed] [Google Scholar]
- Unger RH, and Scherer PE (2010). Gluttony, sloth and the metabolic syndrome: a roadmap to lipotoxicity. Trends in endocrinology and metabolism: TEM 21, 345–352. [DOI] [PMC free article] [PubMed] [Google Scholar]
- Van Vranken JG, Jeong MY, Wei P, Chen YC, Gygi SP, Winge DR, and Rutter J (2016). The mitochondrial acyl carrier protein (ACP) coordinates mitochondrial fatty acid synthesis with iron sulfur cluster biogenesis. e Life 5 pii: e17828. [DOI] [PMC free article] [PubMed] [Google Scholar]
- Van Vranken JG, Na U, Winge DR, and Rutter J (2015). Protein-mediated assembly of succinate dehydrogenase and its cofactors. Crit Rev Biochem Mol Biol 50, 168–180. [DOI] [PMC free article] [PubMed] [Google Scholar]
- Verzijlbergen KF, Menendez-Benito V, van Welsem T, van Deventer SJ, Lindstrom DL, Ovaa H, Neefjes J, Gottschling DE, and van Leeuwen F (2010). Recombination-induced tag exchange to track old and new proteins. Proc Natl Acad Sci USA 107, 64–68. [DOI] [PMC free article] [PubMed] [Google Scholar]
- Vina J, Saez GT, Wiggins D, Roberts AF, Hems R, and Krebs HA (1983). The effect of cysteine oxidation on isolated hepatocytes. The Biochemical journal 212, 39–44. [DOI] [PMC free article] [PubMed] [Google Scholar]
- Wallace DC (2005). A mitochondrial paradigm of metabolic and degenerative diseases, aging, and cancer: a dawn for evolutionary medicine. Annual review of genetics 39, 359–407. [DOI] [PMC free article] [PubMed] [Google Scholar]
- Waters BM, and Eide DJ (2002). Combinatorial control of yeast FET4 gene expression by iron, zinc, and oxygen. The Journal of Biological Chemistry 277, 33749–33757. [DOI] [PubMed] [Google Scholar]
- Wiemken A, and Dürr M (1974). Characterization of amino acid pools in the vacuolar compartment of Saccharomyces cerevisiae. Archives of microbiology 101, 45–57. [DOI] [PubMed] [Google Scholar]
- Winzeler EA, Shoemaker DD, Astromoff A, Liang H, Anderson K, Andre B, Bangham R, Benito R, Boeke JD, Bussey H, et al. (1999). Functional characterization of the S. cerevisiae genome by gene deletion and parallel analysis. Science 285, 901–906. [DOI] [PubMed] [Google Scholar]
- Wong YC, Kim S, Peng W, and Krainc D (2019). Regulation and Function of Mitochondria-Lysosome Membrane Contact Sites in Cellular Homeostasis. Trends in cell biology 29, 500–513. [DOI] [PMC free article] [PubMed] [Google Scholar]
- Wong YC, Ysselstein D, and Krainc D (2018). Mitochondria-lysosome contacts regulate mitochondrial fission via RAB7 GTP hydrolysis. Nature 554, 382–386. [DOI] [PMC free article] [PubMed] [Google Scholar]
- Yamagata S, D’Andrea RJ, Fujisaki S, Isaji M, and Nakamura K (1993). Cloning and bacterial expression of the CYS3 gene encoding cystathionine gamma-lyase of Saccharomyces cerevisiae and the physicochemical and enzymatic properties of the protein. Journal of bacteriology 175, 4800–4808. [DOI] [PMC free article] [PubMed] [Google Scholar]
- Yamaguchi-Iwai Y, Dancis A, and Klausner RD (1995). AFT1: a mediator of iron regulated transcriptional control in Saccharomyces cerevisiae. EMBO J 14, 1231–1239. [DOI] [PMC free article] [PubMed] [Google Scholar]
- Yambire KF, Fernandez-Mosquera L, Steinfeld R, Muhle C, Ikonen E, Milosevic I, and Raimundo N (2019). Mitochondrial biogenesis is transcriptionally repressed in lysosomal lipid storage diseases. eLife 8, pii: e39598. [DOI] [PMC free article] [PubMed] [Google Scholar]
Associated Data
This section collects any data citations, data availability statements, or supplementary materials included in this article.
Supplementary Materials
Figure S1 (related to Figure 1). Iron Suppresses Mitochondrial Alterations Caused by V-ATPase Inhibition
(A–C) Time-lapse maximum-intensity projection confocal microscopy images of mitochondrial morphology (Tim50-GFP) in untreated (A), concA treated (B), or concA + Fe treated (C) cells. Images are stills from Movies S1–S3. Scale bars = 5 μm.
Figure S2 (related to Figure 2). V-ATPase Deficiency Causes Iron Limitation
(A) Acute V-ATPase inhibition causes nuclear translocation of Aft1. Nuclear intensity of Aft1-GFP quantified from single Z-plane microscopy images of cells expressing nuclear marker Srm1-mCherry treated with concA or BPS for the indicated time. Plotted points = median values ± SD, n=50 cells.
(B) Flow cytometry histogram showing GFP expression from the FIT2 promoter increases after 6 hrs of concA treatment.
(C) Genetic ablation of the V-ATPase activates the Aft1-dependent iron regulon. Flow cytometry analysis of FIT2 promoter-driven GFP expression in wild type and vma1Δ cells treated +/− concA for 6 hrs. Bars = mean ± SD, n=3.
(D) Activation of the Aft1 reporter is similar with complete extracellular iron chelation and V-ATPase inhibition, and requires Aft1. Flow cytometry analysis of FIT2 promoter-driven GFP expression in wild type and aft1Δ cells treated with concA or BPS for 6 hrs. Bars = mean ± SD, n=3.
(E) Iron supplementation suppresses concA-induced activation of the Aft1 regulon. Flow cytometry analysis of FIT2 promoter-driven GFP expression in cells treated with concA and increasing ferrous ammonium sulfate (Fe2+) or ferric chloride (Fe3+) for 6 hrs. Bars = mean ± SD, n=3.
(F) Iron supplementation suppresses concA-induced activation of the Aft1 regulon. Western blot analysis of FIT2 promoter-driven GFP expression in cells treated +/− concA +/− Fe for 6 hrs. Loading control, Pgk1.
(G) FET4 overexpression suppresses activation of the iron regulon. Flow cytometry analysis of FIT2 promoter-driven GFP expression in cells containing an empty vector or overexpressing FET4 grown +/− concA for 6 hrs. Bars = mean ± SD, n=3.
(H) Loss of V-ATPase activity is lethal in combination with mild external iron chelation. Growth assays of wild-type yeast on YPD medium with the indicated treatments. [BPS] = 75 μM.
(I) Acute V-ATPase inhibition destabilizes ISC-containing proteins. GFP versions of the RITE tagged ISC proteins Lys4 and Twy1, and the control protein Pgk1 were switched to RFP with β-estradiol using RITE technology (top panel). After confirmation via microscopy that all cells in the population had stopped producing the GFP tagged versions of the protein, cells were cultured +/− concA. At the indicated times, equal volumes of cells were harvested and levels of GFP tagged proteins were analyzed by Western blot (bottom panel).
Figure S3 (related to Figure 3). Altered Iron Uptake and Protein Degradation Do Not Drive Iron Limitation Upon V-ATPase Impairment
(A) Total intracellular iron levels are stable upon acute V-ATPase inhibition. Yeast containing the FIT2pr-GFP reporter treated with concA for the indicated time were analyzed for GFP expression by Western blot and total iron by ICP-MS. Bars = mean ± SD, n=3.
(B) V-ATPase mutants activate the iron regulon despite containing high iron. The indicated strains containing FIT2pr-GFP were assayed for total iron by ICP-MS and GFP expression by Western blot. Bars = mean ± SD, n=3.
(C) Mitochondrial iron levels decline upon acute V-ATPase inhibition. Isolated mitochondrial fractions from cells treated with concA for 4 hrs were analyzed for total iron by ICP-MS. Bars = mean ± SD, n=3.
(D) Western blot showing purity of nycodenz-isolated mitochondrial fractions analyzed in C. WC = whole cell; M = mitochondria. Por1 = mitochondria, Hsp70 = cytosol, Prc1 = vacuole, Pep12 = Golgi.
(E) Overexpression of MRS3 or MRS4 does not suppress concA-mediated respiratory deficiency. Growth assays of yeast containing empty vector (EV) or overexpressing MRS3 or MRS4 on YPG −/+ concA.
(F) Loss of autophagy or vacuole protein degradation does not cause iron starvation. Flow cytometry analysis of FIT2pr-GFP fluorescence in wild type and the indicated mutant strains. Bars = mean ± SD, n=3.
Figure S4 (related to Figure 4). High Amino Acids Limit Iron Bioavailability
(A) Total intracellular levels of many amino acids are unchanged by V-ATPase inhibition. GC-MS analysis of relative amino acid abundance in wild-type yeast treated +/− concA for 6 hrs. Bars = mean ± SD, n=3.
(B) Iron content of YPD is higher than SD medium. YPD (high AA) and SD (low AA) media was analyzed for iron content by ICP-MS. Bars = mean ± SD, n=3.
(C) Response to mild BPS chelation confirms iron content of YPD medium is higher than SD medium. Flow cytometry analysis of FIT2pr-GFP fluorescence in wild type yeast cultured in the indicated medium treated +/− 50 μM BPS for 6 hrs. Bars = mean ± SD, n=3.
(D) Translation inhibition induces nuclear translocation of Aft1. Nuclear intensity of Aft1-GFP quantified from single Z-plane microscopy images of cells expressing nuclear marker Srm1-mCherry treated with CHX for the indicated time. Plotted points = median values, n=50 cells.
Figure S5 (related to Figure 5). Cysteine and Threonine Limit Iron Bioavailability and Mitochondrial Function Upon V-ATPase Deficiency
(A) Threonine potentiates iron starvation caused by V-ATPase inhibition at higher concentrations. Flow cytometry analysis of FIT2pr-GFP fluorescence in yeast cultured +/− concA for 6 hrs in low AA medium with increasing concentrations of threonine. Plotted values = mean ± SD, n=3.
(B) Diagram of cysteine and threonine metabolic interconnectivity.
(C) Effect of threonine on concA-induced iron starvation is stereoselective. Flow cytometry analysis of FIT2pr-GFP fluorescence in yeast cultured +/− concA for 6 hrs in low AA medium +/− 15 mM L- or D-threonine. Bars = mean ± SD, n=3.
(D) L- and D-threonine are taken up into cells at equal levels. GC-MS analysis of relative threonine abundance in wild-type yeast cultured +/− concA for 6 hrs in low AA medium +/− L- or D-threonine. Bars = mean ± SD, n=3.
(E–G) Other cysteine related metabolites do not cause iron starvation. Flow cytometry analysis of FIT2pr-GFP fluorescence in yeast cultured +/− concA for 6 hrs in low amino acid medium plus the indicated metabolite. Hcy = homocysteine, GSH = glutathione, S-methyl-cys = S-methyl-l-cysteine. Bars = mean ± SD, n=3.
Figure S6 (related to Figure 6). Vacuole Dysfunction Disrupts Iron Homeostasis by Increasing ROS
(A) V-ATPase mutants are sensitive to paraquat in an iron dependent manner. Growth assays of wild type and the indicated mutant strains on YPD medium +/− paraquat +/− Fe.
(B and E) Only high doses of hydrogen peroxide and not concA generate detectable amounts of protein carbonylation. Oxyblots of whole cell lysates treated with concA for the indicated time (B) or the indicated concentration of hydrogen peroxide for 1 hr (E). Pgk1 = loading control.
(C and F) Only high doses of hydrogen peroxide and not concA promote oxidation of HyPer. Oxidized to reduced ratio of Hyper or redox insensitive C199S HyPer expressed in wild type yeast treated with concA for the indicated time (C) or the indicated concentration of hydrogen peroxide for 1 hr (F). Oxidized versus reduced HyPer ratio was calculated as described in Star Methods. Bars = mean ± SD, n=3.
(D and G) Only high doses of hydrogen peroxide and not concA generate detectable amounts of Tsa1 hyperoxidation. Whole cell lysates from wild type or tsa1Δ yeast treated with concA for the indicated time (D) or the indicated concentration of hydrogen peroxide for 1 hr (G) subjected to Western blotting with antibodies against the normal or hyperoxidized forms of Tsa1 (Tsa1 or Tsa1-SO3H). Pgk1 = loading control. (H and I) Tsa1-GFP foci are oxygen dependent. Quantification of Tsa1-GFP foci produced by upon treatment with concA (H) or cysteine (I) for 18 hrs in the presence or absence of oxygen.
(J) Many oxidative stress transcripts induced by V-ATPase inhibition are Skn7-dependent. qPCR showing fold change of the indicated genes after 1 hr concA treatment in wild-type and skn7Δ strains. Values expressed relative to wild type DMSO treated. Bars = mean ± SD, n=3.
(K) Loss of SKN7 enhances concA-induced iron starvation. Flow cytometry analysis of FIT2pr-GFP fluorescence in wild type and skn7Δ yeast treated +/− concA for 6 hrs. Bars = mean ± SD, n=3.
(L) Overexpression of antioxidant genes suppresses iron starvation upon V-ATPase inhibition. Flow cytometry analysis of FIT2pr-GFP fluorescence in wild-type strains expressing empty vector or overexpressing a combination of SOD1 and TSA1 treated +/− concA for 6 hrs. Bars = mean ± SD, n=3.
(M) Oxygen restriction suppresses iron starvation induced by V-ATPase depletion. Flow cytometry analysis of FIT2pr-GFP fluorescence in wild-type and vma1Δ yeast grown in the presence (aerobic) or absence (anaerobic) of oxygen for 18 hrs. Bars = mean ± SD, n=3.
(N) Iron supplementation does not suppress concA-induced Tsa1 foci. Quantification of Tsa1-GFP foci from maximum intensity projection images of cells grown +/− concA +/− Fe for 1.5 hrs. Bars = mean ± SD, n=3.
(O) Iron supplementation does not suppress concA-induced expression of oxidative stress transcripts. qPCR showing fold change of SRX1 after 1 hr of concA treatment +/− Fe. Values expressed relative to DMSO treated. Bars = mean ± SD, n=3.
Movie S1. Related to Figures 1 and S1. Time-Lapse Imaging of Mitochondria in Untreated Cells
Maximum-intensity projection movie of yeast mitochondria visualized with Tim50-GFP. Cells were imaged every minute from 45 to 150 minutes after resuspension in imaging medium (SD + 2% casein amino acids). Movie speed = 12 frames/second.
Movie S2. Related to Figures 1 and S1. Time-Lapse Imaging of Mitochondrial Structure Alterations Upon Acute V-ATPase Inhibition
Maximum-intensity projection movie of yeast mitochondria visualized with Tim50-GFP. Cells were imaged every minute from 45 to 150 minutes after resuspension in imaging medium containing concA. Movie speed = 12 frames/second.
Movie S3. Related to Figures 1 and S1. Time-Lapse Imaging Showing Iron Suppresses V-ATPase-Inhibition Mediated Mitochondrial Structural Alterations
Maximum-intensity projection movie of yeast mitochondria visualized with Tim50-GFP. Cells were imaged every minute from 45 to 150 minutes after resuspension in imaging medium containing concA + Fe. Movie speed = 12 frames/second.
Table S1. Related to Figures 3 and 6. Gene Expression Data Set from RNA Sequencing Experiments
Table includes tabs with raw sequencing reads, fold-change (log2) and p-value (−log10) for all genes at each concA timepoint (0, 1, 3, 6 hours).
Table S2. Related to STAR Methods. Oligonucleotides Used in This Study
Data Availability Statement
RNA sequencing data was deposited at NCBI Gene Expression Omnibus GEO (accession # GSE133214). Scripts used to perform RNA-seq analysis can be found at https://github.com/j-berg/hughes_rnaseq_2019.