

Abstract
Attention-Deficit/Hyperactivity Disorder (ADHD) is a common neuropsychiatric disorder with a complex genetic background. The G protein-coupled receptor kinase interacting ArfGAP 1 (GIT1) gene was previously associated with ADHD. We aimed at replicating the association of GIT1 with ADHD and investigated its role in cognitive and brain phenotypes. Gene-wide and single variant association analyses for GIT1 were performed for three cohorts: (1) the ADHD meta-analysis data set of the Psychiatric Genomics Consortium (PGC, N=19,210), (2) the Dutch cohort of the International Multicentre persistent ADHD CollaboraTion (IMpACT-NL, N=225), and (3) the Brain Imaging Genetics cohort (BIG, N=1,300). Furthermore, functionality of the rs550818 variant as an expression quantitative trait locus (eQTL) for GIT1 was assessed in human blood samples. By using Drosophila melanogaster as a biological model system, we manipulated Git expression according to the outcome of the expression result and studied the effect of Git knockdown on neuronal morphology and locomotor activity. Association of rs550818 with ADHD was not confirmed, nor did a combination of variants in GIT1 show association with ADHD or any related measures in either of the investigated cohorts. However, the rs550818 risk-genotype did reduce GIT1 expression level. Git knockdown in Drosophila caused abnormal synapse and dendrite morphology, but did not affect locomotor activity. In summary, we could not confirm GIT1 as an ADHD candidate gene, while rs550818 was found to be an eQTL for GIT1. Despite GIT1’s regulation of neuronal morphology, alterations in gene expression do not appear to have ADHD-related behavioral consequences.
Keywords: GIT1, ADHD, brain imaging genetics, eQTL, Drosophila melanogaster
Introduction
Attention Deficit/Hyperactivity Disorder (ADHD) is a common and highly heritable neuropsychiatric disorder (heritability 70-80% (Burt, 2009; Faraone et al., 2005)), with prevalence rates of 5-6% in childhood (American Psychiatric Association, 2013; Polanczyk et al., 2007). Clinically, ADHD is characterized by two core symptom domains: inattention and hyperactivity/impulsivity (American Psychiatric Association, 2013). At least 15% and up to 60% of all patients diagnosed in childhood still meet full ADHD criteria when they reach adulthood; prevalence rates of persistent ADHD in adults range between 2.5 and 4.9% (Simon et al., 2009). The clinical manifestation of adult ADHD may differ from that of childhood ADHD, i.e. by less obvious symptoms of hyperactivity and impulsivity (Buitelaar, 2011; Haavik et al., 2010). However, adult individuals with ADHD might be the most severe cases, given the lifelong impairment (Dalsgaard et al., 2015; Franke et al., 2012).
Despite its high heritability, identifying ADHD risk genes has been difficult (Franke et al., 2009a; Gizer et al., 2009), Due to the disorder’s complex genetic background (Franke et al., 2012). Because of the high prevalence of ADHD in the population, the search for genetic factors has mainly focused on common genetic variants (mainly single nucleotide polymorphisms (SNPs)) that occur quite frequently and have generally small effect sizes (Li et al., 2014; Neale et al., 2010b). Hypothesis-free genome-wide association studies (GWAS) have thus been the main approach to study the genetics of ADHD during the last ten years. However, with eleven GWAS published to date (Hinney et al., 2011; Lasky-Su et al., 2008a; Lasky-Su et al., 2008b; Lesch et al., 2008; Mick et al., 2010; Neale et al., 2008; Neale et al., 2010a; Sanchez-Mora et al., 2014; Sonuga-Barke et al., 2008; Stergiakouli et al., 2012; Yang et al., 2013), no genome-wide significant hit has yet been identified for ADHD (Li et al., 2014; Neale et al., 2010b). A review of the first five hypothesis-free GWAS approaches for ADHD reported only limited overlap between the different studies, except for an association with cadherin 13 (CDH13) (Franke et al., 2009b). So far, only a handful of susceptibility genes have been identified through meta-analysis, all of which confer only small increases in disease risk (Gizer et al., 2009). Recently, the G protein-coupled receptor kinase interacting ArfGAP 1 gene (GIT1; Gene ID 28964), was suggested as a novel candidate gene for ADHD (Won et al., 2011). The GIT1 gene comprises 21 exons and spans 16,123 base pairs. It is located on chromosome 17p11.2 and plays an important role in the regulation of cell migration (Penela et al., 2014), neurite outgrowth (Albertinazzi et al., 2003; Za et al., 2006) and synapse formation (Kim et al., 2003; Menon et al., 2010; Saneyoshi et al., 2008; Segura et al., 2007; Zhang et al., 2003; Zhang et al., 2005). In this, the finding of association of GIT1 with ADHD fits well with earlier work of our group, showing convergence of top-findings from five genome-wide association studies in ADHD on the biological process of neurite outgrowth (Poelmans et al., 2011). Out of 27-tested single nucleotide polymorphisms (SNPs), the intronic SNP rs550818 in the GIT1 gene was associated with ADHD in a Korean childhood sample (N=388; adjusted odds ratio = 2.66) (Won et al., 2011). The authors reported that the minor allele of this SNP caused a reduction of GIT1 transcription in a luciferase reporter assay in HEK293 cells, indicating that it is a functional variant (Won et al., 2011). In the same report, Git1-deficient mice displayed ADHD-like symptoms, such as hyperactivity, but also enhanced theta rhythms, and impaired memory. All of these symptoms were reversed by amphetamine, a stimulant medication used for ADHD treatment (Won et al., 2011). However, the association between the SNP rs550818 and ADHD risk was not replicated in a Brazilian childhood and adolescent ADHD sample (N=646) (Salatino-Oliveira et al., 2012). To our knowledge, no other replications of the finding has been published yet, although a recent review listed the GIT1 association as a reproducible genetic association for ADHD (Hawi et al., 2015).
In the current study we investigated the role of GIT1 (including SNP rs550818) in ADHD risk and related traits. First, we attempted to replicate the association between GIT1 and ADHD in the largest data set available, the Psychiatric Genomics Consortium’s (PGC; http://www.med.unc.edu/pgc/) ADHD data (N=19,210). We then assessed the effect of GIT1 variation on ADHD-related neurocognition, brain volume measures and white matter integrity in adult ADHD patients and controls. We further examined whether SNP rs550818 alters GIT1 mRNA expression in blood cells from patients with ADHD and controls. Lastly, we characterized the effects of downregulating expression of Git in Drosophila melanogaster, using synaptic and dendritic morphology and locomotor activity as read-outs.
Material and Methods
Cohorts
PGC ADHD meta-analysis
Data from nine studies including 5,621 cases and 13,589 controls were available for analysis. Samples were of Caucasian or Han Chinese origin and met diagnostic criteria according to the DSM-IV (Supplementary Table 1). The meta-analytic data used in this study were available as summary statistics, including genome-wide SNP data with corresponding p-values and odds ratios.
Dutch cohort of the International Multicentre persistent ADHD CollaboraTion (IMpACT-NL)
A total of 225 individuals (115 adult ADHD patients, 110 healthy control subjects matched for age, gender, and IQ) from IMpACT-NL (Franke and Reif, 2013; Franke et al., 2010a) participated in this study. Participants were recruited from the department of Psychiatry of the Radboud university medical center in Nijmegen or through advertisements. Patients were included if they met DSM-IV-TR criteria for ADHD in childhood as well as in adulthood. Participants had a mean age of 37.42 years (range 18-63), and 43.1% of the sample was male. For genetic data analysis, subjects were not allowed to be genetically related to each other. The study was approved by the regional ethics committee. Written informed consent was obtained from all participants. A more detailed description of the IMpACT-NL cohort can be found in the supplementary material.
Brain Imaging Genetics Study (BIG)
The study sample consisted of healthy adult volunteers taking part in the diverse studies conducted at the Donders Institute for Brain, Cognition and Behaviour in Nijmegen, The Netherlands (Franke et al., 2010b). Genome-wide genotyping data and structural Magnetic Resonance Imaging (MRI) data was available for 1,300 subjects (Guadalupe et al., 2014; Hoogman et al., 2014). Participants were highly educated (80% with a bachelor student level or higher), of Caucasian descent, and had no self-reported neurological or psychiatric history. The mean age was 22.9 years (range 18-40 years), and 42.7% of the participants were males. All participants gave written informed consent and the study was approved by the regional ethics committee.
Demographic characteristics of the PGC, IMpACT-NL, and BIG cohorts are presented in Table 1.
Table 1.
Demographic characteristics of the different cohorts.
| PGC (N = 19,210) | IMpACT-NL (N = 225) | BIG (N = 1,300) | |
|---|---|---|---|
| Age a | NA | 37.42 (10.94), 18-63 | 22.9 (3.82), 18-40 |
| Gender | NA | 43.1% male | 42.7% male |
| Cases/controls | 5,621/13,589 | 115/110 | --- |
Data are shown as mean (standard deviation), minimum – maximum.
Neuropsychological data
Data on cognitive functioning was available for participants of the IMpACT-NL cohort. They were assessed with a neuropsychological test battery composed to cover multiple cognitive domains earlier found affected in ADHD (Mostert et al., submitted). This included executive functioning, timing of motor output, reaction time, delay aversion, impulsivity, inhibition, attention, vigilance, working memory, motor speed, and set shifting. The neuropsychological tests were always administered in the same order across ADHD patients and healthy controls. The following tasks and variables were selected for association analyses with the GIT1 locus, because related tasks were either studied by Won and colleagues (continuous performance task; (Won et al., 2011)), or were affected in Git1 knockout mice (working memory (Won et al., 2011)): (1) sustained attention dots (SAD) task ((Huijbregts et al., 2008), variables: mean series completion time, standard deviation (SD) series completion time, SD series errors and the response bias) and (2) Digit span task ((Wechsler, 1997), variables: raw scores on forward and backward condition). Additionally, we explored the effect of the GIT1 locus on the following tasks and variables, because performance on these cognitive domains was shown to be different between ADHD patients and controls in our IMpACT-NL cohort (Mostert et al., submitted): (1) Flanker task ((Huijbregts et al., 2002), variable: total SD of reaction time (RT)), (2) Sustained Attention to Response Task (SART, (Smit et al., 2004), variable: SD of RT for hits), (3) Delay discounting task ((Dom et al., 2006), K100), and (4) Trail-making task ((Kortte et al., 2002), variables: time to complete part A and B). The following variables were log-transformed to achieve a normal distribution: SAD task standard deviation (SD) series completion time, SAD task SD series errors, SART SD of reaction time (RT), delay discounting task K100. For more detailed information on the tasks and variables see Supplementary Table 2.
Neuroimaging, MRI acquisition and data processing
Because altered brain volumes have been consistently found to be associated with ADHD (Castellanos et al., 2002; Frodl and Skokauskas, 2012), and Git1 was shown to affect neurite outgrowth (Albertinazzi et al., 2003; Za et al., 2006), spine morphogenesis (Segura et al., 2007; Zhang et al., 2005), and synapse formation (Kim et al., 2003; Menon et al., 2010; Saneyoshi et al., 2008; Segura et al., 2007; Zhang et al., 2003; Zhang et al., 2005) in mice, we aimed to investigate the role of genetic variation within the GIT1 locus on total brain volume, gray and white matter volume and white matter integrity in two different cohorts.
IMpACT-NL
T1-weighted MRI images were acquired previously and details of acquisition and processing are described in the supplementary material and elsewhere (Onnink et al., 2014). For 203 samples (101 ADHD patients and 102 healthy controls) both MRI and genetic data was available.
BIG
Anatomical T1-weighted whole brain MPRAGE scans were either acquired at a 1.5 Tesla scanner (Sonata and Avanto, Siemens Medical Systems, Erlangen, Germany) or at a 3 Tesla scanner (Trio and TrioTim, Siemens Medical Systems, Erlangen, Germany) at the Donders Centre for Cognitive Neuroimaging (Nijmegen, The Netherlands). The imaging protocols of the T1 scans included slight variations, because images were acquired during several studies. Details of these variations on the protocol used in the IMpACT-NL study and parameters are described in the supplementary material and elsewhere (Hoogman et al., 2014). For 1,300 subjects both MRI and genetic data were available.
Genetic data
PGC
We obtained access to genome-wide summary statistics from the most recent PGC ADHD meta-analysis. Detailed procedures of DNA isolation, whole-genome genotyping and imputation were described previously (Neale et al., 2010b). Shortly, genome-wide data was obtained from different genotyping arrays (Supplementary Table 1) and was imputed using 1000 Genomes data as a reference panel (Phase I integrated variant set release (v3) in NCBI build 37 (hg19) coordinates) for autosomal SNPs (Genomes Project et al., 2010). Meta-analytic data were processed through a stringent quality control pipeline applied at the PGC (Neale et al., 2010b).
IMpACT-NL
From all IMpACT-NL participants, DNA was either isolated from saliva using Oragene containers (DNA Genotek, Ottawa, Ontario, Canada) or from EDTA blood samples according to manufacturer’s protocol at the department of Human Genetics of the Radboud university medical center. Genome-wide genotyping of 235 IMpACT subjects (122 cases, 113 controls) was performed using the Human CytoSNP 12 version 2 genotyping BeadChip (Illumina Inc., San Diego, California, USA). Details on data quality control and imputation procedure can be found in the supplementary material.
BIG
DNA isolation, whole-genome genotyping, and imputation were described previously (Guadalupe et al., 2014; Hoogman et al., 2014). Shortly, saliva was collected using Oragene containers (DNA Genotek, Ottawa, ON, Canada). Whole genome genotyping was done using Affymetrix GeneChip SNP, 6.0 (Affymetrix Inc., Santa Clara, CA). For imputation, the 1000 Genomes data was used as a reference panel (Phase 1.v3 EUR (Genomes Project et al., 2010)) and the imputation of autosomal SNPs was done following the Enhancing Neuro Imaging Genetics Through Meta Analysis (ENIGMA) protocol (according to NCBI build 37 (hg19) coordinates; http://enigma.ini.usc.edu/).
Association of the GIT1 locus with ADHD and ADHD-related quantitative traits
Association analyses between GIT1, ADHD, and related traits were done in two ways. First, we performed a single SNP association between the earlier described ADHD-risk SNP rs550818, ADHD status, and/or ADHD-related quantitative traits. Second, we analyzed the association of the joint effect of all common genetic variants in the GIT1 locus with ADHD status and/or ADHD-related quantitative traits.
Single-SNP analyses
The SNP rs550818 lies within intron 20 of the GIT1 gene on chromosome 17, at base pair position 27901975 (hg19/build 37). The A-allele has been reported to be the risk allele. The minor allele frequency (MAF) and the R2 estimates for rs550818 in the different samples are shown in Supplementary Table 4.
For the PGC data, the association p-value for rs550818 and ADHD status was extracted from the summary statistics. For the IMpACT-NL sample, association analyses for the self-reported symptom counts (hyperactivity/impulsivity, inattentive and combined symptoms) and the GIT1 locus were performed in cases only (N=115), given the known case-control differences for these phenotypes. We applied a linear regression with an additive genetic model and a missing data likelihood score test in SNPTEST (version 2.4.1) (Marchini et al., 2007). Age and gender were used as covariates for all analyses. For the neuropsychological data, analyses were performed in the same way, including age, gender, and diagnostic status as covariates in the model (N≥178). For the analysis of MRI-derived traits, age, gender, and total white matter volume (when analyzing gray matter) or total gray matter volume (when analyzing white matter) were included as covariates for the association analyses (N=203). Diagnostic status was not used as a covariate, because we found no differences in brain volume between ADHD patients and healthy controls (Supplementary Table 5). For the BIG sample (N=1,300), association analyses for the GIT1 locus were performed using linear regression for total brain volume, gray and white matter by using genotypic data and the “linear” command in PLINK (version 1.07) (Purcell et al., 2007). Age, gender, magnetic field strength, and total white matter volume (when analyzing gray matter) or total gray matter volume (when analyzing white matter) were used as covariates. Association p-values for rs550818 were extracted from regression results of the individual analyses.
To test the effect of rs550818 genotype on local gray and white matter volumetric and integrity differences, we performed a voxel-based morphometry (VBM; (Ashburner and Friston, 2000)) analysis on the T1 (N=1,261) and DTI data (N=255) in the BIG cohort. The genotypes of SNP rs550818 were coded to represent a linear allelic additive effect (0, 1 or 2). Age, gender, and magnetic field strength were used as covariates. Gray and white matter cluster extent was analyzed separately and tested across the entire brain using a PFWE < 0.05 and a cluster-forming threshold of Puncorrected < 0.001 (Hoogman et al., 2014). Fractional anisotropy (FA) and mean diffusivity (MD) were tested in the same manner, except that FA comparisons were restricted to voxels having anisotropy > 0.1.
Gene-based analysis
The GIT1 locus was defined as the GIT1 gene ± 25 kb flanking regions in order to capture regulatory elements (Bralten et al., 2011). The gene range was selected according to the UCSC Genome Bioinformatics Site (http://genome.ucsc.edu/). Gene-based tests of the GIT1 locus were performed using the offline version of the versatile gene-based test for genome-wide association studies (VEGAS) software (Liu et al., 2010). This program uses SNP names (rs-numbers) and p-values as input to estimate gene-based effects. The approach takes LD between markers in a gene into account by using simulations based on the LD structure of a custom set of reference individuals (Liu et al., 2010). As a reference panel we used genotypic data from BIG (Guadalupe et al., 2014) imputed with 1000 Genomes Phase 1.v3 EUR reference panel (Genomes Project et al., 2010). VEGAS assigns SNPs to autosomal genes according to their position in hg19/build 37. A corresponding gene list was downloaded from http://www.biomart.org/biomart/martview. Multiple testing was based on the number of simulations per gene and was set to 10,000.
For the PGC ADHD meta-analysis data set, SNPs were included in this analysis if they showed an imputation score (R2) ≥ 0.6 and MAF ≥ 0.01 in unaffected subjects and Hardy-Weinberg equilibrium (HWE) P > 10−6. Out of 126 common genetic variants within the GIT1 locus, 97 SNPs had valid rs-numbers and were considered in the subsequent analysis (Supplementary Table 3). In the data from IMpACT-NL, we analyzed the association of the GIT1 locus (52 SNPs) with self-reported symptoms counts (total number of symptoms, number of inattentive symptoms, number of hyperactive/impulsive symptoms), neuropsychological variables, and MRI derived traits, such as total brain volume and gray and white matter volume (Supplementary Table 3). Subsequent gene-based tests used the results from the individual regression analyses as input for VEGAS described above. For the data from the BIG cohort, we analyzed the association of the GIT1 locus with MRI-derived traits, i.e. total brain volume, gray and white matter volumes. SNP data selected required an imputation score (R2) ≥ 0.3 and MAF ≥ 0.01. Forty-three SNPs within the GIT1 locus were considered in subsequent analyses (Supplementary Table 3). Gene-based tests of the GIT1 locus were performed with the offline version of VEGAS using the results from the individual regression analyses as described above. The multiple testing-corrected p-value for significance of the analyses described above, derived from 10,000 permutations, was determined as 0.05 divided by the number of tested variables.
Power calculation
The Genetic Power Calculator (GPC) (Purcell et al., 2003) was used to define the power our samples had at either a range of genotype relative risks (GRR, for the PGC ADHD meta-analytic data, testing for case-control discrete trait) or additive QTL variances (for the IMpACT-NL and BIG cohort, testing for quantitative association) at α=0.05. We used a disease prevalence of 5% (as estimated by Polanczyk et al.(Polanczyk et al., 2007), and a multiplicative model (power calculation based on the allelic test). The actual risk allele frequencies of SNP rs550818 for the individual cohorts were included in the power analysis.
Functional characterization of GIT1: effect of rs550818 on GIT1 mRNA expression
We specifically tested for the effect of rs550818 genotype on mRNA expression of GIT1 in human blood samples from the IMpACT-NL cohort. From 148 consecutive IMpACT-NL participants blood samples for RNA isolation were collected in PAXgene Blood RNA Tubes (produced by QIAGEN GmbH for PreAnalytiX GmbH, Hombrechtikon, Switzerland) at the Radboud university medical center.
Validation of rs550818 genotype by TaqMan genotyping assay
Rs550818 genotypes from the genome-wide genotyping array were validated for the IMpACT-NL samples prior to this analysis. Allelic discrimination of rs550818 was performed using Taqman® SNP Genotyping assay (Life Technologies, Nieuwerkerk a/d IJssel, The Netherlands; Assay ID: C_2416538_10). For a detailed description of the TaqMan genotyping assay conditions see the supplementary material.
RNA isolation and cDNA synthesis
Total RNA was extracted from PAXgene blood RNA tubes at the department of Human Genetics of the Radboud university medical center using the Qiagen PAXgene Blood RNA Kit (produced by QIAGEN GmbH for PreAnalytiX GmbH) according to manufacturer’s protocol. RNA integrity was assessed by gel electrophoresis. The cDNA was synthesized from 500 ng RNA in a reaction volume of 20 µl using the iScript cDNA Synthesis Kit (Bio-Rad Laboratories B.V. Veenendaal, The Netherlands) according to manufacturer’s protocol. For the expression analysis a 1/3.75 dilution was used.
Gene expression analysis using Taqman assays
GIT1 mRNA gene expression was assessed using Taqman gene expression analysis (Taqman assay Hs01063104_m1 for GIT1 [Life Technologies]) according to manufacturer’s protocol. Glucuronidase beta (GUSB), was taken along as reference gene (Taqman assay Hs00939627_m1 for GUSB [Life Technologies]). For a detailed description of the gene expression analysis conditions see the supplementary material. All measurements were performed in triplicate, and blanks were taken along as quality control during mRNA expression assessment. Results were analyzed with the 7500 Software v2.0.6 (Life Technologies) using an automatic threshold. Only samples with standard deviations of the triplicates ≤ 0.25 were considered for subsequent analysis, which resulted in 121 samples. As a calibrator sample the mean ΔCT of all control samples with the major genotype was used. Data was visualized using GraphPad prism (version 5.03), and the mean and a 95% confidence interval are shown.
Statistical analysis
GIT1 mRNA expression data was normally distributed (Supplementary Figure 1). We determined the effect of rs550818 genotype on GIT1 mRNA expression based on three genotype groups (independent variable) using linear regression analysis with an additive genetic model. We also assessed whether GIT1 mRNA expression levels differed between healthy controls and participants with ADHD using a two-tailed Student’s t-test. All data analyses were performed using the Statistical Package for the Social Sciences (SPSS) version 20.0 (IBM Corp. Released 2011, IBM SPSS Statistics for Windows, Version 20.0 Armonk, NY: IBM Corp.).
Functional characterization of Git in Drosophila
Genetics and breeding
Conditional knockdown of the Drosophila GIT1 ortholog Git (CG16728) in all or specifically in multidendrite neurons was achieved with the UAS-GAL4 system (Brand and Perrimon, 1993) using promoter lines w; UAS-Dcr-2; elav-GAL4 and 477-GAL4, UAS-mCD8::GFP; ppk-GAL4, respectively (Dietzl et al., 2007). The Git UAS-RNAi line (vdrc108123 UAS-RNAiGit/CyO) and its genetic background control (vdrc60100) were obtained from the Vienna Drosophila RNAi Centre (VDRC, (Dietzl et al., 2007). For synapse and dendrite experiments, stock vdrc108123 was rebalanced with CyO-GFP to allow for selection of knockdown larvae. Crosses were cultured according to standard procedures at 28°C.
Neuronal morphology of synapses at the neuromuscular junction
Synapses at the type 1b neuromuscular junctions (NMJs) of muscle 4 were analyzed as described previously (Schuurs-Hoeijmakers et al., 2012). Male L3-stage larvae of the genotypes UAS-RNAiGit/UAS-Dcr-2; +/elav-GAL4 and the respective control +/UAS-Dcr-2; +/elav-GAL4 were dissected following a dorsal midline incision (Brent et al., 2009). Dissected larvae were fixed in 3.7% paraformaldehyde for 25 min, washed in PBS containing 0.3% Triton X-100 (PBST), stained with 1:125 anti-brp (nc82), washed in PBST, and stained with 1:500 Goat anti-Mouse Alexa Fluor 488 and 1:25 anti-dlg1 antibody covalently coupled to Goat anti-mouse Alexa Fluor 568 IgG1 (Developmental Studies Hybridoma Bank (DSHB), Iowa City, IA, USA; Zenon® Antibody Labeling Kit, Life Technologies). The larvae were mounted in Prolong anti-fade Gold (Life technologies). Images were taken with a Zeiss Axio Imager Z2 microscope (63x magnification), subsequently stacked and synaptic area, branches and active zones were analyzed in Fiji (Schindelin et al., 2012; Schuurs-Hoeijmakers et al., 2012). For the Git RNAi genotype at least 19 synapses and for the control genotype at least 29 synapses were analyzed. Statistical analysis was performed in Graphpad prism (version 5.00 for Windows, GraphPad Software, San Diego California USA, www.graphpad.com).
Dendritic morphology of class IV dendritic arborization neurons
Dissection and immunostaining was performed as described above, but for imaging the dorsal dendritic arborization C (ddaC) class IV dendritic arborization neurons larval were opened along the ventral midline (Brent et al., 2009). Genotypes analyzed were Git RNAi: UAS-RNAiGit/477-GAL4, UAS-mCD8::GFP; +/ppk-GAL4), and the control: +/477-GAL4, UAS-mCD8::GFP; +/ppk-GAL4. The 477 and ppk promoters simultaneously drive RNAi and expression of mCD8::GFP in a tissue-specific manner. Antibodies used were 1:100 Rat anti-mCD8 primary antibody and 1:200 Goat-anti-Rat Alexa Fluor 488. Z-stack images were taken at a Zeiss LSM 510 confocal microscope with a 20x objective. Z-stacks were imported into NeuronStudio (version 0.9.92, http://research.mssm.edu/cnic/tools-ns.html) for generation of neuronal reconstructions and Sholl analysis (10 μm interval) (Wearne et al., 2005). Tracing files were analyzed with L-Measure (version v5.2, (Scorcioni et al., 2008)) and significance was analyzed using the Student’s (equal variance) or Welch’s t-test (unequal variance).
Drosophila locomotor activity
Locomotor activity of individual male flies was recorded with the Drosophila Activity Monitor (DAM) system (Trikinetics, Waltham, MA) (Catterson et al., 2010; Suh and Jackson, 2007) to assess whether Git pan-neuronal knockdown flies displayed hyperactive behavior or sleep regulation defects. Activity of 3-5 days old male flies was recorded over 4 days on a 12-h light:dark cycle and the average daily activity of at least 25 flies for each genotype was calculated. Locomotor activity data were analyzed in pySolo (Gilestro and Cirelli, 2009), modified to analyze activity and sleep (the latter defined as 5-min of inactivity (Rosato and Kyriacou, 2006)) between 120-540 min relative day and 840-1260 min relative night to reflect the stable locomotor activity in those intervals. Statistical analysis was performed in Graphpad prism (version 5.00 for Windows, GraphPad Software, San Diego California USA, www.graphpad.com). T-tests were performed on summarized statistics.
Results
Association between the GIT1 locus and ADHD
Demographic characteristics of the different cohorts are presented in Table 1. Testing whether variation in the GIT1 locus (including SNP rs550818) altered ADHD risk we found that neither the SNP rs550818 (P=0.49; odds ratio 1.022; 95% confidence interval (CI) 0.959 – 1.088) nor the GIT1 locus showed association with ADHD in the PGC ADHD meta-analysis data (N=19,210, P=0.465, Figure 1). Power analysis showed that the test was highly powered to detect an association with a genotype relative risk (GRR) ≥1.1 (for range of GRRs see Supplementary Table 6).
Figure 1.
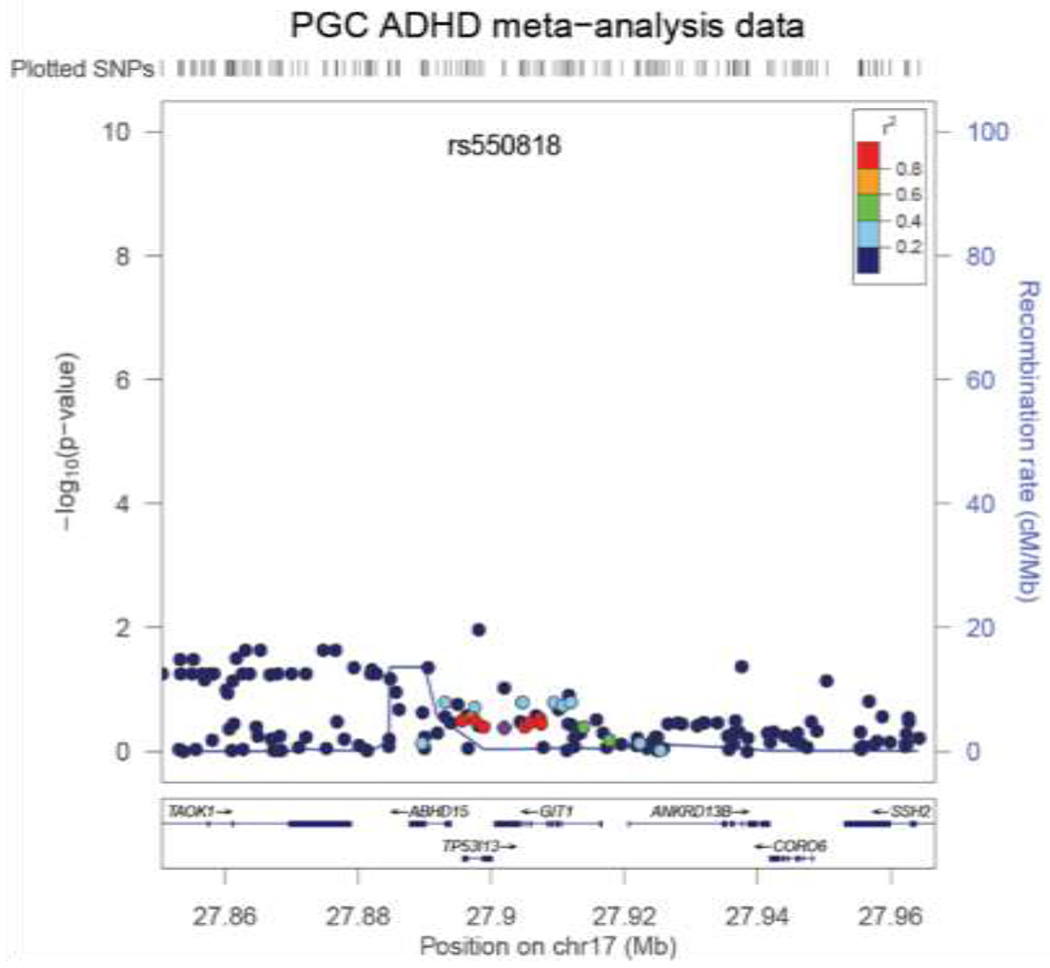
LocusZoom (Pruim et al., 2010) plot of association results of the PGC ADHD meta-analysis for GIT1 including flanking regions of 25 kb on each site. Neither rs550818 (marked as purple index SNP), nor other SNPs within the gene range of GIT1 showed association with ADHD susceptibility.
Association between the GIT1 locus and quantitative measures related to ADHD in the IMpACT-NL cohort
We did not find an association of SNP rs550818 or the GIT1 locus with self-reported hyperactivity/impulsivity or inattentive symptom counts (N=115, Pcorrected > 0.05, and Table 2) in the IMpACT-NL cohort (for details on demographics see Supplementary Table 7). Previously, Won and others investigated the effect of rs550818 on sustained attention in a continuous performance task and they studied the effect of Git1 deficiency in mice on working memory. Therefore, we tested the effect of rs550818 genotype and the GIT1 locus on neuropsychological performance in the same cognitive domains. The association results between our genetic variables and outcomes of the SAD task (mean series completion time, SD series completion time, SD series errors, and the response bias) or the Digit Span task (forward and backward condition) were not significant (all P-values > 0.05, Table 2). Testing neuropsychological measurements in additional domains of cognitive functioning (reaction time, sustained attention, inhibition, impulsivity, delay aversion, motor control, and set shifting; for description of variables see Supplementary Table 2) did not provide evidence for association with the rs550818 genotype or the GIT1 locus (Pcorrected for all tests > 0.05, Supplementary Table 8). However, power of these analyses was limited; the IMpACT-NL sample provided 32% power to detect an association explaining 1% of the variance (see more elaborate power analysis in Supplementary Table 9).
Table 2.
Results of single-SNP and gene-based (rs550818 and GIT1) association analyses for self-reported ADHD symptom counts, Sustained Attention Dots (SAD) task and Digit Span task in the IMpACT-NL cohort.
| Trait | Variable | N (HC/ADHD) | P rs550818 | β | 95% CI | P GIT1 c |
|---|---|---|---|---|---|---|
| Self report symptom score a | Hyperactivity/impulsivity | -/115 | 0.413 | 0.134 | −0.191 - 0.458 | 0.477 |
| Inattention | -/115 | 0.593 | 0.088 | −0.237 - 0.413 | 0.944 | |
| Total | -/115 | 0.395 | 0.140 | −0.186 - 0.466 | 0.614 | |
| Sustained Attention Dots Task b | Mean series completion time | 99/95 | 0.445 | −0.091 | −0.324 - 0.143 | 0.696 |
| Standard deviation series completion time* | 99/95 | 0.142 | −0.173 | −0.405 - 0.059 | 0.563 | |
| Standard deviation series errors* | 99/95 | 0.439 | −0.089 | −0.316 - 0.138 | 0.808 | |
| Response bias* | 99/95 | 0.150 | −0.163 | −0.387 - 0.061 | 0.424 | |
| Digit Span Task b | Forward score raw* | 100/98 | 0.511 | −0.076 | −0.304 - 0.152 | 0.433 |
| Backward score raw | 100/98 | 0.941 | 0.008 | −0.217 - 0.233 | 0.831 | |
Age and gender were used as covariates and 52 SNPs were considered for the gene-based analysis.
Age, gender and diagnostic status were used as covariates. 52 SNPs were considered in the gene-based analysis.
Effect sizes and 95% confidence intervals could not be estimated for the gene-based association tests.
Variables that are significantly different between adult ADHD patients and healthy controls after correction for multiple testing (Mostert et al., submitted).
Association between the GIT1 locus, brain volume and white matter integrity of microstructure
We investigated the effect of the GIT1 locus on brain volume measurements in the case-control sample IMpACT-NL (N=203) and the population-based cohort BIG (N=1,300). Given the known involvement of Git1 in neuronal development (Segura et al., 2007; Za et al., 2006; Zhang et al., 2005), we tested associations of genetic variation in GIT1 with global brain measures for gray matter, white matter, and total brain volumes. None of these analyses yielded significant associations (Pcorrected for all tests > 0.05, and Table 3). Additionally, we performed exploratory voxel-wise brain-wide analyses of gray and white matter volume, and of microstructural integrity in the BIG cohort for rs550818 to identify potential local effects of GIT1 variation. Neither the VBM analyses for gray or white matter volume, nor the voxel-wise analyses for mean diffusivity and fractional anisotropy showed significant associations with rs550818 genotype (data not shown). While the IMpACT-NL sample again only provided limited power for this analysis (Supplementary Table 9), the analyses in the BIG cohort were highly powered to detect associations explaining between 1% (>95%) and 0.5% (>72%) of variance (Supplementary Table 9).
Table 3.
Results of single-SNP and gene-based (rs550818 and GIT1) association analyses for brain volumes in the IMpACT-NL and BIG cohort
| IMpACT-NL cohort a | BIG cohort c | |||||||
|---|---|---|---|---|---|---|---|---|
| P rs550818 | β | 95% CI | P GIT1 b, e | P rs550818 | β | 95% CI | P GIT1 d, e | |
| Total brain volume | 0.658 | 0.039 | −0.134 - 0.211 | 0.563 | 0.897 | 0.511 | −2.269 - 3.292 | 0.415 |
| Total gray matter volume | 0.622 | −0.035 | −0.175 - 0.105 | 0.497 | 0.970 | 0.069 | −0.624 - 0.761 | 0.791 |
| Total white matter volume | 0.361 | 0.079 | −0.084 - 0.229 | 0.154 | 0.934 | 0.150 | −0.874 - 1.174 | 0.453 |
N=203 (101 ADHD patients). Adult ADHD patients do not differ in brain volume from healthy controls (Supplementary Table 5).
52 SNPs were considered for the gene-based analysis.
N=1,300.
43 SNPs were considered for the gene-based analysis. Total brain volume is the sum of total gray and white volume. Age, gender, magnetic field strength, and gray matter when testing for white matter and vice versa were used as covariates.
Effect sizes and 95% confidence intervals could not be estimated for the gene-based association tests.
Functional characterization: effect of rs550818 on GIT1 mRNA expression
Previously, it was reported that the minor allele (A) of the SNP rs550818 caused a reduction in luciferase transcription in HEK293 cells (Won et al., 2011). We therefore investigated this effect in blood samples of adult ADHD patients and healthy controls from the IMpACT-NL cohort. High quality RNA samples were available for 121 individuals (55 healthy controls and 66 individuals with ADHD); the G allele was the major allele in our European Caucasian sample. Indeed, SNP rs550818 genotype significantly affected GIT1 mRNA expression in the total sample independent of diagnostic status (N=121, bstandardized=−0.220, P=0.015); carriers of the common allele (GG; N=63) had highest expression, while heterozygotes (GA; N=53) had intermediate expression and the carriers of the risk-associated genotype (AA; N=5) showed lowest expression (Figure 2A). GIT1 mRNA expression levels did not differ significantly between healthy controls and participants with ADHD (t=1,559 df=119, P=0.1217) (Figure 2B).
Figure 2.
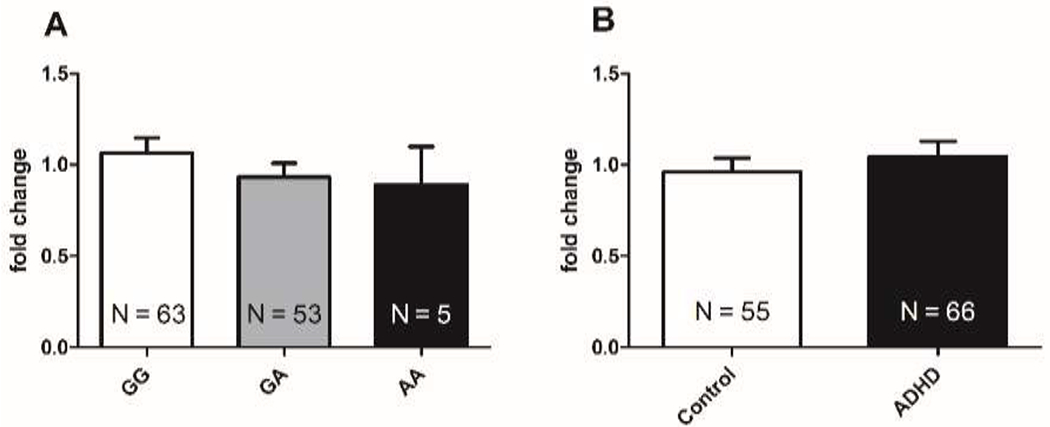
GIT1 mRNA expression in human blood samples was dependent on rs550818 genotype but not diagnostic status in participants from the IMpACT-NL cohort. A) The minor A allele reduced GIT1 mRNA expression in human blood samples (N=121, b=−0.116, t(119)=−2.462, P=0.015, R2=0.048). Bar charts represent mean and 95% confidence interval. B) GIT1 mRNA expression fold change did not differ in healthy controls compared to individuals with ADHD (P=0.1217; two-tailed Student’s t-test). Individuals with ADHD were distributed across the different genotype groups as following: NGG=26, NGA=26 and NAA=3.
Functional characterization: effect of Git RNAi on neuronal morphology and locomotor activity in Drosophila
The fruit fly Drosophila melanogaster is a suitable model to study the behavioral and cellular consequences of genes associated to genetic disorders (van der Voet et al., 2014). To model the ADHD risk allele and validate the function of GIT1 in neuronal morphology, we targeted the Drosophila GIT1 ortholog, Git, using conditional RNA interference. The effect of the neuronal Git knockdown on synaptic organization was studied at the neuromuscular junction (NMJ). The Drosophila larval NMJ is a well-established synaptic model system that shares major features with central excitatory synapses in the mammalian brain (Koh et al., 2000) and has successfully been used for characterizing a number of Drosophila models of neurological diseases, including schizophrenia (Dickman and Davis, 2009) and intellectual disability disorders (Bayat et al., 2011; Liu et al., 2011; Schenck et al., 2003; Zweier et al., 2009). Pan-neuronal knockdown of Git resulted in a significant decrease in the number of neurotransmitter release sites, so-called active zones, per synaptic terminal compared to controls (0.87 fold, P=0.027), whereas the total area of the neuromuscular junction (NMJ) was not changed (P=0.96) (Figure 3A+B). Quantitative evaluation of synaptic terminal morphology revealed abnormal branching of synaptic terminals in the Git RNAi knockdown condition (Figure 3B). Both the number of branches and branching points were significantly increased at NMJs of the Git RNAi line when compared to control flies (1.49 and 1.86 fold, P=0.0002 and 0.0032, respectively).
Figure 3.
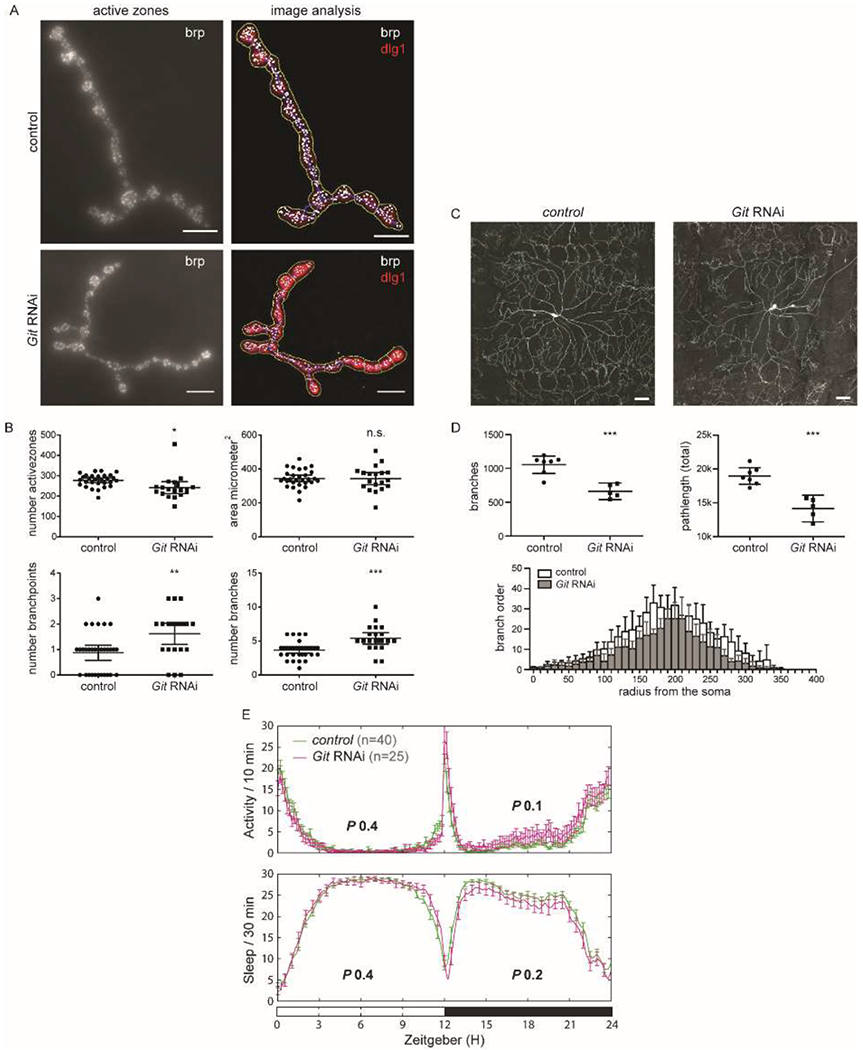
Git knockdown in Drosophila interfered with synapse and dendrite morphology, but did not alter locomotor activity. A) Representative Drosophila synaptic terminal at the neuromuscular junction (NMJ) for control and Git RNAi larvae. Overall morphology of synaptic terminals were visualized with an antibody against the disc large 1 (dlg1) protein, active zones, the presynaptic sites of neurotransmitter release, with an antibody against the active-zone component bruchpilot (brp). Each white foci represents one active zone. Images were quantitatively analyzed using an in house-developed Fiji macro (Schuurs-Hoeijmakers et al., 2012). Scale bar 10 μm. B) Quantitative analysis of NMJs showed a significant decrease in active zone count (P=0.027), increase of branch count (P=0.0002) and branching point count (P=0.0032), while the area was not different (P=0.96). Scatter plots represent individual measurements (Git RNAi N≥19 and control N≥29), mean and error bars indicate the 95% confidence interval. C) Representative Drosophila class IV da neurons show abnormal dendritic morphology in Git RNAi compared to wildtype control animals. Scale bar 50 μm. D) Quantitaive analysis of dendritic trees revealed that Git RNAi (N=5) reduces the number of branches (P=0.0003) and total branch path length (P=0.0002), compared to the control (N=7). Sholl analysis reveals that the branch order throughout the neuron is reduced. Scatter plots represent individual measurements. Error bars indicate the 95% confidence interval. E) Locomotor activity profiling of adult Git RNAi and control flies revealed normal activity or sleep parameters (values for day (Zeitgeber 0-12h, white bar) and night (Zeitgeber 12-24h, black bar) periods indicated). * P < 0.05; ** P < 0.01; ***P < 0.001. P-values were derived from two-sided Student’s t-tests, except for not-normally distributed data, then a Wilcoxon-ranked test was performed.
Drosophila class IV dendritic arborization (da) neurons are complex and provide a good model for studying dendritic morphology (Jan and Jan, 2010). Knockdown of Git in these neurons induced abnormal dendritic complexity (Figure 3C). Quantification of the traced, reconstructed neurons revealed a reduced number of branches, bifurcations, and terminal tips in the knockdown condition compared to control (0.63 fold, P=0.0003 for all three parameters) (Figure 3D, Supplementary Figure 2). The average branch length did not differ significantly (P=0.061), but the total branch path length was decreased in the mutant neurons (0.74 fold, P=0.0002) (Supplementary Figure 2, Figure 3D). These data suggest that Git knockdown results in a branching defect. Consistently, the maximum branch order was reduced (0.84 fold, P=0.017) and a Sholl analysis that plots the branch order as a function of soma distance, reveals a reduction in branch order throughout the neuron (Figure 3D). Other dendritic parameters, namely branch contraction and partition asymmetry, were not significantly different (Supplementary Figure 2).
We have recently demonstrated increased locomoter activity and decreased sleep in ADHD Drosophila models (van der Voet et al., 2015). We therefore assessed whether Git pan-neuronal knockdown flies also affect locomotor behavior. No defects in activity levels were found (day: P=0.4 and night: P=0.1, respectively; Figure 3E). Sleep of Git knockdown flies did also not differ from their genetic background controls (P=0.4 and P=0.2, respectively; Figure 3E). These data suggest that despite a role in regulating synapse and dendrite morphogenesis, Git knockdown does not cause increased locomotion.
Discussion
In the original publication of GIT1 as a risk gene for ADHD, 27 SNPs in a 19 kb region encompassing the GIT1 gene had been analyzed. Of those, eight SNPs had been shown to be polymorphic in a Korean childhood sample (N=388), and rs550818 was found associated with ADHD (Won et al., 2011). In addition, homozygous deficiency of Git1 in mice resulted in increased locomotor activity (Won et al., 2011). In this study we performed a multilevel investigation of the role of the GIT1 locus in ADHD risk and related traits (behavioral and MRI-derived) as well as functional characterization of the GIT1 gene in humans and in Drosophila. Our results clearly show that the GIT1 locus is not associated with ADHD risk, ADHD symptom counts, neuropsychological performance, or brain volume and white matter integrity variation in large human data sets. However, we demonstrated that rs550818 is indeed functional, as it lowered GIT1 mRNA expression in human blood samples independently of ADHD diagnostic status. Using Drosophila as a model system, we showed that neuron-specific Git knockdown altered synaptic and dendritic morphology, whereas locomotor activity parameters remained unchanged.
Using the largest currently available ADHD sample, the PGC ADHD meta-analysis sample (Ncases=5,621, Ncontrols=13,589) we analyzed SNP rs550818 as well as the combined effects of all SNPs within the GIT1 locus. Although our study had sufficient statistical power to detect an association, we were unable to replicate the initial finding by Won and coworkers. This is consistent with the results of an earlier replication attempt in a Brazilian childhood ADHD sample (Salatino-Oliveira et al., 2012). Despite the non-significant association, we showed that the effect is in the same direction as previously reported (Won et al., 2011), whereas the Brazilian study reported an odds ratio of 0.749, indicating an opposite directionality (Salatino-Oliveira et al., 2012). Importantly though, samples used in our and in the Brazilian study consisted (mainly) of participants of Caucasian ethnic origin, while all participants in the first study had an Asian ethnic background (Salatino-Oliveira et al., 2012; Won et al., 2011). Whereas allele frequencies of the present study and the Brazilian study (Salatino-Oliveira et al., 2012) are consistent with frequencies found in the European population (MAF=0.27 for allele A), frequencies in Asian populations – including the Korean one (Won et al., 2011) – strongly differ from this (MAF between 0.06 and 0.09). Therefore, the lack of replication can be difficult to interpret, as diverse genetic backgrounds and variable environmental exposures may lead to distinct causal genetic variants in different populations (Campbell and Rudan, 2002).
Individuals with ADHD frequently display cognitive deficits, including impairments in inhibition, attentional processing, and increased reaction time variability (Castellanos et al., 2006; Kofler et al., 2013; Sonuga-Barke et al., 2010). A number of such cognitive domains has also been found impaired in Git1-deficient mice. For example, Git1 knockout mice showed impaired spatial learning and memory in the Morris water maze task and impaired recognition memory during a novel-object recognition task (Won et al., 2011). Therefore, we tested the GIT1 locus for association with cognitive performance in relevant domains. However, in concordance with the findings of Won and coworkers, who had applied a continuous performance test in the Korean childhood sample (Won et al., 2011), we did not find an effect of rs550818 or the entire GIT1 locus on sustained attention in our adult ADHD sample, nor did neuropsychological performance in any of the other tested domains show association with GIT1. Additional cognitive deficits observed in Git1 knockout mice, which were not tested in the current study, include impaired fear response and reduced adaptation to novel and changing environments (Menon et al., 2010; Schmalzigaug et al., 2009). Tasks quantifying fear response, like the eye blink component of the startle response (Davis, 2006; Hajcak et al., 2009), and those measuring reversal learning and tapping into adaptability might therefore be interesting phenotypes for future studies in humans in relation to genetic variation in the GIT1 locus.
Git1 knockout mice exhibit alterations in dendritic length and spine density (Fiuza et al., 2013; Menon et al., 2010; Zhang et al., 2005). ADHD has been associated with volume differences in the brain (Onnink et al., 2014; van Ewijk et al., 2012), and we have shown that ADHD symptoms are associated with total brain volume in the general population (Hoogman et al., 2012). Thus, we investigated the role of GIT1 in global and voxel-wise brain volume measures and microstructural integrity. However, we could not find an effect of GIT1 on any brain measurements. In a way, this is consistent with the findings in mice, where changes of neuronal morphology did not translate into structural abnormalities observable at the macroscopic level in 3-month-old mouse brains in Git1 knockout mice (Menon et al., 2010).
Won and colleagues had shown that the minor allele of rs550818 (A) reduced luciferase signal in an in vitro transcription assay (Won et al., 2011). In vivo, in human blood samples, we were able to confirm this effect of the A allele of rs550818, showing that GIT1 mRNA expression was reduced in carriers of the minor allele. Generally, eQTLs can be specific to certain tissues, cells, anatomical regions and diseases (GTex Consortium 2013; (Emilsson et al., 2008). Therefore, our findings cannot necessarily be translated to other tissue types, e.g. the brain (McKenzie et al., 2014). However, a recent large study shows that there is also overlap between eQTLs from peripheral blood and eQTLs in brain (Wright et al., 2014), which implies that some local regulatory variants might show ubiquitous effects (Kim et al., 2014). In the case of the GIT1 eQTL, the fact that consistent effects have been found in vitro and in vivo might indeed indicate that effects are ubiquitous. However, this effect does not seem to be strong enough to modify brain structure, cognitive performance, or ADHD-related behavior.
Git1 is responsible for recruiting proteins to the synapse, and Git1 knockout mice displayed decreased dendritic length and spine density (Menon et al., 2010; Zhang et al., 2005). A recent study identified Drosophila Git as a component of the active zone-associated cytomatrix and as a regulator of synaptic vesicle endocytosis and recycling (Podufall et al., 2014), although the actual number of active zones had not been evaluated in this study. Consistent with Git being a component of active zones, we did observe a mild but significant reduction in the number of active zones. We further showed that neuronal Git RNAi knockdown interferes with synaptic terminal branching and dendrite formation in Drosophila. This is consistent with earlier findings showing that various trafficking mutants of genes involved in organelle trafficking processes result in alterations of dendrite morphogenesis (Corty et al., 2009). Altogether, these observations support an important role for Git in synaptic and dendritic organization. Despite altered neuronal morphology, however, Git knockdown did not result in the locomotor hyperactivity that has been observed for other Drosophila models of ADHD-associated genes (van der Voet et al., 2015). Our knockdown is likely not to remove all of Git protein from the Drosophila brain. Also, the GIT1 variant, even if homozygous, causes only a slight reduction in GIT1 expression. Importantly, the two-fold higher spontaneous locomotor activity in an open-field test in Git1 knockout mice (Won et al., 2011) was only observed in the homozygous condition with no detectable protein. Mice with a heterozygous deletion showed normal locomotor activity, in agreement with our findings in flies and humans.
At the cellular level, the effect of GIT1 knockdown has been demonstrated in different model systems. We showed in human blood samples, that rs550818 affects GIT1 gene expression. Interestingly, the cellular effects in the Git1 knockout mouse model of Won and others seemed to be cell specific, as specifically inhibitory synaptic transmission was decreased (Won et al., 2011). Won and colleagues suggested that the resulting increase in neuronal excitability might contribute to the development of ADHD-like phenotypes. Although we demonstrated that genetic variation in the GIT1 locus is not associated with ADHD in humans, we cannot rule out any other effects of the GIT1 locus on different behavioral characteristics. The observed effect of Git1 deficiency in mice on fear learning and adaptation to new environments, might be interesting starting points for future studies in humans.
The present findings should be viewed in light of several strengths and limitations. The main strengths of our study are its comprehensive approach on multiple levels and the use of the largest and well powered ADHD meta-analysis data set currently available. Moreover, we did not only test association for a single SNP, but also investigated the combined effect of all SNPs within the GIT1 locus available in our data sets. We also studied the role of the GIT1 locus in various neuropsychological measures and investigated potential effects of GIT1 on brain morphology in humans, in patients as well as a large population sample. Next to the association analyses, we also assessed the functional role of SNP rs550818 by mRNA expression analysis. For our functional analyses we used a novel and validated fly model for ADHD-related hyperactivity, which has been shown to be very useful in characterizing effects of ADHD candidate genes on synapse morphology and locomotor behavior (van der Voet et al., 2015). A clear weakness of our study was the limited size of our patient sample for the neuropsychological analyses, which might have been underpowered to reliably detect genetic effects in a relevant range of explained phenotypic variance. Additionally, the association of rs550818 with ADHD was originally identified in a childhood sample (Won et al., 2011), whereas our association analyses for neuropsychological and brain-related traits were performed in adult participants. This can be criticized as we know that differential genotype-phenotype association can exist at different ages and that genetic and neurocognitive mechanisms underlying ADHD may change throughout life (Greven et al., 2011; Larsson et al., 2011; Thissen et al., 2015). To overcome these limitations, it would be recommendable to also test for association with the number of ADHD symptoms in larger samples (of children) with ADHD. Furthermore, this study focused only on common genetic single nucleotide variants (SNVs), although it is known that these cannot completely explain the heritability of ADHD (Gratten et al., 2014). Therefore, rare genetic variation within the GIT1 locus, be it single nucleotide or structural variants, might still play a role in ADHD. However, we already showed that an alteration of GIT1 mRNA expression does – if not complete – not affect behavior. Even when Git is knocked down strongly in neurons, no behavioral changes in the model system were observed. Thus, we think it is unlikely that rare genetic variants within the GIT1 locus will contribute to ADHD. Lastly, the gene-based testing methods we used did not provide us with effect size measures, which can help to better interpret the results of association findings.
In summary, our findings do not provide evidence for an impact of the GIT1 locus on ADHD risk or the variation of ADHD-related traits in humans. Although rs550818 is associated with the variation of GIT1 expression in blood, this does not appear to be a risk factor for ADHD. Therefore, GIT1 is not supported as a candidate gene for this psychopathology, despite its reproduced and newly identified functional roles in neuronal morphology. Our study stresses the need for multi-level approaches in the study of genetic risk factors influencing the neurobiological mechanisms underlying ADHD etiology.
Supplementary Material
References
- Albertinazzi C, Za L, Paris S, and de Curtis I (2003). ADP-ribosylation factor 6 and a functional PIX/p95-APP1 complex are required for Rac1B-mediated neurite outgrowth. Molecular biology of the cell 14, 1295–1307. [DOI] [PMC free article] [PubMed] [Google Scholar]
- American Psychiatric Association (2013). Diagnostic and statistical manual of mental disorders: DSM-V, Vol 5th ed (Washington, DC: American Psychiatric Press; ). [Google Scholar]
- Ashburner J, and Friston KJ (2000). Voxel-based morphometry--the methods. NeuroImage 11, 805–821. [DOI] [PubMed] [Google Scholar]
- Bayat V, Jaiswal M, and Bellen HJ (2011). The BMP signaling pathway at the Drosophila neuromuscular junction and its links to neurodegenerative diseases. Current opinion in neurobiology 21, 182–188. [DOI] [PMC free article] [PubMed] [Google Scholar]
- Bralten J, Arias-Vasquez A, Makkinje R, Veltman JA, Brunner HG, Fernandez G, et al. (2011). Association of the Alzheimer’s gene SORL1 with hippocampal volume in young, healthy adults. The American journal of psychiatry 168, 1083–1089. [DOI] [PubMed] [Google Scholar]
- Brand AH, and Perrimon N (1993). Targeted gene expression as a means of altering cell fates and generating dominant phenotypes. Development 118, 401–415. [DOI] [PubMed] [Google Scholar]
- Brent JR, Werner KM, and McCabe BD (2009). Drosophila larval NMJ dissection. Journal of visualized experiments : JoVE. [DOI] [PMC free article] [PubMed] [Google Scholar]
- Buitelaar JK, Kan CC, Asherson P (2011). ADHD in Adults: Characterization, Diagnosis and Treatment (Cambridge University Press; ). [Google Scholar]
- Burt SA (2009). Rethinking environmental contributions to child and adolescent psychopathology: a meta-analysis of shared environmental influences. Psychological bulletin 135, 608–637. [DOI] [PubMed] [Google Scholar]
- Campbell H, and Rudan I (2002). Interpretation of genetic association studies in complex disease. The pharmacogenomics journal 2, 349–360. [DOI] [PubMed] [Google Scholar]
- Castellanos FX, Lee PP, Sharp W, Jeffries NO, Greenstein DK, Clasen LS, et al. (2002). Developmental trajectories of brain volume abnormalities in children and adolescents with attention-deficit/hyperactivity disorder. JAMA : the journal of the American Medical Association 288, 1740–1748. [DOI] [PubMed] [Google Scholar]
- Castellanos FX, Sonuga-Barke EJ, Milham MP, and Tannock R (2006). Characterizing cognition in ADHD: beyond executive dysfunction. Trends in cognitive sciences 10, 117–123. [DOI] [PubMed] [Google Scholar]
- Catterson JH, Knowles-Barley S, James K, Heck MM, Harmar AJ, and Hartley PS (2010). Dietary modulation of Drosophila sleep-wake behaviour. PloS one 5, e12062. [DOI] [PMC free article] [PubMed] [Google Scholar]
- Corty MM, Matthews BJ, and Grueber WB (2009). Molecules and mechanisms of dendrite development in Drosophila. Development 136, 1049–1061. [DOI] [PMC free article] [PubMed] [Google Scholar]
- Dalsgaard S, Østergaard SD, Leckman JF, Mortensen PB, and Pedersen MG (2015). Mortality in Children, Adolescents and Adults with Attention Deficit Hyperactivity Disorder - a nationwide cohort study. Lancet in press. [DOI] [PubMed] [Google Scholar]
- Davis M (2006). Neural systems involved in fear and anxiety measured with fear-potentiated startle. The American psychologist 61, 741–756. [DOI] [PubMed] [Google Scholar]
- Dickman DK, and Davis GW (2009). The schizophrenia susceptibility gene dysbindin controls synaptic homeostasis. Science 326, 1127–1130. [DOI] [PMC free article] [PubMed] [Google Scholar]
- Dietzl G, Chen D, Schnorrer F, Su KC, Barinova Y, Fellner M, et al. (2007). A genome-wide transgenic RNAi library for conditional gene inactivation in Drosophila. Nature 448, 151–156. [DOI] [PubMed] [Google Scholar]
- Dom G, D’Haene P, Hulstijn W, and Sabbe B (2006). Impulsivity in abstinent early- and late-onset alcoholics: differences in self-report measures and a discounting task. Addiction 101, 50–59. [DOI] [PubMed] [Google Scholar]
- Emilsson V, Thorleifsson G, Zhang B, Leonardson AS, Zink F, Zhu J, et al. (2008). Genetics of gene expression and its effect on disease. Nature 452, 423–428. [DOI] [PubMed] [Google Scholar]
- Faraone SV, Perlis RH, Doyle AE, Smoller JW, Goralnick JJ, Holmgren MA, et al. (2005). Molecular genetics of attention-deficit/hyperactivity disorder. Biological psychiatry 57, 1313–1323. [DOI] [PubMed] [Google Scholar]
- Fiuza M, Gonzalez-Gonzalez I, and Perez-Otano I (2013). GluN3A expression restricts spine maturation via inhibition of GIT1/Rac1 signaling. Proceedings of the National Academy of Sciences of the United States of America 110, 20807–20812. [DOI] [PMC free article] [PubMed] [Google Scholar]
- Franke B, Faraone SV, Asherson P, Buitelaar J, Bau CH, Ramos-Quiroga JA, et al. (2012). The genetics of attention deficit/hyperactivity disorder in adults, a review. Molecular psychiatry 17, 960–987. [DOI] [PMC free article] [PubMed] [Google Scholar]
- Franke B, Neale BM, and Faraone SV (2009a). Genome-wide association studies in ADHD. Human genetics 126, 13–50. [DOI] [PMC free article] [PubMed] [Google Scholar]
- Franke B, Neale BM, and Faraone SV (2009b). Genome-wide association studies in ADHD. Human genetics 126, 13–50. [DOI] [PMC free article] [PubMed] [Google Scholar]
- Franke B, and Reif A (2013). IMpACTing on adult ADHD research. European neuropsychopharmacology : the journal of the European College of Neuropsychopharmacology 23, 413–415. [DOI] [PubMed] [Google Scholar]
- Franke B, Vasquez AA, Johansson S, Hoogman M, Romanos J, Boreatti-Hummer A, et al. (2010a). Multicenter analysis of the SLC6A3/DAT1 VNTR haplotype in persistent ADHD suggests differential involvement of the gene in childhood and persistent ADHD. Neuropsychopharmacology : official publication of the American College of Neuropsychopharmacology 35, 656–664. [DOI] [PMC free article] [PubMed] [Google Scholar]
- Franke B, Vasquez AA, Veltman JA, Brunner HG, Rijpkema M, and Fernandez G (2010b). Genetic variation in CACNA1C, a gene associated with bipolar disorder, influences brainstem rather than gray matter volume in healthy individuals. Biological psychiatry 68, 586–588. [DOI] [PubMed] [Google Scholar]
- Frodl T, and Skokauskas N (2012). Meta-analysis of structural MRI studies in children and adults with attention deficit hyperactivity disorder indicates treatment effects. Acta psychiatrica Scandinavica 125, 114–126. [DOI] [PubMed] [Google Scholar]
- Genomes Project C, Abecasis GR, Altshuler D, Auton A, Brooks LD, Durbin RM, et al. (2010). A map of human genome variation from population-scale sequencing. Nature 467, 1061–1073. [DOI] [PMC free article] [PubMed] [Google Scholar]
- Gilestro GF, and Cirelli C (2009). pySolo: a complete suite for sleep analysis in Drosophila. Bioinformatics 25, 1466–1467. [DOI] [PMC free article] [PubMed] [Google Scholar]
- Gizer IR, Ficks C, and Waldman ID (2009). Candidate gene studies of ADHD: a meta-analytic review. Hum Genet 126, 51–90. [DOI] [PubMed] [Google Scholar]
- Gratten J, Wray NR, Keller MC, and Visscher PM (2014). Large-scale genomics unveils the genetic architecture of psychiatric disorders. Nature neuroscience 17, 782–790. [DOI] [PMC free article] [PubMed] [Google Scholar]
- Greven CU, Rijsdijk FV, and Plomin R (2011). A twin study of ADHD symptoms in early adolescence: hyperactivity-impulsivity and inattentiveness show substantial genetic overlap but also genetic specificity. Journal of abnormal child psychology 39, 265–275. [DOI] [PubMed] [Google Scholar]
- Guadalupe T, Zwiers MP, Teumer A, Wittfeld K, Vasquez AA, Hoogman M, et al. (2014). Measurement and genetics of human subcortical and hippocampal asymmetries in large datasets. Human brain mapping 35, 3277–3289. [DOI] [PMC free article] [PubMed] [Google Scholar]
- Haavik J, Halmoy A, Lundervold AJ, and Fasmer OB (2010). Clinical assessment and diagnosis of adults with attention-deficit/hyperactivity disorder. Expert review of neurotherapeutics 10, 1569–1580. [DOI] [PubMed] [Google Scholar]
- Hajcak G, Castille C, Olvet DM, Dunning JP, Roohi J, and Hatchwell E (2009). Genetic variation in brain-derived neurotrophic factor and human fear conditioning. Genes, brain, and behavior 8, 80–85. [DOI] [PMC free article] [PubMed] [Google Scholar]
- Hawi Z, Cummins TD, Tong J, Johnson B, Lau R, Samarrai W, et al. (2015). The molecular genetic architecture of attention deficit hyperactivity disorder. Molecular psychiatry 20, 289–297. [DOI] [PubMed] [Google Scholar]
- Hinney A, Scherag A, Jarick I, Albayrak O, Putter C, Pechlivanis S, et al. (2011). Genome-wide association study in German patients with attention deficit/hyperactivity disorder. American journal of medical genetics Part B, Neuropsychiatric genetics : the official publication of the International Society of Psychiatric Genetics 156B, 888–897. [DOI] [PubMed] [Google Scholar]
- Hoogman M, Guadalupe T, Zwiers MP, Klarenbeek P, Francks C, and Fisher SE (2014). Assessing the effects of common variation in the FOXP2 gene on human brain structure. Frontiers in human neuroscience 8, 473. [DOI] [PMC free article] [PubMed] [Google Scholar]
- Hoogman M, Rijpkema M, Janss L, Brunner H, Fernandez G, Buitelaar J, et al. (2012). Current self-reported symptoms of attention deficit/hyperactivity disorder are associated with total brain volume in healthy adults. PloS one 7, e31273. [DOI] [PMC free article] [PubMed] [Google Scholar]
- Huijbregts SC, de Sonneville LM, van Spronsen FJ, Licht R, and Sergeant JA (2002). The neuropsychological profile of early and continuously treated phenylketonuria: orienting, vigilance, and maintenance versus manipulation-functions of working memory. Neuroscience and biobehavioral reviews 26, 697–712. [DOI] [PubMed] [Google Scholar]
- Huijbregts SC, Warren AJ, de Sonneville LM, and Swaab-Barneveld H (2008). Hot and cool forms of inhibitory control and externalizing behavior in children of mothers who smoked during pregnancy: an exploratory study. Journal of abnormal child psychology 36, 323–333. [DOI] [PMC free article] [PubMed] [Google Scholar]
- Jan Y-N, and Jan LY (2010). Branching out: mechanisms of dendritic arborization. Nature reviews Neuroscience 11, 316–328. [DOI] [PMC free article] [PubMed] [Google Scholar]
- Kim S, Ko J, Shin H, Lee JR, Lim C, Han JH, et al. (2003). The GIT family of proteins forms multimers and associates with the presynaptic cytomatrix protein Piccolo. The Journal of biological chemistry 278, 6291–6300. [DOI] [PubMed] [Google Scholar]
- Kim Y, Xia K, Tao R, Giusti-Rodriguez P, Vladimirov V, van den Oord E, et al. (2014). A meta-analysis of gene expression quantitative trait loci in brain. Translational psychiatry 4, e459. [DOI] [PMC free article] [PubMed] [Google Scholar]
- Kofler MJ, Rapport MD, Sarver DE, Raiker JS, Orban SA, Friedman LM, et al. (2013). Reaction time variability in ADHD: a meta-analytic review of 319 studies. Clinical psychology review 33, 795–811. [DOI] [PubMed] [Google Scholar]
- Koh YH, Gramates LS, and Budnik V (2000). Drosophila larval neuromuscular junction: molecular components and mechanisms underlying synaptic plasticity. Microscopy research and technique 49, 14–25. [DOI] [PubMed] [Google Scholar]
- Kortte KB, Horner MD, and Windham WK (2002). The trail making test, part B: cognitive flexibility or ability to maintain set? Applied neuropsychology 9, 106–109. [DOI] [PubMed] [Google Scholar]
- Larsson H, Dilshad R, Lichtenstein P, and Barker ED (2011). Developmental trajectories of DSM-IV symptoms of attention-deficit/hyperactivity disorder: genetic effects, family risk and associated psychopathology. Journal of child psychology and psychiatry, and allied disciplines 52, 954–963. [DOI] [PubMed] [Google Scholar]
- Lasky-Su J, Anney RJ, Neale BM, Franke B, Zhou K, Maller JB, et al. (2008a). Genome-wide association scan of the time to onset of attention deficit hyperactivity disorder. American journal of medical genetics Part B, Neuropsychiatric genetics : the official publication of the International Society of Psychiatric Genetics 147B, 1355–1358. [DOI] [PMC free article] [PubMed] [Google Scholar]
- Lasky-Su J, Neale BM, Franke B, Anney RJ, Zhou K, Maller JB, et al. (2008b). Genome-wide association scan of quantitative traits for attention deficit hyperactivity disorder identifies novel associations and confirms candidate gene associations. American journal of medical genetics Part B, Neuropsychiatric genetics : the official publication of the International Society of Psychiatric Genetics 147B, 1345–1354. [DOI] [PubMed] [Google Scholar]
- Lesch KP, Timmesfeld N, Renner TJ, Halperin R, Roser C, Nguyen TT, et al. (2008). Molecular genetics of adult ADHD: converging evidence from genome-wide association and extended pedigree linkage studies. Journal of neural transmission 115, 1573–1585. [DOI] [PubMed] [Google Scholar]
- Li Z, Chang SH, Zhang LY, Gao L, and Wang J (2014). Molecular genetic studies of ADHD and its candidate genes: A review. Psychiatry research. [DOI] [PubMed] [Google Scholar]
- Liu JZ, McRae AF, Nyholt DR, Medland SE, Wray NR, Brown KM, et al. (2010). A versatile gene-based test for genome-wide association studies. American journal of human genetics 87, 139–145. [DOI] [PMC free article] [PubMed] [Google Scholar]
- Liu Z, Huang Y, Zhang Y, Chen D, and Zhang YQ (2011). Drosophila Acyl-CoA synthetase long-chain family member 4 regulates axonal transport of synaptic vesicles and is required for synaptic development and transmission. The Journal of neuroscience : the official journal of the Society for Neuroscience 31, 2052–2063. [DOI] [PMC free article] [PubMed] [Google Scholar]
- Marchini J, Howie B, Myers S, McVean G, and Donnelly P (2007). A new multipoint method for genome-wide association studies by imputation of genotypes. Nature genetics 39, 906–913. [DOI] [PubMed] [Google Scholar]
- McKenzie M, Henders AK, Caracella A, Wray NR, and Powell JE (2014). Overlap of expression quantitative trait loci (eQTL) in human brain and blood. BMC medical genomics 7, 31. [DOI] [PMC free article] [PubMed] [Google Scholar]
- Menon P, Deane R, Sagare A, Lane SM, Zarcone TJ, O’Dell MR, et al. (2010). Impaired spine formation and learning in GPCR kinase 2 interacting protein-1 (GIT1) knockout mice. Brain research 1317, 218–226. [DOI] [PMC free article] [PubMed] [Google Scholar]
- Mick E, Todorov A, Smalley S, Hu X, Loo S, Todd RD, et al. (2010). Family-based genome-wide association scan of attention-deficit/hyperactivity disorder. Journal of the American Academy of Child and Adolescent Psychiatry 49, 898–905 e893. [DOI] [PMC free article] [PubMed] [Google Scholar]
- Neale BM, Lasky-Su J, Anney R, Franke B, Zhou K, Maller JB, et al. (2008). Genome-wide association scan of attention deficit hyperactivity disorder. American journal of medical genetics Part B, Neuropsychiatric genetics : the official publication of the International Society of Psychiatric Genetics 147B, 1337–1344. [DOI] [PMC free article] [PubMed] [Google Scholar]
- Neale BM, Medland S, Ripke S, Anney RJ, Asherson P, Buitelaar J, et al. (2010a). Case-control genome-wide association study of attention-deficit/hyperactivity disorder. Journal of the American Academy of Child and Adolescent Psychiatry 49, 906–920. [DOI] [PMC free article] [PubMed] [Google Scholar]
- Neale BM, Medland SE, Ripke S, Asherson P, Franke B, Lesch KP, et al. (2010b). Meta-analysis of genome-wide association studies of attention-deficit/hyperactivity disorder. Journal of the American Academy of Child and Adolescent Psychiatry 49, 884–897. [DOI] [PMC free article] [PubMed] [Google Scholar]
- Onnink AM, Zwiers MP, Hoogman M, Mostert JC, Kan CC, Buitelaar J, et al. (2014). Brain alterations in adult ADHD: Effects of gender, treatment and comorbid depression. European neuropsychopharmacology : the journal of the European College of Neuropsychopharmacology 24, 397–409. [DOI] [PubMed] [Google Scholar]
- Penela P, Nogues L, and Mayor F Jr. (2014). Role of G protein-coupled receptor kinases in cell migration. Current opinion in cell biology 27, 10–17. [DOI] [PubMed] [Google Scholar]
- Podufall J, Tian R, Knoche E, Puchkov D, Walter AM, Rosa S, et al. (2014). A presynaptic role for the cytomatrix protein GIT in synaptic vesicle recycling. Cell reports 7, 1417–1425. [DOI] [PubMed] [Google Scholar]
- Poelmans G, Pauls DL, Buitelaar JK, and Franke B (2011). Integrated genome-wide association study findings: identification of a neurodevelopmental network for attention deficit hyperactivity disorder. The American journal of psychiatry 168, 365–377. [DOI] [PubMed] [Google Scholar]
- Polanczyk G, de Lima MS, Horta BL, Biederman J, and Rohde LA (2007). The worldwide prevalence of ADHD: a systematic review and metaregression analysis. The American journal of psychiatry 164, 942–948. [DOI] [PubMed] [Google Scholar]
- Pruim RJ, Welch RP, Sanna S, Teslovich TM, Chines PS, Gliedt TP, et al. (2010). LocusZoom: regional visualization of genome-wide association scan results. Bioinformatics 26, 2336–2337. [DOI] [PMC free article] [PubMed] [Google Scholar]
- Purcell S, Cherny SS, and Sham PC (2003). Genetic Power Calculator: design of linkage and association genetic mapping studies of complex traits. Bioinformatics 19, 149–150. [DOI] [PubMed] [Google Scholar]
- Purcell S, Neale B, Todd-Brown K, Thomas L, Ferreira MA, Bender D, et al. (2007). PLINK: a tool set for whole-genome association and population-based linkage analyses. American journal of human genetics 81, 559–575. [DOI] [PMC free article] [PubMed] [Google Scholar]
- Rosato E, and Kyriacou CP (2006). Analysis of locomotor activity rhythms in Drosophila. Nature protocols 1, 559–568. [DOI] [PubMed] [Google Scholar]
- Salatino-Oliveira A, Genro JP, Chazan R, Zeni C, Schmitz M, Polanczyk G, et al. (2012). Association study of GIT1 gene with attention-deficit hyperactivity disorder in Brazilian children and adolescents. Genes, brain, and behavior 11, 864–868. [DOI] [PubMed] [Google Scholar]
- Sanchez-Mora C, Ramos-Quiroga JA, Bosch R, Corrales M, Garcia-Martinez I, Nogueira M, et al. (2014). Case-Control Genome-Wide Association Study of Persistent Attention-Deficit Hyperactivity Disorder Identifies FBXO33 as a Novel Susceptibility Gene for the Disorder. Neuropsychopharmacology : official publication of the American College of Neuropsychopharmacology. [DOI] [PMC free article] [PubMed] [Google Scholar]
- Saneyoshi T, Wayman G, Fortin D, Davare M, Hoshi N, Nozaki N, et al. (2008). Activity-dependent synaptogenesis: regulation by a CaM-kinase kinase/CaM-kinase I/betaPIX signaling complex. Neuron 57, 94–107. [DOI] [PMC free article] [PubMed] [Google Scholar]
- Schenck A, Bardoni B, Langmann C, Harden N, Mandel JL, and Giangrande A (2003). CYFIP/Sra-1 controls neuronal connectivity in Drosophila and links the Rac1 GTPase pathway to the fragile X protein. Neuron 38, 887–898. [DOI] [PubMed] [Google Scholar]
- Schindelin J, Arganda-Carreras I, Frise E, Kaynig V, Longair M, Pietzsch T, et al. (2012). Fiji: an open-source platform for biological-image analysis. Nature methods 9, 676–682. [DOI] [PMC free article] [PubMed] [Google Scholar]
- Schmalzigaug R, Rodriguiz RM, Bonner PE, Davidson CE, Wetsel WC, and Premont RT (2009). Impaired fear response in mice lacking GIT1. Neuroscience letters 458, 79–83. [DOI] [PMC free article] [PubMed] [Google Scholar]
- Schuurs-Hoeijmakers JH, Geraghty MT, Kamsteeg EJ, Ben-Salem S, de Bot ST, Nijhof B, et al. (2012). Mutations in DDHD2, encoding an intracellular phospholipase A(1), cause a recessive form of complex hereditary spastic paraplegia. American journal of human genetics 91, 1073–1081. [DOI] [PMC free article] [PubMed] [Google Scholar]
- Scorcioni R, Polavaram S, and Ascoli GA (2008). L-Measure: a web-accessible tool for the analysis, comparison and search of digital reconstructions of neuronal morphologies. Nature protocols 3, 866–876. [DOI] [PMC free article] [PubMed] [Google Scholar]
- Segura I, Essmann CL, Weinges S, and Acker-Palmer A (2007). Grb4 and GIT1 transduce ephrinB reverse signals modulating spine morphogenesis and synapse formation. Nature neuroscience 10, 301–310. [DOI] [PubMed] [Google Scholar]
- Simon V, Czobor P, Balint S, Meszaros A, and Bitter I (2009). Prevalence and correlates of adult attention-deficit hyperactivity disorder: meta-analysis. The British journal of psychiatry : the journal of mental science 194, 204–211. [DOI] [PubMed] [Google Scholar]
- Smit AS, Eling PA, and Coenen AM (2004). Mental effort causes vigilance decrease due to resource depletion. Acta psychologica 115, 35–42. [DOI] [PubMed] [Google Scholar]
- Sonuga-Barke E, Bitsakou P, and Thompson M (2010). Beyond the dual pathway model: evidence for the dissociation of timing, inhibitory, and delay-related impairments in attention-deficit/hyperactivity disorder. Journal of the American Academy of Child and Adolescent Psychiatry 49, 345–355. [DOI] [PubMed] [Google Scholar]
- Sonuga-Barke EJ, Lasky-Su J, Neale BM, Oades R, Chen W, Franke B, et al. (2008). Does parental expressed emotion moderate genetic effects in ADHD? An exploration using a genome wide association scan. American journal of medical genetics Part B, Neuropsychiatric genetics : the official publication of the International Society of Psychiatric Genetics 147B, 1359–1368. [DOI] [PubMed] [Google Scholar]
- Stergiakouli E, Hamshere M, Holmans P, Langley K, Zaharieva I, de CG, et al. (2012). Investigating the contribution of common genetic variants to the risk and pathogenesis of ADHD. The American journal of psychiatry 169, 186–194. [DOI] [PMC free article] [PubMed] [Google Scholar]
- Suh J, and Jackson FR (2007). Drosophila ebony activity is required in glia for the circadian regulation of locomotor activity. Neuron 55, 435–447. [DOI] [PMC free article] [PubMed] [Google Scholar]
- Thissen AJ, Bralten J, Rommelse NN, Arias-Vasquez A, Greven CU, Heslenfeld D, et al. (2015). The role of age in association analyses of ADHD and related neurocognitive functioning: A proof of concept for dopaminergic and serotonergic genes. American journal of medical genetics Part B, Neuropsychiatric genetics : the official publication of the International Society of Psychiatric Genetics. [DOI] [PubMed] [Google Scholar]
- van der Voet M, Harich B, Franke B, and Schenck A (2015). ADHD-associated Dopamine transporter, Latrophilin, and Neurofibromin share a dopamine-related locomotor signature in Drosophila. Molecular psychiatry in press. [DOI] [PMC free article] [PubMed] [Google Scholar]
- van der Voet M, Nijhof B, Oortveld MAW, and Schenck A (2014). Drosophila models of early onset cognitive disorders and their clinical applications. Neuroscience & Biobehavioral Reviews 46, Part 2, 326–342. [DOI] [PubMed] [Google Scholar]
- van Ewijk H, Heslenfeld DJ, Zwiers MP, Buitelaar JK, and Oosterlaan J (2012). Diffusion tensor imaging in attention deficit/hyperactivity disorder: a systematic review and meta-analysis. Neuroscience and biobehavioral reviews 36, 1093–1106. [DOI] [PubMed] [Google Scholar]
- Wearne SL, Rodriguez A, Ehlenberger DB, Rocher AB, Henderson SC, and Hof PR (2005). New techniques for imaging, digitization and analysis of three-dimensional neural morphology on multiple scales. Neuroscience 136, 661–680. [DOI] [PubMed] [Google Scholar]
- Wechsler D (1997). WAIS-III—Wechsler Adult Intelligence Scale (San Antonio: Psychological Corporation; ). [Google Scholar]
- Won H, Mah W, Kim E, Kim JW, Hahm EK, Kim MH, et al. (2011). GIT1 is associated with ADHD in humans and ADHD-like behaviors in mice. Nature medicine 17, 566–572. [DOI] [PubMed] [Google Scholar]
- Wright FA, Sullivan PF, Brooks AI, Zou F, Sun W, Xia K, et al. (2014). Heritability and genomics of gene expression in peripheral blood. Nature genetics 46, 430–437. [DOI] [PMC free article] [PubMed] [Google Scholar]
- Yang L, Neale BM, Liu L, Lee SH, Wray NR, Ji N, et al. (2013). Polygenic transmission and complex neuro developmental network for attention deficit hyperactivity disorder: genome-wide association study of both common and rare variants. American journal of medical genetics Part B, Neuropsychiatric genetics : the official publication of the International Society of Psychiatric Genetics 162B, 419–430. [DOI] [PMC free article] [PubMed] [Google Scholar]
- Za L, Albertinazzi C, Paris S, Gagliani M, Tacchetti C, and de Curtis I (2006). betaPIX controls cell motility and neurite extension by regulating the distribution of GIT1. Journal of cell science 119, 2654–2666. [DOI] [PubMed] [Google Scholar]
- Zhang H, Webb DJ, Asmussen H, and Horwitz AF (2003). Synapse formation is regulated by the signaling adaptor GIT1. The Journal of cell biology 161, 131–142. [DOI] [PMC free article] [PubMed] [Google Scholar]
- Zhang H, Webb DJ, Asmussen H, Niu S, and Horwitz AF (2005). A GIT1/PIX/Rac/PAK signaling module regulates spine morphogenesis and synapse formation through MLC. The Journal of neuroscience : the official journal of the Society for Neuroscience 25, 3379–3388. [DOI] [PMC free article] [PubMed] [Google Scholar]
- Zweier C, de Jong EK, Zweier M, Orrico A, Ousager LB, Collins AL, et al. (2009). CNTNAP2 and NRXN1 are mutated in autosomal-recessive Pitt-Hopkins-like mental retardation and determine the level of a common synaptic protein in Drosophila. American journal of human genetics 85, 655–666. [DOI] [PMC free article] [PubMed] [Google Scholar]
Associated Data
This section collects any data citations, data availability statements, or supplementary materials included in this article.