PLOS One logoLink to PLOS One
. 2020 Apr 17;15(4):e0231182. doi: 10.1371/journal.pone.0231182

Impact of law enforcement and increased traffic fines policy on road traffic fatality, injuries and offenses in Iran: Interrupted time series analysis

Milad Delavary Foroutaghe 1, Abolfazl Mohammadzadeh Moghaddam 1,*, Vahid Fakoor 2
Editor: Feng Chen3
PMCID: PMC7164613  PMID: 32302374

Abstract

Background

Road traffic law enforcement was implemented on 1st April 2011 (the first intervention) and traffic ticket fines have been increased on 1st March 2016 (the second intervention) in Iran. The aim of the current study was to evaluate the effects of the law enforcement on reduction in the incidence rate of road traffic fatality (IRRTF), the incidence rate of road traffic injuries (IRRTI) and the incidence rate of rural road traffic offenses (IRRRTO) in Iran.

Methods

Interrupted time series analysis was conducted to evaluate the impact of law enforcement and increased traffic tickets fines. Monthly data of fatality on urban, rural and local rural roads, injuries with respect to gender and traffic offenses namely speeding, illegal overtaking and tailgating were investigated separately for the period 2009–2016.

Results

Results showed a reduction in the incidence rate of total road traffic fatality (IRTRTF), the incidence rate of rural road traffic fatality (IRRRTF) and the incidence rate of urban road traffic fatality (IRURTF) by –21.44% (–39.3 to –3.59, 95% CI), –21.25% (–31.32 to –11.88, 95% CI) and –26.75% (–37.49 to –16, 95% CI) through the first intervention which resulted in 0.383, 0.255 and 0.222 decline in casualties per 100 000 population, respectively. Conversely, no reduction was found in the incidence rate of local rural road traffic fatality (IRLRRTF) and the IRRTI. Second intervention was found to only affect the IRURTF with –26.75% (–37.49 to –16, 95% CI) which led to 0.222 casualties per 100 000 population. In addition, a reduction effect was observed on the incidence rate of illegal overtaking (IRIO) and the incidence rate of speeding (IRS) with –42.8% (–57.39 to –28.22, 95% CI) and –10.54% (–21.05 to –0.03, 95% CI which implied a decrease of 415.85 and 1003.8 in monthly traffic offenses per 100 000 vehicles), respectively.

Conclusion

Time series analysis suggests a decline in IRTRTF, IRRRTF, and IRURTF caused by the first intervention. However, the second intervention found to be only effective in IRURTF, IRIO, and IRS with the implication that future initiatives should be focused on modifying the implementation of the traffic interventions.

1. Introduction

According to the World health organization (WHO) report in 2018, approximately 3400 road users were killed in traffic accidents on a daily basis in which low and middle-income countries accounted for more than 90% of road traffic fatality [1]. WHO report showed a constant rate of traffic accidents despite population growth throughout the world which proves interventions could be effective in road safety [2]. The report indicated that a 5% reduction in mean speed could lead to 30% decrease in fatal accidents. The use of helmet can reduce the risk of death and severe injury by 40% and 70%, respectively. Moreover, seat belt use reduces the risk of fatal injury by 50% for front seat occupants and by 75% for rear seat occupants [2]. An observational study in Russia on the risk factors under global road safety programme (i.e. seat belt use and speed) led to an increase in seat belt use and a reduction in speeding between October 2010 and March 2013 [3].

Based on Iranian Traffic Police records, every 58 minutes, a road user has been killed in Nowruz 2018 (from 21 March 2018 to 4 April 2018), resulting in 374 traffic casualties [4]. On the first day of April 2011, law enforcement for reducing traffic offenses was implemented. Some of the most important enforcements were related to speeding, illegal overtaking and drink–driving. In addition, since 1st March 2016, traffic ticket fines have been increased. For instance, fine regarding drink–driving has been quadrupled (i.e. from 1 million to 4 million Rials) [5].

Time series analysis can be utilized as a macro study to investigate the policy [6,7,8,9,10,11]. While, temporal and spatio-temporal multivariate random-parameters Tobit models are some of the methods that can be used in the micro level [12,13]. Interrupted time series analysis has been used in various fields bu using autoregressive integrated moving average(ARIMA) methodology which was intoduced by Box–Jenkins in 1976 [14]. For instance, Hansen et al. [15] examined the effect of daylight savings time transition on the incidence rate of unipolar depressive episodes. Hansen et al. [16] studied the effects of Breivik attacks, whose murders accounted for 77 adults and children in Norway, on the rate of trauma- and stressor-related disorders in Denmark. Brals et al. [17] utilized a controlled interrupted time-series to examine the impact of the health insurance and health facility-upgrades on hospital deliveries in rural Nigeria between 1 May 2005 to 30 April 2013.

In addition, Olsen et al. [18] studied the impact of new urban motorway extension on the number of road traffic accidents (RTAs) on local non–motorway roads of Scotland between 1997–2014. Results showed that reduction in RTAs was not associated with the motorway extension. Steinbach et al. [19] found not much evidence of the detrimental effects of dimming, part–night lighting, switch off or changes to white light/LEDs on road accidents/crime in England and Wales. A study by Morrison et al. [20] in the United States revealed that using Uber as an intervention had a reduction effect on alcohol–related accidents in Portland and San Antonio cities. Sebego et al. [21] indicated that the decline in accidents occurred when educational policies were implemented to reduce alcohol consumption and improve road safety.

Time series analysis, also, has been conducted to evaluate the traffic intervention on fatality and injuries caused by road accidents. For example, Lim and Chi [22] focused on the impact of mobile phone ban in the U.S on reducing fatal crashes involving young drivers aged 14–20. The finding indicated that the ban was only effective in reducing fatal crashes. Lovenheim and Steefel [23] studied the effect of state-level Sunday alcohol sales restrictions on fatal accidents using American time use survey data. The group whose drink driving behaviour was most affected by the laws was underage men and, also, no effect of blue laws on the location of consumption was observed. A study regarding U.S. Child Safety Seat Laws (which have steadily increased mandatory child safety seat restraint were assessed in the United States over the past 35 years) found that the laws saved up to 39 children per year [24]. Lee et al. [25] investigated associations of marijuana law changes and marijuana-involved fatal crashes in the United States in 2018. They noticed no significant changes in the number of marijuana-related crashes after medical legalisation only. Nevertheless, an increased number of marijuana-related crashes were found after the marijuana law changed. The impact of rising gasoline prices which increased new motorcycle sales on fatalities was estimated with ARIMA regression in the United States between 1984–2009. This study introduced evidence that gasoline prices could act as the increasing incentives to purchase motorcycles, leading to a rise in fatalities from motorcycle crashes [26]. Botswana evaluated the effects of traffic policies and alcohol consumption reduction on the decreased incidence rate of traffic fatality and injuries between 2004–2011. Beatriz et al. [27] studied the effect of legal blood alcohol concentration (BAC) reduction in traffic-related fatality and morbidity between January 2003 and December 2014 in Chile and found that alcohol-related injuries were reduced. Furthermore, deregulation policies of the driving licence application process which was proved to facilitate obtaining the licence in Korea had a statistically significant association with the increase in incidence rate of death, injuries, and collisions [28]. Grundy et al. [29] investigated the role of 20 mph traffic speed zones in road traffic injuries between in London, 1986–2006. Results revealed that slower motor vehicle speed records were more successful in reducing the severity of injury rather than frequency of collisions. Traffic interventions can have different outcomes with respect to samples. For instance, Otero et al. [30] evaluated the effect of BAC reduction and increase in driver's licence suspension for traffic offenders on traffic fatality and injuries in Chile, 2009–2014. They found significant reduction in injuries only; thus, unlike prior study, frequency of collisions and injuries has been decreased. Chen et al. [31] used random parameters bivariate ordered probit model to assess potential factors impact the level of injury sustained by two drivers involved in the same rear-end crash between passenger cars. The results showed that driver age, gender, vehicle, airbag /seat belt use and traffic flow were found to impact injury severity for both drivers. Chen et al. [32] studied accident data involving trucks on rural highway to evaluate the difference in driver-injury severity between single- and multi-vehicle accidents by using mixed logit models. It is found that the snow road surface and light traffic indicators will be better modelled as random parameters in SV and MVmodels, respectively.

Previous studies have mainly examined the impact of some interventions, such as seat belt use and alcohol and recreational drugs on road traffic fatality and injuries. Evidence on the impact of law enforcement packages and increasing traffic tickets fines on road traffic fatality, injuries and especially traffic offenses calls for further research. Moreover, most of these studies have been conducted in the developed countries and very few studies have been undertaken in the developing countries. The aim of the current study is to evaluate the impacts of law enforcement and increased traffic tickets fine programmes on fatality in urban, rural and local rural road networks, on injuries by gender in Iran. In addition, the effect of increased traffic fines on traffic offenses including speeding, illegal overtaking and tailgating investigated in rural areas. To do so, interventional variables such as level shift, delay level shift, additive and temporary change were considered in the time series modelling. In addition, in order to reach the aim of 10 000 casualties by the year 2027, traffic interventions on rural, urban and local rural roads were simulated based on interrupted time series analysis.

2. Methods

2.1 Data collection

Due to having accessibility to sufficient monthly data for road traffic fatality and injuries for time period March 2009 to February 2016, a time series analysis could have been conducted on data obtained from Iranian Legal Medicine Organization (ILMO). Figs 1 and 2 show time series for IRRTF and IRRTI, respectively. ILMO classifies the fatality based on urban, rural and local rural roads. It also classifies injuries based on gender; however, due to the study limitations, deaths by gender and location of injuries have not been considered for the modelling. In this study, 1st of April 2011 and 1st of March 2016 representing law enforcement and increased traffic ticket fines, respectively, were considered as interventional points. In Iran, traffic fatality is attributed to those who are killed at the scene or maximally within 30 days after the accident [33].

Fig 1.

Fig 1

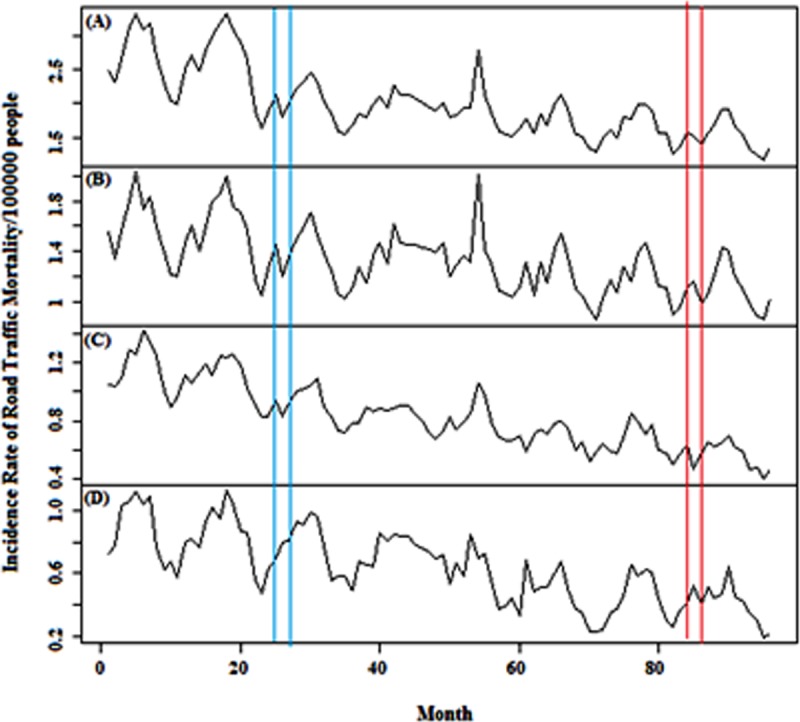
Monthly incidence rate of traffic fatality for (A) total, (B) rural, (C) urban and (D) local rural roads in Iran, 2009–2016. Blue and Red vertical lines indicate law enforcement on road traffic on 1 April 2011 and 1 April 2016, respectively.

Fig 2.

Fig 2

Monthly incidence rate of (A) total, (B) male- and (C) female-specific road traffic injuries in Iran, 2009–2016. Blue and Red vertical lines indicate law enforcement on road traffic on 1 April 2011 and 1 April 2016, respectively (this data partly were used by [34]).

Each of the points in the time series of IRRTF and IRRTI was calculated per 100 000 population per month. Population per month was obtained through sum total of prior month population and rate of death and birth. National Organization for Civil Registration of Iran publishes data on births and deaths monthly [35].

In addition, in order to investigate the effect of law enforcement on IRRRTO, traffic offenses data during March 2010 to February 2016 were obtained from Iran Road Maintenance and Transportation Organization (Fig 3) [36]. Data contained illegal overtaking, speeding and tailgating. Due to unavailability of 2009 and 2010 data, only the second intervention was investigated. Every month, these data are published on Excel spreadsheets for all of the camera zones in the rural roads of Iran. In order to acquire the aforementioned traffic parameters, 3 334 000 points were utilized. Moreover, 13 336 000 points were considered for all of them. It should be noted that traffic offense data was provided per 100 000 vehicles per month.

Fig 3.

Fig 3

Monthly incidence rate of (A) tailgating, (B) illegal overtaking and (C) speeding offenses in rural roads in Iran, 2010–2016. A Red vertical line indicates law enforcement on road traffic on 1 April 2016.

2.2 Statistical analysis

In this study, time series which is a special case of panel data were used to model the traffic intervention with statistical tools. In this regard, panel data which are multi-dimensional data involving measurements over time were used as a methodology in a variety of application in traffic safety. For instance, Chen et al. [37] and Chen et al. [38] employed unbalanced panel data to investigate hourly crash frequency on highway segments.

Traffic law enforcement is the example of an intervention which can affect response variables such as a number of casualties or injuries. In 1975, Box and Tiao suggested a method for estimating the effect of interventions in the dynamic regression framework [39]. The interventional analysis is useful when the exact effect of interventions is of interest or the aim of the analysis is to predict the time series by applying the effect of the intervention. In this study, some of the interventional variables like level shift, delay level shift, additive and temporary change are considered in models [40]. Eventually, level shift model with Eq (1) became statistically significant.

Yt=a+ωXt+Nt (1)

Where Yt, Xt, and Nt representing response variable, level shift interventional variable, and a SARIMA model, respectively. If it is assumed that an intervention occurs in ‘u’ time, a dummy variable can be applied which was equal to 0 before the intervention and become 1 after that [40].

In SARIMA modelling data must be stationary in the mean. In case of non-stationary means, a seasonal difference with a lag of ‘s’ and in case of further requirement, trend difference with a lag of 1 can be employed [41]. As for the monthly data collection in the current study, season considered at lag 12. Stationarity was confirmed with the help of time series plot and Dickey–Fuller (DF) test. This test is one of the unit root tests to check the stationarity of the mean [42,43].

Eventually, for accepting SARIMA model, residuals must follow the white noise. White noise is a discrete signal whose samples are regarded as a sequence of serially uncorrelated random variables with zero mean. Autocorrelation and partial autocorrelation function plots and Ljung–Box test were conducted for discriminating uncorrelated residuals [44]. Furthermore, residual plots were used to determine zero mean [41] and other optional assumptions including the normality of residuals were evaluated with the Kolmogorov-Smirnov (KS) test.

Ethical approval

It is not required because this study used a nationally aggregated data derived from the website of Legal Medicine Organization of Iran and the website of National Organization for Civil Registration.

3. Results

IRRTF time series of rural, urban and local rural roads and also IRRTI with respect to the gender are shown in Figs 1 and 2, respectively in which blue lines represent first intervention and red lines represent second intervention.

Annual values of IRTRTF between March 2005 to February 2016 have declined from 40.32 to 18.24. This reduction is evident in all types of roads which indicates the positive impact of interventional policies on road safety in Iran. According to the Iranian Traffic Police reports, most of the rural roads’ casualties are caused by hazardous moving violations such as speeding and illegal overtaking which their reduction is visible in Fig 3 after March 2016 [4].

The incidence rate of total road traffic injuries (IRTRTI) increased from 398.37 to 426.88 during the years 2005–2016 while the incidence rate of male road traffic injuries (IRMRTI) decreased during the years 2009–2010 and held constant till 2016. Observed IRMRTI values are higher than female (IRFRTI) ones; this has occurred because men use different modes of transport more than women due to their busier life outside the home. The upward trend of IRFRTI during the years 2009–2012 has been balanced due to the law enforcement occurrence since 2013.

Four modes of variables of the interventional time series analysis including level shift, delay level shift, additive and temporary change were evaluated and except for level shift variable, other variables were not described in this study due to their statistically insignificant outcomes. Furthermore, because of uncertainty in the accurate time of dummy variable (i.e. time of enforcing laws) in the model, a time period consisting of three points was used and after evaluating the results of coefficients of the dummy variable, 1st April 2011 and 1st March 2016 were considered for the accurate times of the interventions.

SARIMA models were administered for evaluating the impact of the first and the second interventions on IRRTF, IRRTI and IRRRTO time series. The first intervention had a remarkable reduction effect on IRTRTF, IRRRTF and IRURTF with –21.44% (–39.3 to –3.59, 95% CI), –21.25% (–31.32 to –11.88, 95% CI) and –26.75% (–37.49 to –16, 95% CI) which caused fatality rates reduced by 0.3838, 0.255 and 0.222 casualties per 100 000 population, respectively. IRLRRTF with additive parameter (i.e. 0.1275) experienced a 15.94% increase (–7.31 to 39.19, 95% CI) in the first intervention while the IRURTF evidenced a 26.75% reduction (–37.49 to –16, 95% CI) because of the second intervention (Table 1).

Table 1. The effects of the law enforcement on road traffic fatality, SARIMA models.

Output Monthly average Estimate SE Z P–value Change LBc KSd
Percent Level 95%CI
(a)Total 1593
Impact(I1a) –0.384 0.16 –2.401 0.016 –21.44 [–39.3, –3.59]
Noise (0,1,3)(1,1,0) 0.75 0.331
Impact(I1) –0.381 0.163 –2.341 0.019 –21.29 [–39.48, –3.1]
Impact(I2b) –0.096 0.174 –0.555 0.579 –6.38 [–29.39, 16.62]
Noise (0,1,3)(0,1,1) 0.74 0.35
(b) Rural 1007
Impact(I1) –0.255 0.060 –4.223 2.412e–05 –21.25 [–31.32, –11.18]
Noise (0,0,2)(1,1,1) 0.41 0.14
Impact(I1) –0.247 0.056 –4.396 1.101e–05 –20.54 [–29.89, –11.19]
Impact(I2) –0.114 0.06 –1.903 0.057 –9.83 [–20.16, 0.5]
Noise (0,0,2)(1,1,1) 0.38 0.14
(c) Urban 452
Impact(I1) –0.256 0.073 –3.533 0.0004 –30.89 [–48.39, –13.4]
Noise (1,0,0)(0,1,1) 0.43 0.02
Impact(I1) –0.222 0.045 –4.972 6.642e–07 –26.75 [–37.49, –16]
Impact(I2) –0.106 0.048 –2.210 0.027 –22.58 [–43, –2.15]
Noise (1,0,0)(1,1,0) 0.62 0.02
(d) Local rural 134
Impact(I1) 0.128 0.093 1.371 0.170 15.94 [–7.31, 39.19]
Noise (1,1,0)(1,0,1) 0.41 0.08
Impact(I2) –0.072 0.093 –0.778 0.436 –13.87 [–49.52, 21.79]
Noise (2,0,0)(0,1,1) 0.44 0.12

aIntervention1: 1 April 2011

bIntervention2: 1 March 2016

cLjung–Box

dKolmogorov–Smirnov

From the Table 2, the impact of the first and the second interventions on IRRTI time series reduction is evident. IRTRTI for the first and the second interventions were estimated around –7.16% (–16.82 to 2.51, 95% CI) and 6.09% (–3.28 to 15.46, 95% CI). The values in the first and the second interventions were –7.88% (–15.84 to 0.08, 95% CI) and 8.07% (–0.24 to 16.39%, 95% CI) and also, –7.49% (–21.92 to 6.95, 95% CI) and 7.38% (–4.32 to 19.07, 95% CI) for men and women, respectively.

Table 2. The effects of the law enforcement on road traffic injuries, SARIMA models.

Output Monthly average Estimate SE Z P–value Change LBc KSd
Percent Level 95%CI
(a)Total 26037
Impact(I1a) –2.253 1.521 –1.481 0.139 –7.16 [–16.82, 2.51]
Noise (0,1,1)(0,1,1) 0.43 0.8
Impact(I2b) 2.141 1.647 1.300 0.194 6.09 [–3.28, 15.46]
Noise (0,1,1)(0,1,1) 0.43 0.76
(b) Male 18827
Impact(I1) –3.245 1.642 –1.976 0.048 –7.13 [–14.35, 0.09]
Noise (2,0,0)(0,1,1) 0.10 0.76
Impact(I1) –3.585 1.811 –1.98 0.048 –7.88 [–15.84, 0.08]
Impact(I2) 3.778 1.946 1.942 0.052 8.07 [–0.24, 16.39]
Noise (2,0,0)(1,1,0) 0.11 0.87
(c) Female 7210
Impact(I1) –1.289 1.242 –1.038 0.3 –7.49 [–21.92, 6.95]
Noise (1,1,1)(0,0,1) 0.15 0.93
Impact(I2) 1.707 1.353 1.2614 0.207 7.38 [–4.32, 19.07]
Noise (1,1,1)(0,0,1) 0.21 0.87

aIntervention1: 1 April 2011

bIntervention2: 1 March 2016

cLjung–Box

dKolmogorov–Smirnov

IRRRTO time series including tailgating, illegal overtaking and speeding are illustrated in Fig 3. Table 3 shows SARIMA analysis for evaluating the effect of the increased traffic ticket fines on IRRRTO time series. The second intervention led to the reduction in IRIO and IRS by 415.85 and 1003.8 per 100 000 vehicles per month, respectively which is equal to the reduction effect of –42.8% (–57.39 to –28.22, 95% CI) and –10.54% (–21.05 to –0.03, 95% CI). Finally, the reduction in the incidence rate of tailgating (IRT) was –2.57% (–10.26 to 5.12, 95% CI).

Table 3. The effects of the law enforcement on road traffic offenses, SARIMA models.

Output Monthly average Estimate SE Z P–value Change LBc KSd
Percent Level 95%CI
(a) Tailgating 15870
Impact(I2a) –469.797 703.728 –0.668 0.504 –2.57 [–10.26, 5.12]
Noise (1,1,0)(1,1,1) 0.59 0.87
(b) Illegal Overtaking 973
Impact(I2) –415.85 70.859 –5.869 4.393e–09 –42.8 [–57.39, –28.22]
Noise (1,0,0)(1,0,0) 0.86 0.96
(c) Speeding 10311
Impact(I2) –1.004e+03 5.004e+02 –2.006 0.044 –10.54 [–21.05, –0.03]
Noise (1,0,0)(0,0,1) 0.68 0.99

aIntervention1: 1 April 2011

bIntervention2: 1 March 2016

cLjung–Box

dKolmogorov–Smirnov

Uncorrelated residuals were accepted employing LB test for all of the time series at the 5% significance level (Table 3). Zero mean of the residuals was observed form residual plots to confirm the white noise. Moreover, KS test confirmed the normality of residuals as an optional assumption for all of the time series except IRURTF.

The road safety plan of Safety Commission of the Ministry of Roads and Urban Development in Iran proposed three scenarios in which annual road traffic fatality is expected to reach 12 000, 10 000 and 8 000 causalities until 2027 [45]. Considering the current situation, in order to reach this milestone, interventions should be considered. In this study, simulation for interventions in 1st March 2019, 1st March 2022 and 1st March 2025 was considered with the level shift effects of 0.15, 0.15 and 0.1 for IRRRTF, IRURTF and IRLRRTF, respectively. The reason behind choosing these values was the results of the analysis of traffic safety interventions in this study. Selection of 1st March was for the implementation of the intervention and three years interval for each of interventions was chosen in order to reach at least one of the mentioned scenarios until 2027 and also because of obtained experiences in the current study.

Eventually, results of this simulation are shown in Table 4 representing the monthly incidence rate of road traffic fatality in urban, rural and local rural roads. IRRRTF, IRURTF, and IRLRRTF annual values will reach 7,809, 966 and 389, respectively till 2027. Therefore, in case of applying the three aforementioned interventions, total fatality would be 9,146 road users and shows that the first two scenarios will be approachable.

Table 4. Predicted monthly incidence rate of road traffic fatality for 2027.

Road Month Rural Urban Local rural Total
March 665 38 34 737
April 506 53 24 583
May 664 127 40 831
June 756 154 49 959
July 877 158 55 1090
August 955 162 64 1181
September 800 138 53 991
October 669 81 32 782
November 561 11 16 588
December 422 1 8 431
January 398 15 5 418
February 536 28 9 573
Total 7809 966 389 9164

4. Discussion and conclusion

Law enforcement on 1st April 2011 and increased traffic ticket fines on 1st March 2016 have been implemented as interventions to reduce the incidence rate of road traffic fatality and injuries in Iran. The aim of the study was to examine the effects of these interventions on road traffic fatality, injuries, and offenses. In addition, in order to reach 10 000 casualties by the year 2027 according to the plan of Iranian committee on road safety, a simulation was conducted based on the interrupted time series analysis with level shift interventions on urban, rural and local rural roads [45]. Traffic interventions were found to be effective in decreasing traffic accidents. The results of interrupted time series analysis revealed a reduction of total road traffic fatality in Iran, especially on urban and rural roads. Urban roads witnessed the highest reduction. Quite the opposite, no reduction effect was observed on the local rural roads.

In the first interventional analysis, despite having no significant reduction in total injuries, a higher reduction effect has been observed in injured men probably because they have higher exposure to traffic laws as they use motor vehicles more often and have a higher outdoor activity than women. Regarding the failure of the intervention to reduce injuries, one can assume that safety policies have been effective only on the severity of injury and therefore it only reduced the associated fatality.

The second intervention was found effective in IRURTF. On rural roads, however, no obvious reduction was observed probably due to the ineffectiveness of the intervention on some of the traffic offenses like tailgating. In addition, this intervention did not influence the injuries. The results confirmed the higher impact of the first intervention. The second intervention could have been more effective if social or educational advertisements had been used instead.

Based on the interrupted time series simulation, in case of applying level shift intervention with 0.15, 0.15 and 0.1 for rural, urban and local rural roads on 1st March 2019, 1st March 2022 and 1st March 2025, respectively the aim of having no more than 10 000 deaths until the year 2027 would be approachable.

This study was unable to account for definite effects of the interventions on the frequency of collisions due to lack of accessibility to the number of collisions resulting in death or injury. ILMO does not publish deaths based on gender, and injuries based on the road type. Therefore, it is worthwhile to inspect the effect of interventions on fatality and injuries with respect to gender and road type in the future studies. Moreover, RMTO has provided rural road traffic offenses data since 2010 and thus it was unfeasible to study the effect of the first intervention on these data.

In conclusion, as previous studies did not evaluate the effects of implementation of traffic safety interventions in Iran, this study highlights the effects of law enforcement and increased traffic fines on traffic fatality, injuries, and offenses. Law enforcement was only successful in reducing fatality while there was no obvious change in the total number of injuries. Furthermore, increased traffic fines as another intervention was also unable to achieve its target of reducing associated deaths and injuries and this happened probably due to the improper implementation of this policy to reduce hazardous moving violations.

Supporting information

S1 File. Total aggregated data–mortalities.

(RAR)

S2 File. Total aggregated data–injuries.

(RAR)

S3 File. Total aggregated data–traffic offenses.

(RAR)

Data Availability

All relevant data are within the paper and its Supporting Information files.

Funding Statement

Milad Delavary Foroutaghe, Abolfazl Mohammadzadeh Moghaddam. This work was supported by Ferdowsi University of Mashhad [grant number: 3/45430]. Ferdowsi University of Mashhad -http://um.ac.ir/. This work was supported about 250$ by Ferdowsi University of Mashhad for data collection and specific study [grant number: 3/45430]. The funders had no role in study design, data collection and analysis, decision to publish, or preparation of the manuscript.

References

  • 1.World Health Organization(WHO), 2018. Fact Sheet [Online]. Available: http://www.who.int/mediacentre/factsheets/fs358/en/ [Accessed].
  • 2.World Health Organization(WHO), 2015. global status report on road safety.
  • 3.Slyunkina E.S., Kliavin V.E., Gritsenko E.A., Petruhin A.B., Zambon F., He H., Hyder A.A., 2013. Activities of the Bloomberg Philanthropies Global Road Safety Programme (formerly RS10) in Russia: promising results from a sub–national project. Injury 44, 64–69. [DOI] [PubMed] [Google Scholar]
  • 4.Iranian Traffic Police(ITP), 2018. Iran. Available: http://rahvar120.ir/ [Accessed].
  • 5.Ministry of Interior(MI), 2011. law enforcement on traffic offenses [Online]. Iran. Available: http://portal.upto.ir/ [Accessed].
  • 6.Gustafsson N.J., Ramstedt M.R., 2011. Changes in alcohol–related harm in Sweden after increasing alcohol import quotas and a Danish tax decrease—an interrupted time–series analysis for 2000–2007. International Journal of Epidemiology 40, 432–440. 10.1093/ije/dyq153 [DOI] [PMC free article] [PubMed] [Google Scholar]
  • 7.Herttua K., Makela P., Martikainen P., 2009. An evaluation of the impact of a large reduction in alcohol prices on alcohol–related and all–cause mortality: time series analysis of a population–based natural experiment. International Journal of Epidemiology 40, 441–454. 10.1093/ije/dyp336 [DOI] [PMC free article] [PubMed] [Google Scholar]
  • 8.Pun V.C., Lin H., Kim J.H., et al. , 2013. Impacts of alcohol duty reductions on cardiovascular mortality among elderly Chinese: a 10–year time series analysis. Journal of Epidemiology and Community Health 67, 514–8. 10.1136/jech-2012-201859 [DOI] [PubMed] [Google Scholar]
  • 9.Kisely S., Lawrence D., 2016. A time series analysis of alcohol–related presentations to emergency departments in Queensland following the increase in alcopops tax. journal of Epidemiology and Community Health 70, 181–186. 10.1136/jech-2015-205666 [DOI] [PubMed] [Google Scholar]
  • 10.Sanchez A.I., Villaveces A., Krafty R.T., Park T., Weiss H.B., Fabio A., Puyana J.C., et al. , 2011. Policies for alcohol restriction and their association with interpersonal violence: a time–series analysis of homicides in Cali, Colombia. International Journal of Epidemiology 40, 1037–1046. 10.1093/ije/dyr051 [DOI] [PMC free article] [PubMed] [Google Scholar]
  • 11.Herttua K., Makela P., Martikainen P., 2015. Minimum Prices for Alcohol and Educational Disparities in Alcohol–related mortality. Epidemiology 26, 337–343. 10.1097/EDE.0000000000000260 [DOI] [PubMed] [Google Scholar]
  • 12.Zeng Q., Wen H., Huang H., Pei X., Wong S. C., 2017. Incorporating temporal correlation into a multivariate random parameters Tobit model for modelling crash rate by injury severity, Transportmetrica A: Transport Science, 14(3), 177–191. [Google Scholar]
  • 13.Zeng Q., Guo Q., Wong S. C., Wen H., Huang H., Pei X. 2019, Jointly modelling area–level crash rates by severity: A Bayesian multivariate randomparameters spatio–temporal Tobit regression, Transportmetrica A: Transport Science, 15(2), 1867–1884. [Google Scholar]
  • 14.Xiao Z., Guo M., 2009. Time series analysis and application with SAS Wuhan University Press, 145–67. [Google Scholar]
  • 15.Hansen B.T., Dinesen P.T., Østergaard. S.D., 2017a. Increased Incidence Rate of Trauma–and Stressor–related Disorders in Denmark After the Breivik Attacks in Norway. Epidemiology 28, 906–909. [DOI] [PubMed] [Google Scholar]
  • 16.Hansen B.T., SØnderskov K.M., Hageman I., Dinesen P.T., Østergaard. S.D., 2017b. Daylight Savings Time Transitions and the Incidence Rate of Unipolar Depressive Episodes. Epidemiology, 28, 346–53. [DOI] [PubMed] [Google Scholar]
  • 17.Brals D., Aderibigbe S.A., Wit F.W., et al. , 2017. The effect of health insurance and health facility–upgrades on hospital deliveries in rural Nigeria: a controlled interrupted time–series study. Health Policy and Planning 32, 990–1001. 10.1093/heapol/czx034 [DOI] [PMC free article] [PubMed] [Google Scholar]
  • 18.Olsen J.R., Mitchell R., Mackay D.F., Humphreys D.K., Ogilvie D., 2016. Effects of new urban motorway infrastructure on road traffic accidents in the local area: a retrospective longitudinal study in Scotland. Journal of Epidemiology and Community Health 70, 1088–1095. 10.1136/jech-2016-207378 [DOI] [PMC free article] [PubMed] [Google Scholar]
  • 19.Steinbach R., Perkins C.H., Tompson L., Johnson S.H., Armstrong B., Green J., Grundy C.H., et al. , 2015. The effect of reduced street lighting on road casualties and crime in England and Wales: controlled interrupted time series analysis. journal of Epidemiology and Community Health, 69. [DOI] [PMC free article] [PubMed] [Google Scholar]
  • 20.Morrison Ch., Jacoby S.F., Dong B., Delgado M.K., Wiebe D.J., 2017. Ridesharing and Motor Vehicle Crashes in Four U.S. Cities: An Interrupted Time Series Analysis. American Joournal of Epidemiology 187(2), 224–232. [DOI] [PMC free article] [PubMed] [Google Scholar]
  • 21.Sebego M., Naumann R.B., Rudd R.A., Voetsch K., Dellinger A.M., Ndlovu Ch., 2014. The impact of alcohol and road traffic policies on crash rates in Botswana, 2004–2011: A time–series analysis. Accident Analysis and Prevention 70, 33–39. 10.1016/j.aap.2014.02.017 [DOI] [PMC free article] [PubMed] [Google Scholar]
  • 22.Lim S.L., Chi J., 2013. Are cell phone laws in the U.S. effective in reducing fatal crashes involving young drivers? Transport Policy 27, 158–163. [Google Scholar]
  • 23.Lovenheim M.F., Steefel D.P., 2011. Do Blue Laws Save Lives? The Effect of Sunday Alcohol Sales Bans on Fatal Vehicle Accidents. Journal of Policy Analysis and Management 30, 798–820. [Google Scholar]
  • 24.Jones L.E., Ziebarth N.R., 2017. U.S. Child Safety Seat Laws: Are they Effective, and Who Complies? Journal of Policy Analysis and Management 36, 584–607. 10.1002/pam.22004 [DOI] [PubMed] [Google Scholar]
  • 25.Lee J., Abdel–aty A., Park J., 2018. Investigation of associations between marijuana law changes and marijuana–involved fatal traffic crashes: A state–level analysis. Journal of Transport & Health 10, 194–202. [Google Scholar]
  • 26.Zhu H., Wilson F., Stimpson J., Hilsenrath P., 2015. A96 Rising gasoline prices increase new motorcycle sales and fatalities in the United States. Journal of Transport & Health 2, S5–S63. [DOI] [PMC free article] [PubMed] [Google Scholar]
  • 27.Beatriz N.N., 2017. Segmented regression analysis of interrupted time series data to assess outcomes of a South American road traffic alcohol policy change. public health 150, 51–59. 10.1016/j.puhe.2017.04.025 [DOI] [PubMed] [Google Scholar]
  • 28.Oh J., Jun Eun S., Kim H.S., 2016. Effects of deregulation of the driving licence application process on road safety in Korea: an interrupted time–series analysis. Journal of Epidemiology and Community Health 70, 1178–1183. 10.1136/jech-2015-207000 [DOI] [PubMed] [Google Scholar]
  • 29.Grundy CH., Steinbach R., Green J., Armstrong B., Wilkinson P., 2015. Effect of 20 mph traffic speed zones on road injuries in London, 1986–2006: controlled interrupted time series analysis. BMJ Journal. [DOI] [PMC free article] [PubMed] [Google Scholar]
  • 30.Otero S., Rau T., 2017. The effects of drinking and driving laws on car crashes, injuries, and deaths: Evidence from Chile. Accident Analysis and Prevention 106, 262–274. 10.1016/j.aap.2017.05.031 [DOI] [PubMed] [Google Scholar]
  • 31.Chen F., Song M., Ma X., 2019. Injury severity of drivers in rear–end collisions between cars using a random parameters bivariate ordered probit model. International Journal of Environmental Research and Public Health 16(14), 2632. [DOI] [PMC free article] [PubMed] [Google Scholar]
  • 32.Chen F., Suren Ch., 2011. Injury severities of truck drivers in single–and multi–vehicle accidents on rural highways. Accident Analysis and Prevention 43, 1677–1688. 10.1016/j.aap.2011.03.026 [DOI] [PubMed] [Google Scholar]
  • 33.Iranian Legal Medicine Organization(LMO), 2018. Iran. Available: http://www.lmo.ir/ [Accessed].
  • 34.Delavary Foroutaghe M., Mohammadzadeh Moghaddam A., Fakoor V., 2019. Time trends in gender-specific incidence rates of road traffic injuries in Iran. PLoS ONE 14(5). [DOI] [PMC free article] [PubMed] [Google Scholar]
  • 35.National Organization for Civil Registration(NOCR), 2017. Iran. Available: https://www.sabteahval.ir/en [Accessed].
  • 36.Road Maintanance and Transportation Organization(RMTO), 2018. Ministery of Roads and Urban development [Online]. iran. Available: http://www.rmto.ir/en/SitePages/Road%20Maintenance%20And%20Transportation%20Organization.aspx [Accessed].
  • 37.Chen F., Suren Ch., Ma X., 2016. Crash frequency modelling using real–time environment and traffic data and unbalanced panel data models. International Journal of Environmental Research and Public Health 13, 609. [DOI] [PMC free article] [PubMed] [Google Scholar]
  • 38.Chen F., Suren Ch., Ma X., 2018. Analysis of hourly crash likelihood using unbalanced panel data mixed logit model and real–time driving environmental big data. Journal of Safety Research 65, 153–159. 10.1016/j.jsr.2018.02.010 [DOI] [PubMed] [Google Scholar]
  • 39.Box G.E.P., Tiao G.C., 1975. Intervention analysis with applications to economic and environmental problems. Journal of the American Statistical Association 70, 70–79. [Google Scholar]
  • 40.Makridakis S.G., Wheel Wright S.C., & Hydman R.J., 1998. Forecasting: Methods and Applications. [Google Scholar]
  • 41.Hyndman R.J., Athanasopoulos G., 2012. Forecasting: principle and practice, Australia. [Google Scholar]
  • 42.Dickey D.A., Fuller W.A., 1979. distribution of the estimators for autoregressive time series with a unit root. Journal of the American Statistical Association 74, 427–31. [Google Scholar]
  • 43.Dickey D.A., Bell W.R., Miller R.B., 1986. Unit roots in time series models: tests and implications. American Statistician 40, 12–26. [Google Scholar]
  • 44.Ljung G.M., Box G.E., 1978. On a measure of lack of fit in time series models. Biometrica 65, 297–303. [Google Scholar]
  • 45.Committee on Roads Safety(CRS), 2018. [Online]. Iran: Ministry of Roads and Urban Development. Available: mrud.ir/ [Accessed 2018].

Decision Letter 0

Feng Chen

24 Dec 2019

PONE-D-19-32920

Impact of law enforcement and increased traffic ticket fines policy on road traffic mortality, injuries and offenses in Iran: Interrupted time series analysis

PLOS ONE

Dear Dr. Mohammadzadeh Moghaddam,

Thank you for submitting your manuscript to PLOS ONE. After careful consideration, we feel that it has merit but does not fully meet PLOS ONE’s publication criteria as it currently stands. Therefore, we invite you to submit a revised version of the manuscript that addresses the points raised during the review process.

We would appreciate receiving your revised manuscript by Feb 07 2020 11:59PM. When you are ready to submit your revision, log on to https://www.editorialmanager.com/pone/ and select the 'Submissions Needing Revision' folder to locate your manuscript file.

If you would like to make changes to your financial disclosure, please include your updated statement in your cover letter.

To enhance the reproducibility of your results, we recommend that if applicable you deposit your laboratory protocols in protocols.io, where a protocol can be assigned its own identifier (DOI) such that it can be cited independently in the future. For instructions see: http://journals.plos.org/plosone/s/submission-guidelines#loc-laboratory-protocols

Please include the following items when submitting your revised manuscript:

  • A rebuttal letter that responds to each point raised by the academic editor and reviewer(s). This letter should be uploaded as separate file and labeled 'Response to Reviewers'.

  • A marked-up copy of your manuscript that highlights changes made to the original version. This file should be uploaded as separate file and labeled 'Revised Manuscript with Track Changes'.

  • An unmarked version of your revised paper without tracked changes. This file should be uploaded as separate file and labeled 'Manuscript'.

Please note while forming your response, if your article is accepted, you may have the opportunity to make the peer review history publicly available. The record will include editor decision letters (with reviews) and your responses to reviewer comments. If eligible, we will contact you to opt in or out.

We look forward to receiving your revised manuscript.

Kind regards,

Feng Chen

Academic Editor

PLOS ONE

Journal Requirements:

1. When submitting your revision, we need you to address these additional requirements.

Please ensure that your manuscript meets PLOS ONE's style requirements, including those for file naming. The PLOS ONE style templates can be found at

http://www.journals.plos.org/plosone/s/file?id=wjVg/PLOSOne_formatting_sample_main_body.pdf and http://www.journals.plos.org/plosone/s/file?id=ba62/PLOSOne_formatting_sample_title_authors_affiliations.pdf

2.  Please include captions for your Supporting Information files at the end of your manuscript, and update any in-text citations to match accordingly. Please see our Supporting Information guidelines for more information: http://journals.plos.org/plosone/s/supporting-information.

3. We suggest you thoroughly copyedit your manuscript for language usage, spelling, and grammar. If you do not know anyone who can help you do this, you may wish to consider employing a professional scientific editing service.  

Whilst you may use any professional scientific editing service of your choice, PLOS has partnered with both American Journal Experts (AJE) and Editage to provide discounted services to PLOS authors. Both organizations have experience helping authors meet PLOS guidelines and can provide language editing, translation, manuscript formatting, and figure formatting to ensure your manuscript meets our submission guidelines. To take advantage of our partnership with AJE, visit the AJE website (http://learn.aje.com/plos/) for a 15% discount off AJE services. To take advantage of our partnership with Editage, visit the Editage website (www.editage.com) and enter referral code PLOSEDIT for a 15% discount off Editage services.  If the PLOS editorial team finds any language issues in text that either AJE or Editage has edited, the service provider will re-edit the text for free.

Upon resubmission, please provide the following:

  • The name of the colleague or the details of the professional service that edited your manuscript

  • A copy of your manuscript showing your changes by either highlighting them or using track changes (uploaded as a *supporting information* file)

  • A clean copy of the edited manuscript (uploaded as the new *manuscript* file)

4. Your ethics statement must appear in the Methods section of your manuscript. If your ethics statement is written in any section besides the Methods, please move it to the Methods section and delete it from any other section. Please also ensure that your ethics statement is included in your manuscript, as the ethics section of your online submission will not be published alongside your manuscript.

5. Please remove citations from the abstract. Please also make sure that all submission guidelines have been followed: " ext-link-type="uri" xlink:type="simple">https://journals.plos.org/plosone/s/submission-guidelines"

6.  We note that you have indicated that data from this study are available upon request. PLOS only allows data to be available upon request if there are legal or ethical restrictions on sharing data publicly. For more information on unacceptable data access restrictions, please see http://journals.plos.org/plosone/s/data-availability#loc-unacceptable-data-access-restrictions.

In your revised cover letter, please address the following prompts:

a) If there are ethical or legal restrictions on sharing a de-identified data set, please explain them in detail (e.g., data contain potentially sensitive information, data are owned by a third-party organization, etc.) and who has imposed them (e.g., an ethics committee). Please also provide contact information for a data access committee, ethics committee, or other institutional body to which data requests may be sent.

b) If there are no restrictions, please upload the minimal anonymized data set necessary to replicate your study findings as either Supporting Information files or to a stable, public repository and provide us with the relevant URLs, DOIs, or accession numbers. For a list of acceptable repositories, please see http://journals.plos.org/plosone/s/data-availability#loc-recommended-repositories.

We will update your Data Availability statement on your behalf to reflect the information you provide.

7. We noted in your submission details that a portion of your manuscript may have been presented or published elsewhere: Very small Part of data, just injuries data, was published for forecasting, not intervention analysis, in Plose One:with the following doi:

https://doi.org/10.1371/journal.

pone.0216462

Please clarify whether this [conference proceeding or publication] was peer-reviewed and formally published. If this work was previously peer-reviewed and published, in the cover letter please provide the reason that this work does not constitute dual publication and should be included in the current manuscript.

[Note: HTML markup is below. Please do not edit.]

Reviewers' comments:

Reviewer's Responses to Questions

Comments to the Author

1. Is the manuscript technically sound, and do the data support the conclusions?

The manuscript must describe a technically sound piece of scientific research with data that supports the conclusions. Experiments must have been conducted rigorously, with appropriate controls, replication, and sample sizes. The conclusions must be drawn appropriately based on the data presented.

Reviewer #1: Partly

Reviewer #2: Partly

**********

2. Has the statistical analysis been performed appropriately and rigorously?

Reviewer #1: No

Reviewer #2: N/A

**********

3. Have the authors made all data underlying the findings in their manuscript fully available?

The PLOS Data policy requires authors to make all data underlying the findings described in their manuscript fully available without restriction, with rare exception (please refer to the Data Availability Statement in the manuscript PDF file). The data should be provided as part of the manuscript or its supporting information, or deposited to a public repository. For example, in addition to summary statistics, the data points behind means, medians and variance measures should be available. If there are restrictions on publicly sharing data—e.g. participant privacy or use of data from a third party—those must be specified.

Reviewer #1: Yes

Reviewer #2: Yes

**********

4. Is the manuscript presented in an intelligible fashion and written in standard English?

PLOS ONE does not copyedit accepted manuscripts, so the language in submitted articles must be clear, correct, and unambiguous. Any typographical or grammatical errors should be corrected at revision, so please note any specific errors here.

Reviewer #1: Yes

Reviewer #2: Yes

**********

5. Review Comments to the Author

Please use the space provided to explain your answers to the questions above. You may also include additional comments for the author, including concerns about dual publication, research ethics, or publication ethics. (Please upload your review as an attachment if it exceeds 20,000 characters)

Reviewer #1: This study conducted a time series analysis of the impacts of law enforcement and increased traffic ticket fines policy on road traffic mortality, injuries and offenses in Iran. The research topic is worth of investigation. However, several revisions may be required before its publication.

First, the Introduction section should be re-structured. For instants, some alcohol-related studies reviewed in the section are not related to road traffic safety. Thus, they should be removed from the section.

In the proposed statistical model, accommodating temporal correlations is reasonable. However, the linear model may not be appropriate. Using Tobit-based approaches for modeling crash rates may be more suitable, such as the following works:

Jointly modeling area-level crash rates by severity: A Bayesian multivariate random-parameters spatio-temporal Tobit regression. Transportmetrica A: Transport Science, 15 (2): 1867-1884.

Incorporating temporal correlation into a multivariate random parameters Tobit model for modeling crash rate by injury severity. Transportmetrica A: Transport Science, 14 (3): 177-191.

A Bayesian spatial random parameters Tobit model for analyzing crash rates on roadway segments. Accident Analysis Prevention, 100, 37-43.

As mentioned in the above papers, in addition to temporal correlations, spatial correlations can also be considered in the models.

Reviewer #2: The topic of this paper is important. The results are meaningful and useful. There are several suggestions to improve this paper.

1. “mortality” is typically replaced by “fatality” in this field.

2. What’s the tendency of the population and traffic volume in Iran in the time period?

3. Line 54-64, the information from World health organization (2015) report is too lengthy. And the reference (World Health Organization, 2015) need to be mentioned on line 54.

4. For the influence of law enforcement on injury severity, more references are needed. For example, the following ones.

[1] Investigation on the Injury Severity of Drivers in Rear-End Collisions Between Cars Using a Random Parameters Bivariate Ordered Probit Model, International Journal of Environmental Research and Public Health, 2019, 16(14) , 2632.

[2] “Injury severities of truck drivers in single- and multi-vehicle accidents on rural highway”, Accident Analysis and Prevention, 2011, 43(5), 1677-1688.

5. “Also, in order to reach the aim of 10 000 casualties by the year 2027” There need to be a reference and the nation should be mentioned.

6. For the methodology, the authors need to at least mention the panel-data models which combine time-serial and cross-section models. The following are some references.

[3] Analysis of hourly crash likelihood using unbalanced panel data mixed logit model and real-time driving environmental big data. 2018, JOURNAL OF SAFETY RESEARCH. 65: 153-159.

[4] “Investigating the Differences of Single- and Multi-vehicle Accident Probability Using Mixed Logit Model", Journal of Advanced Transportation, 2018, UNSP 2702360.

[5] “Crash Frequency Modeling Using Real-Time Environmental and Traffic Data and Unbalanced Panel Data Models”, International Journal of Environmental Research and Public Health, 2016, 13(6), 609.

**********

6. PLOS authors have the option to publish the peer review history of their article (what does this mean?). If published, this will include your full peer review and any attached files.

If you choose “no”, your identity will remain anonymous but your review may still be made public.

Do you want your identity to be public for this peer review? For information about this choice, including consent withdrawal, please see our Privacy Policy.

Reviewer #1: No

Reviewer #2: No

[NOTE: If reviewer comments were submitted as an attachment file, they will be attached to this email and accessible via the submission site. Please log into your account, locate the manuscript record, and check for the action link "View Attachments". If this link does not appear, there are no attachment files to be viewed.]

While revising your submission, please upload your figure files to the Preflight Analysis and Conversion Engine (PACE) digital diagnostic tool, https://pacev2.apexcovantage.com/. PACE helps ensure that figures meet PLOS requirements. To use PACE, you must first register as a user. Registration is free. Then, login and navigate to the UPLOAD tab, where you will find detailed instructions on how to use the tool. If you encounter any issues or have any questions when using PACE, please email us at figures@plos.org. Please note that Supporting Information files do not need this step.

PLoS One. 2020 Apr 17;15(4):e0231182. doi: 10.1371/journal.pone.0231182.r002

Author response to Decision Letter 0


2 Mar 2020

Dear Professor Feng Chen, Ph.D

Associate Editor

Plos One

OBJECT: Resubmission of manuscript PONE-D-18-20018

Re: Impact of law enforcement and increased traffic ticket fines policy on road traffic mortality, injuries and offenses in Iran: Interrupted time series analysis

Dear Editor,

We would like to thank you for attention to our manuscript. Also, we would like to thank the Associate Editor and the Reviewers for their careful reading of our manuscript and their insightful comments. In view of these, we have revised our manuscript. It is promising to realize that the reviewers have suggested a number of promoting modifications. The comments have been noted and we have tried to revise the paper accordingly. Below is a point-by-point response to each issue and concern raised by the Associate Editor and both Reviewers (original comments from reviewers appear in red color, the responses in black). It should be noted that the modifications in the manuscript are highlighted with red color tracking version of word 2013. In addition, a final version of the manuscript including all type of corrections is attached.

We hope that the revised version of the manuscript which embraces all the constructive comments kindly raised by reviewer meet your positive view.

Please do not hesitate to contact me if you think that the manuscript needs further modifications or clarifications.

Yours sincerely,

Abolfazl Mohammadzadeh Moghaddam

Tel:

Office: 0985138805026

Mobile: 0989158969602

E-mail: ab-moghadam@um.ac.ir/Mohammadzadeh.abolfazl@gmail.com

Associate Editor:

We would like to thank you for your comments. Below please see our answers in which we have revised our manuscript.

Associate Editor’s Comments to the Author

Point-by-point responses to the issues raised by the Associate Editor:

1- When submitting your revision, we need you to address these additional requirements.

Please ensure that your manuscript meets PLOS ONE's style requirements, including those for file naming. The PLOS ONE style templates can be found at

http://www.journals.plos.org/plosone/s/file?id=wjVg/PLOSOne_formatting_sample_main_body.pdf and http://www.journals.plos.org/plosone/s/file?id=ba62/PLOSOne_formatting_sample_title_authors_affiliations.pdf

ANSWER: As you truly said, according to affiliation formatting guidelines, numbers was used instead of letters in lines 4-13. In addition, the contact of corresponding author is in line 14.

2- Please include captions for your Supporting Information files at the end of your manuscript, and update any in-text citations to match accordingly. Please see our Supporting Information guidelines for more information: http://journals.plos.org/plosone/s/supporting-information.

ANSWER: Supporting information were added in lines 406-410 with the revised names. This information is S1 file, S2 file and S3 file with the names of Total aggregated data-Mortalities, injuries and traffic offenses respectively. It should be mentioned that these files are in ZIP version.

3- We suggest you thoroughly copyedit your manuscript for language usage, spelling, and grammar. If you do not know anyone who can help you do this, you may wish to consider employing a professional scientific editing service.

ANSWER: Thanks for your suggestion. Although the reviewers said there is no problems with the language, spelling ang grammar of paper, the authors themselves and with the help of a proofreader reviewed the paper again and correct some mistakes.

4- Your ethics statement must appear in the Methods section of your manuscript. If your ethics statement is written in any section besides the Methods, please move it to the Methods section and delete it from any other section. Please also ensure that your ethics statement is included in your manuscript, as the ethics section of your online submission will not be published alongside your manuscript.

ANSWER: Thank you for your comment. The authors statement including funding, ethical approval and etc. were moved bellow method section. But, as authors said in the ethic statement, this is not required because this study used a nationally aggregated data derived from the website of Legal Medicine Organization of Iran and the website of National Organization for Civil Registration.

5- Please remove citations from the abstract. Please also make sure that all submission guidelines have been followed: https://journals.plos.org/plosone/s/submission-guidelines"

ANSWER: The footnotes for law enforcement and increasing of traffic ticket fines were removed and instead of that, we used these footnotes in the context in line 29-30.

6- We note that you have indicated that data from this study are available upon request. PLOS only allows data to be available upon request if there are legal or ethical restrictions on sharing data publicly. For more information on unacceptable data access restrictions, please see http://journals.plos.org/plosone/s/data-availability#loc-unacceptable-data-access-restrictions.

In your revised cover letter, please address the following prompts:

a) If there are ethical or legal restrictions on sharing a de-identified data set, please explain them in detail (e.g., data contain potentially sensitive information, data are owned by a third-party organization, etc.) and who has imposed them (e.g., an ethics committee). Please also provide contact information for a data access committee, ethics committee, or other institutional body to which data requests may be sent.

b) If there are no restrictions, please upload the minimal anonymized data set necessary to replicate your study findings as either Supporting Information files or to a stable, public repository and provide us with the relevant URLs, DOIs, or accession numbers. For a list of acceptable repositories, please see http://journals.plos.org/plosone/s/data-availability#loc-recommended-repositories.

We will update your Data Availability statement on your behalf to reflect the information you provide.

ANSWER: As the authors said in ethic statement, nationally aggregated data derived from the website of Legal Medicine Organization of Iran and the website of National Organization for Civil Registration. However, aggregated and final data were uploaded and supporting information section was added in line 406-410. S1 file, S2 file and S3 file as data were displayed in this section.

7- We noted in your submission details that a portion of your manuscript may have been presented or published elsewhere: Very small Part of data, just injuries data, was published for forecasting, not intervention analysis, in Plose One:with the following doi:

https://doi.org/10.1371/journal.

pone.0216462

Please clarify whether this [conference proceeding or publication] was peer-reviewed and formally published. If this work was previously peer-reviewed and published, in the cover letter please provide the reason that this work does not constitute dual publication and should be included in the current manuscript.

ANSWER: Thanks for your comment and concern about avoiding dual publication. As you said, the paper was formally published with peer-review. However, data used in current paper include time series of mortality, injury and traffic offenses in Iran. In our previous paper with the following doi:https://doi.org/10.1371/journal.pone.0216462, authors used just injury data for forecasting time series with SARIMA models. However, in this study, we used dynamic regression for evaluating, not forecasting, the impact of traffic interventions including law enforcement and increasing traffic ticket fines with mortality, injury and traffic offenses of roads in Iran. So, not only the scope of this paper is different, but also the methodology is different, too. In addition, the data in this study is more than previous study (in current study we evaluate more than 10 time series but in previous paper we just forecast three time series). However, in cover letter, authors mentioned why current study is not dual publication with some logical reasons and also we added the above published paper as a reference for the fig 2 with “this data partly were used by Delavar et al. (2019))”.

Reviewer #1:

Review’s Comments to the Author

Point-by-point responses to the issues raised by the Reviewer #1:

This study conducted a time series analysis of the impacts of law enforcement and increased traffic ticket fines policy on road traffic mortality, injuries and offenses in Iran. The research topic is worth of investigation. However, several revisions may be required before its publication.

We appreciate the reviewer's valuable comments. We have tried to enhance the manuscript by addressing your comments. In the following section our responses are presented:

The detailed comments are as follows:

1- The Introduction section should be re-structured. For instants, some alcohol-related studies reviewed in the section are not related to road traffic safety. Thus, they should be removed from the section.

ANSWER: We are in agreement with the reviewer comment. So, those researches related to alcohol effect were removed from introduction section. Also, the introduction was reorganized which is obvious in track-change version. In addition, lines 348-350, 353-363 and 369-377 were moved to introduction section which is in the paragraph about traffic interventions and their impact on injuries and mortalities. In addition, some relevant references related to evaluating the impact of law enforcement on road traffic injuries were added in lines 144-162. Also, studies suggested by the reviewer were helpful for enriching the introduction and were written in lines 163-170.

“Botswana evaluated effects of traffic policies and alcohol consumption reduction on the decreased incidence rate of traffic fatality and injuries between 2004-2011. Beatriz et al. (2017) studied the effect of legal blood alcohol concentration (BAC) reduction in traffic-related fatality and morbidity between January 2003 and December 2014 in Chile and found that alcohol-related injuries were reduced. In addition, deregulation policies of the driving license application process which was proved to facilitate obtaining the license in Korea had a statistically significant association with the increase in incidence rate of death, injuries, and collisions (Oh et al., 2016). Grundy et al. (2015) investigated the role of 20 mph traffic speed zones in road traffic injuries between 1986-2006 in London. Results revealed that slower motor vehicle speeds were more successful in reducing the severity of injury rather than frequency of collisions. Traffic interventions can have different outcomes with respect to samples. For instance, Otero et al. (2017) evaluated the effect of BAC reduction and increase in driver's license suspension for traffic offenders on traffic fatality and injuries between 2009-2014 in Chile. They found significant reduction only in injuries; thus, unlike prior study, frequency of collisions and injuries has been decreased.

Chen et al. (2019) used random parameters bivariate ordered probit model to to assess potential factors aecting the level of injury sustained by two drivers involved in the same rear-end crash between passenger cars. The results showed that driver age, gender, vehicle, airbag or seat belt use, traffic flow are found to impact injury severity for both the two drivers.

Chen et al. (2011) studied accident data involving trucks on rural highway to evaluate the difference in driver-injury severity between single- and multi-vehicle accidents by using mixed logit models. It is found that the snow road surface and light traffic indicators will be better modeled as random parameters in SV and MVmodels respectively. "

2- In the proposed statistical model, accommodating temporal correlations is reasonable. However, the linear model may not be appropriate. Using Tobit-based approaches for modeling crash rates may be more suitable, such as the following works:

Jointly modeling area-level crash rates by severity: A Bayesian multivariate random-parameters spatio-temporal Tobit regression. Transportmetrica A: Transport Science, 15 (2): 1867-1884.

Incorporating temporal correlation into a multivariate random parameters Tobit model for modeling crash rate by injury severity. Transportmetrica A: Transport Science, 14 (3): 177-191.

A Bayesian spatial random parameters Tobit model for analyzing crash rates on roadway segments. Accident Analysis Prevention, 100, 37-43.

As mentioned in the above papers, in addition to temporal correlations, spatial correlations can also be considered in the models.

ANSWER: Thank you for the references and authors reviewed them.

First, we think that the tobit model or censored regression model is designed to estimate linear relationships between variables when there is either left- or right-censoring in the dependent variable. In this study, univariate models were used and there is no censored data because these data were obtained from Iranian Legal Medicine and Road Ministry from all highways in Iran and include mortality, injury and traffic offenses which were recorded from cameras or collected by Iranian Legal Medicine.

Secondly, this study used interrupted time series to investigate the changes during studied time period and this methodology was used with researchers across the world to evaluate the intervention base on time domain (Gustafsson et al, 2011; Herttua et al, 2009; Pun et al, 2013; Kisely et al, 2016; Sanchez et al, 2011; Herttua et al,2015). In addition, If the data used in this study were in segments and changed during the time, so authors could consider spatial correlation in the model. But, this study is a macro study with big data to investigate policy of Iranian government in transportation and it is not related to a specific area with a lot of segments.

Thirdly, considering both time and location domain is like using panel data which are multi-dimensional data involving measurements, observations of multiple phenomena over time. In our study time series of road accident mortality, injury and traffic offenses of Iran which is a special case of panel data were studied. So, other factors which affect mortality or injury for the studied time period are not available to use them as paned data with multi-dimensional.

In addition, as authors said, there are a lot of papers with using interrupted time series like the methodology of this paper such as following articles. It should be noted that in this study, interrupted time series method was extended with using a variety of interventions like level shift and delay level shift. Also, change point detection was added as the process of modeling.

Finally, the above references, that the reviewer suggest, were used in lines 105-108 for more clarification of the differences between methods that can be utilized as macro and micro level.

“Time series analysis can be utilized as macro study to investigate the policy (Gustafsson et al, 2011; Herttua et al, 2009; Pun et al, 2013; Kisely et al, 2016; Sanchez et al, 2011; Herttua et al,2015). While, temporal and spatio-temporal multivariate random-parameters tobit model are some of the methods that can be used as micro level (Zeng et al, 2017; Zeng et al, 2019).”

Zeng, Q., Wen, H., Xin Pei, H. H., Wong, S. C., 2017. Incorporating temporal correlation into a multivariate random parameters Tobit model for modeling crash rate by injury severity, Transportmetrica A: Transport Science.

Zeng, Q., Guo, Q., Wong, S. C., Wen, H., Huang, H., Pei, X., 2019, Jointly modeling area-level crash rates by severity: A Bayesian multivariate randomparameters spatio-temporal Tobit regression, Transportmetrica A: Transport Science.

Gustafsson, N.J., Ramstedt, M.R., 2011. Changes in alcohol-related harm in Sweden after increasing alcohol import quotas and a Danish tax decrease—an interrupted time-series analysis for 2000–2007. International Journal of Epidemiology 40, 432-440.

Herttua, K., Makela, P., Martikainen, P., 2009. An evaluation of the impact of a large reduction in alcohol prices on alcohol-related and all-cause mortality: time series analysis of a population-based natural experiment. International Journal of Epidemiology 40, 441-454.

Pun, V.C., Lin, H., Kim, J.H., et al, 2013. Impacts of alcohol duty reductions on cardiovascular mortality among elderly Chinese: a 10-year time series analysis. Journal of Epidemiology and Community Health 67, 514-8.

Kisely, S., Lawrence, D., 2016. A time series analysis of alcohol-related presentations to emergency departments in Queensland following the increase in alcopops tax. journal of Epidemiology and Community Health 70, 181-186.

Sanchez, A.I., Villaveces, A., Krafty, R.T., Park, T., Weiss, H.B., Fabio, A., Puyana, J.C., et al., 2011. Policies for alcohol restriction and their association with interpersonal violence: a time-series analysis of homicides in Cali, Colombia. International Journal of Epidemiology 40, 1037-1046.

Herttua, K., Makela, P., Martikainen, P., 2015. Minimum Prices for Alcohol and Educational Disparities in Alcohol-related mortality. Epidemiology 26, 337-343.

Reviewer #2:

Review’s Comments to the Author

Point-by-point responses to the issues raised by the the Reviewer #2:

The topic of this paper is important. The results are meaningful and useful. There are several suggestions to improve this paper.

We appreciate the reviewer for his/her positive comments about the subject of our research and your insightful feedbacks about the material. We tried to use this opportunity to increase the quality of the article using the comments of the reviewer.

1- “mortality” is typically replaced by “fatality” in this field.

ANSWER: Thanks for your helpful advice to replace fatality instead of mortality. Some authors in epidemiology studies used mortality instead of fatality which is mentioned bellow. So, authors decided to use this world. But, due to helpful comment of respective reviewer, fatality was used in the paper to be more precise.

Herttua, K., Makela, P., Martikainen, P., 2009. An evaluation of the impact of a large reduction in alcohol prices on alcohol-related and all-cause mortality: time series analysis of a population-based natural experiment. International Journal of Epidemiology 40, 441-454.

Herttua, K., Makela, P., Martikainen, P., 2015. Minimum Prices for Alcohol and Educational Disparities in Alcohol-related mortality. Epidemiology 26, 337-343.

Pun, V.C., Lin, H., Kim, J.H., et al, 2013. Impacts of alcohol duty reductions on cardiovascular mortality among elderly Chinese: a 10-year time series analysis. Journal of Epidemiology and Community Health 67, 514-8.

2- What’s the tendency of the population and traffic volume in Iran in the time period?

ANSWER: National Organization for Civil Registration of Iran publishes data on births and deaths monthly (National Organization for Civil Registration, 2017). According to these data, the trend of Iranian population is positive. In this case, 950,000 people were added to the population each year. Also, the tendency of volume per camera (due to increasing the cameras in Iran, so the trend of aggregated volume is not normalized) is increasing.

National Organization for Civil Registration(NOCR), 2017. Iran. Available: https://www.sabteahval.ir/en [Accessed].

3- Line 54-64, the information from World health organization (2015) report is too lengthy. And the reference (World Health Organization, 2015) need to be mentioned on line 54.

ANSWER: The manuscript has been reviewed by authors and revised. So, the line 58 and lines 64-67 were removed and the last sentence which is in line 76-79 is moved as the first sentence in the paragraph in lines 59-62. Also, the reference (Word Health Organization) was added in line 65.

4- For the influence of law enforcement on injury severity, more references are needed. For example, the following ones.

[1] Investigation on the Injury Severity of Drivers in Rear-End Collisions Between Cars Using a Random Parameters Bivariate Ordered Probit Model, International Journal of Environmental Research and Public Health, 2019, 16(14) , 2632.

[2] “Injury severities of truck drivers in single- and multi-vehicle accidents on rural highway”, Accident Analysis and Prevention, 2011, 43(5), 1677-1688.

ANSWER: Thanks for your constructive suggestion. Some useful references related to evaluating the impact of law enforcement on road traffic injuries were added in lines 144-162. In addition, papers which the reviewer mentioned are helpful for enriching the introduction and were written in lines 163-170.

“Botswana evaluated effects of traffic policies and alcohol consumption reduction on the decreased incidence rate of traffic fatality and injuries between 2004-2011. Beatriz et al. (2017) studied the effect of legal blood alcohol concentration (BAC) reduction in traffic-related fatality and morbidity between January 2003 and December 2014 in Chile and found that alcohol-related injuries were reduced. In addition, deregulation policies of the driving license application process which was proved to facilitate obtaining the license in Korea had a statistically significant association with the increase in incidence rate of death, injuries, and collisions (Oh et al., 2016). Grundy et al. (2015) investigated the role of 20 mph traffic speed zones in road traffic injuries between 1986-2006 in London. Results revealed that slower motor vehicle speeds were more successful in reducing the severity of injury rather than frequency of collisions. Traffic interventions can have different outcomes with respect to samples. For instance, Otero et al. (2017) evaluated the effect of BAC reduction and increase in driver's license suspension for traffic offenders on traffic fatality and injuries between 2009-2014 in Chile. They found significant reduction only in injuries; thus, unlike prior study, frequency of collisions and injuries has been decreased.

Chen et al. (2019) used random parameters bivariate ordered probit model to assess potential factors affecting the level of injury sustained by two drivers involved in the same rear-end crash between passenger cars. The results showed that driver age, gender, vehicle, airbag or seat belt use, traffic flow are found to impact injury severity for both the two drivers.

Chen et al. (2011) studied accident data involving trucks on rural highway to evaluate the difference in driver-injury severity between single- and multi-vehicle accidents by using mixed logit models. It is found that the snow road surface and light traffic indicators will be better modeled as random parameters in SV and MVmodels respectively. "

5- Also, in order to reach the aim of 10 000 casualties by the year 2027” There need to be a reference and the nation should be mentioned.

ANSWER: The reference and country for the sentence “in order to reach the aim of 10000 casualties by the year 2027 are mentioned in lines 322-325. In these lines, it mentioned that the road safety plan of Safety Commission of the Ministry of Roads and Urban Development in Iran proposed 3 scenarios in which annual road traffic fatality is expected to reach 12 000, 10 000 and 8 000 causalities until 2027 (Iranian Committee on Roads Safety, 2018). However, the reference and the nation of above sentence were added and revised sentence is in line 344 and 347.

6- For the methodology, the authors need to at least mention the panel-data models which combine time-serial and cross-section models. The following are some references.

[3] Analysis of hourly crash likelihood using unbalanced panel data mixed logit model and real-time driving environmental big data. 2018, JOURNAL OF SAFETY RESEARCH. 65: 153-159.

[4] “Investigating the Differences of Single- and Multi-vehicle Accident Probability Using Mixed Logit Model", Journal of Advanced Transportation, 2018, UNSP 2702360.

[5] “Crash Frequency Modeling Using Real-Time Environmental and Traffic Data and Unbalanced Panel Data Models”, International Journal of Environmental Research and Public Health, 2016, 13(6), 609.

ANSWER: First, thank you for your constructive suggestion. As you know, panel data are multi-dimensional data involving measurements, observations of multiple phenomena over time. In our study time series of road accident mortality, injury and traffic offenses of Iran were studied. So, other factors which affect mortality or injury for the studied time period are not available to use them as paned data with multi-dimensional. However, time series data can be studied and modeled as special cases of panel data that are in one dimension only. So, above references are useful to enrich and strength the introduction and used in line 226-230.

“In this study, Time series which is a special case of panel data were used to model the traffic intervention with statistical tools. In this regard, Panel data which are multi-dimensional data involving measurements over time were used as a methodology in a variety of application in traffic safety. For instance, Chen et al. (2016) and Chen et al. (2018) used unbalanced panel data to investigate hourly crash frequency on highway segments. "

Attachment

Submitted filename: Response to Reviewers.docx

Decision Letter 1

Feng Chen

18 Mar 2020

Impact of law enforcement and increased traffic ticket fines policy on road traffic mortality, injuries and offenses in Iran: Interrupted time series analysis

PONE-D-19-32920R1

Dear Dr. Mohammadzadeh Moghaddam,

We are pleased to inform you that your manuscript has been judged scientifically suitable for publication and will be formally accepted for publication once it complies with all outstanding technical requirements.

Within one week, you will receive an e-mail containing information on the amendments required prior to publication. When all required modifications have been addressed, you will receive a formal acceptance letter and your manuscript will proceed to our production department and be scheduled for publication.

Shortly after the formal acceptance letter is sent, an invoice for payment will follow. To ensure an efficient production and billing process, please log into Editorial Manager at https://www.editorialmanager.com/pone/, click the "Update My Information" link at the top of the page, and update your user information. If you have any billing related questions, please contact our Author Billing department directly at authorbilling@plos.org.

If your institution or institutions have a press office, please notify them about your upcoming paper to enable them to help maximize its impact. If they will be preparing press materials for this manuscript, you must inform our press team as soon as possible and no later than 48 hours after receiving the formal acceptance. Your manuscript will remain under strict press embargo until 2 pm Eastern Time on the date of publication. For more information, please contact onepress@plos.org.

With kind regards,

Feng Chen

Academic Editor

PLOS ONE

Additional Editor Comments (optional):

Reviewers' comments:

Reviewer's Responses to Questions

Comments to the Author

1. If the authors have adequately addressed your comments raised in a previous round of review and you feel that this manuscript is now acceptable for publication, you may indicate that here to bypass the “Comments to the Author” section, enter your conflict of interest statement in the “Confidential to Editor” section, and submit your "Accept" recommendation.

Reviewer #1: (No Response)

Reviewer #2: All comments have been addressed

**********

2. Is the manuscript technically sound, and do the data support the conclusions?

The manuscript must describe a technically sound piece of scientific research with data that supports the conclusions. Experiments must have been conducted rigorously, with appropriate controls, replication, and sample sizes. The conclusions must be drawn appropriately based on the data presented.

Reviewer #1: (No Response)

Reviewer #2: Yes

**********

3. Has the statistical analysis been performed appropriately and rigorously?

Reviewer #1: (No Response)

Reviewer #2: Yes

**********

4. Have the authors made all data underlying the findings in their manuscript fully available?

The PLOS Data policy requires authors to make all data underlying the findings described in their manuscript fully available without restriction, with rare exception (please refer to the Data Availability Statement in the manuscript PDF file). The data should be provided as part of the manuscript or its supporting information, or deposited to a public repository. For example, in addition to summary statistics, the data points behind means, medians and variance measures should be available. If there are restrictions on publicly sharing data—e.g. participant privacy or use of data from a third party—those must be specified.

Reviewer #1: (No Response)

Reviewer #2: Yes

**********

5. Is the manuscript presented in an intelligible fashion and written in standard English?

PLOS ONE does not copyedit accepted manuscripts, so the language in submitted articles must be clear, correct, and unambiguous. Any typographical or grammatical errors should be corrected at revision, so please note any specific errors here.

Reviewer #1: (No Response)

Reviewer #2: Yes

**********

6. Review Comments to the Author

Please use the space provided to explain your answers to the questions above. You may also include additional comments for the author, including concerns about dual publication, research ethics, or publication ethics. (Please upload your review as an attachment if it exceeds 20,000 characters)

Reviewer #1: The authors have addressed most of my comments. Nonetheless, some minor revisions should be made on the formats of references where there are many inconsistencies and typos. For example, the correct format of Zeng et al. (2018, 2019) should be :

Zeng, Q., Wen, H., Huang, H., Pei, X., Wong, S. C., 2018. Incorporating temporal correlation into a multivariate random parameters Tobit model for modeling crash rate by injury severity. Transportmetrica A: transport science, 14(3), 177-191.

Zeng, Q., Guo, Q., Wong, S. C., Wen, H., Huang, H., Pei, X., 2019. Jointly modeling area-level crash rates by severity: a Bayesian multivariate random-parameters spatio-temporal Tobit regression. Transportmetrica A: Transport Science, 15(2), 1867-1884.

Please check and modify the formats of all references carefully.

Reviewer #2: (No Response)

**********

7. PLOS authors have the option to publish the peer review history of their article (what does this mean?). If published, this will include your full peer review and any attached files.

If you choose “no”, your identity will remain anonymous but your review may still be made public.

Do you want your identity to be public for this peer review? For information about this choice, including consent withdrawal, please see our Privacy Policy.

Reviewer #1: No

Reviewer #2: No

Acceptance letter

Feng Chen

30 Mar 2020

PONE-D-19-32920R1

Impact of law enforcement and increased traffic fines policy on road traffic fatality, injuries and offenses in Iran: Interrupted time series analysis

Dear Dr. Mohammadzadeh Moghaddam:

I am pleased to inform you that your manuscript has been deemed suitable for publication in PLOS ONE. Congratulations! Your manuscript is now with our production department.

If your institution or institutions have a press office, please notify them about your upcoming paper at this point, to enable them to help maximize its impact. If they will be preparing press materials for this manuscript, please inform our press team within the next 48 hours. Your manuscript will remain under strict press embargo until 2 pm Eastern Time on the date of publication. For more information please contact onepress@plos.org.

For any other questions or concerns, please email plosone@plos.org.

Thank you for submitting your work to PLOS ONE.

With kind regards,

PLOS ONE Editorial Office Staff

on behalf of

Dr. Feng Chen

Academic Editor

PLOS ONE

Associated Data

    This section collects any data citations, data availability statements, or supplementary materials included in this article.

    Supplementary Materials

    S1 File. Total aggregated data–mortalities.

    (RAR)

    S2 File. Total aggregated data–injuries.

    (RAR)

    S3 File. Total aggregated data–traffic offenses.

    (RAR)

    Attachment

    Submitted filename: Response to Reviewers.docx

    Data Availability Statement

    All relevant data are within the paper and its Supporting Information files.


    Articles from PLoS ONE are provided here courtesy of PLOS

    RESOURCES