

Abstract
Purpose:
We previously found extensive desialylation of glycoconjugates and upregulation of the sialidase enzyme NEU3 in fibrotic lesions in human and mouse lungs. However, studies using microarray analysis of whole lung tissue mRNA and single cell RNA-seq found no significant difference in levels of NEU3 mRNA between IPF patients and controls. This study aimed to elucidate how NEU3 was upregulated in fibrotic lungs.
Materials and Methods:
Transforming growth factor-β1 (TGF-β1), a key driver of fibrosis, was added to A549 human alveolar basal epithelial adenocarcinoma cells and human small airway epithelial cells (HSAEpC). NEU3 expression in A549 cells and HSAEpC was detected by immunofluorescence staining. NEU3 translation and degradation were assessed by polysome profiling (polysomes efficiently translate mRNAs; monosomes poorly translate mRNAs) and cycloheximide chase after treating cells with or without TGF-β1 for 48 hours.
Results:
TGF-β1 increased NEU3 expression and secretion in A549 cells and HSAEpC but did not change total (nuclear + cytosolic) NEU3 mRNA levels. TGF-β1 decreased the degradation rate of NEU3 in A549 cells. TGF-β1 decreased NEU3 mRNA levels in monosomes and increased NEU3 mRNA level in polysomes.
Conclusion:
TGF-β1 upregulates levels of NEU3 in epithelial cells by both decreasing NEU3 degradation and by increasing the translation of NEU3 mRNA, explaining the apparent paradox of high levels of NEU3 protein in pulmonary fibrosis without a concomitant increase in the expression of NEU3 mRNA.
Keywords: Pulmonary fibrosis, sialidase, TGF-β1, translation, degradation
Instruction
Pulmonary fibrosis is a chronic and generally fatal disorder characterized by progressive formation of scar-like tissue in the lungs. Despite some impressive advances, the fundamental mechanisms that cause pulmonary fibrosis are still unclear. Sialic acids are often found as the distal terminal sugar on glycoconjugates. Sialidases (also called neuraminidases) desialylate (remove the sialic acid from) glycoconjugates. Mammals have four sialidases, NEU1-NEU4. We found extensive desialylation of glycoconjugates and upregulation of NEU2 and NEU3 in fibrotic lesions in human and mouse lungs1. We also found NEU3 upregulated in the BAL fluid from mice with bleomycin-induced pulmonary fibrosis. However, studies using microarrays of whole lung tissue mRNA and single cell RNA-seq found no significant difference in levels of NEU3 mRNA between IPF patients and controls2,3. Since inhibiting NEU3 activity inhibits pulmonary fibrosis in the mouse bleomycin model1, NEU3 appears to be a significant contributor to fibrosis. Determining how NEU3 is upregulated may help us understand basic mechanisms of fibrosis.
Materials and Methods
Cytoplasmic lysate preparation
5 × 10⁵ adenocarcinoma human alveolar basal epithelial cells (A549) (PromoCell, Heidelberg, Germany) were cultured in 10 ml D medium (DMEM (Lonza, Walkersville, MD) supplemented with 10% bovine calf serum (BCS) (Seradigm, Randor, PA), 100 U/ml penicillin, 100 μg/ml streptomycin, and 2 mM glutamine (all from Lonza)) for 24 – 48 hours in 100 mm tissue culture dishes (Corning, NY). 1 × 10⁶ human small airway epithelial cells (HSAEpC) (PromoCell) were cultured in 10 ml small airway epithelial cells growth medium (PromoCell) supplemented with 10% small airway epithelial cells growth medium supplement mix (PromoCell) for 24 – 48 hours in 100 mm tissue culture dishes (Corning). When the cell density reached ~60% confluence, the supernatant was removed and cells were gently rinsed with prewarmed PBS 3 times. For A549 cells, the medium was changed to prewarmed 10 ml DMEM supplemented with 100 U/ml penicillin, 100 μg/ml streptomycin, and 2 mM glutamine (no BCS) with or without 10 ng/ml TGF-β1 (PeproTech, Rocky Hill, NJ). For HSAEpC, the medium was replaced by 10 ml fresh culture medium with or without 10 ng/ml TGF-β1. After 48 hours, the cell density reached 80 – 90% confluence, and 10 μl of 100 mg/ml cycloheximide (CHX) (VWR, Radnor, PA) in dimethyl sulfoxide (DMSO) (VWR) was added to the cells (100 μg/ml CHX final concentration) and incubated for 10 minutes at 37˚ C. The culture media was removed and cells were rinsed 3 times with ice cold PBS supplemented with 100 μg/ml CHX. Cells were detached with 1.5 ml Accutase (Innovative Cell Technologies, San Diego, CA) for 3 – 5 minutes at 37˚ C, then cells were collected by centrifugation at 500 × g for 5 minutes and resuspended in 1 ml ice cold PBS/ CHX. Cells were counted, and 5 × 10⁶ cells were collected by centrifugation, and resuspended and lysed in 1 ml polysome lysis buffer (PLB) containing 15 mM Tris pH 7.5, 300 mM NaCl, 15 mM MgCl2, 1% TritonX-100 (Alfa Aesar, Ward Hill, MA), 100 μg/ml CHX, 1 mg/ml Heparin (Alfa Aesar) and 500 U/ml RNase inhibitor (Invitrogen, Carlsbad, CA). Cells were lysed on ice for 15 minutes with inverting every 2 – 3 minutes. The lysates were clarified by centrifugation at 12,000 × g for 10 minutes at 4˚ C, and supernatants (cytoplasmic lysates) were transferred to a fresh tube and stored at −80˚ C.
Polysome profiling and qPCR
10% sucrose solutions were made with polysome gradient buffer (10 mM HEPES-KOH pH 7.5, 70 mM NH4OAc, 5 mM Mg(OAc)2) and 10% (w/v) sucrose (Sigma, St. Louis, MO). 50% sucrose solutions were made with polysome gradient buffer and 50% (w/v) sucrose. All solutions were made with 0.22 μm membrane filtered, diethyl pyrocarbonate (DEPC) (Sigma) treated MilliQ water (Millipore, Billerica, MA)4. 10 – 50% sucrose density gradients were made in open top polyclear tubes (Seton Scientific, Petaluma, CA) with equal volumes of 10% and 50% sucrose solution by gentle mixing on a model 108 gradient master (BioComp, Fredericton, New Brunswick, Canada). Sucrose gradients prepared a day before the polysome profiling experiment, and a SW41Ti rotor with buckets (Beckman Instruments, Indianapolis, IN), were pre-cooled at 4˚ C overnight. 300 μl of cytoplasmic lysates were layered on the top of the gradients, and the gradients were centrifuged at 40,000 rpm at 4˚ C for 2 hours. The gradients were placed onto a model 153 gradient station with TRiAX flow cell (BioComp) after centrifugation and fractionated following the manufacturer’s protocol. 14 fractions were collected per gradient, with 0.8 ml per fraction, on a FC203B fraction collector (Gilson, Middleton, WI). The RNA amount in each fraction was read by a 254 nm spectrophotometer within the optical unit of the fractionation system and a chart was plotted based on the polysome profile of the gradient. 0.5 ml of each sucrose fraction was mixed with 0.5 ml TRIzol (Invitrogen) and 0.2 ml chloroform, then centrifuged at 12,000 g for 15 minutes at 4˚ C. 0.5 ml of the upper layer was transferred to a fresh tube containing 1 ml isopropanol and 2 μl of 15 mg/ml Glycoblue (Invitrogen). After mixing, the RNA was precipitated by incubating overnight at −20˚ C followed by centrifugation at 12,000 g for 15 minutes at 4˚ C. The pellet was rinsed once with 1 ml cold 70% ethanol. The ethanol was discarded after centrifugation at 12,000 g for 15 minutes at 4˚ C. The RNA pellet was air dried for 10 minutes at room temperature and dissolved in 12 μl nuclease-free water (Thermo Scientific, Rockford, IL). RNA reverse transcription and cDNA synthesis were performed with a Maxima H Minus First Strand cDNA Synthesis Kit (Thermo Scientific), and 10 μl qPCR reactions were prepared in 96-well plates with an AzuraView GreenFast qPCR Blue Mix (Azura Genomics, Raynham, MA) following the manufacturer’s protocols. The mRNA distribution for NEU3 was calculated using the ΔCT method5. GAPDH mRNA was used as a reference. Conventional PCR was also performed as previously described, using 30 cycles for NEU3 and 24 cycles for GAPDH6.
NEU3 primers:
Forward: 5’- CAGCAAAGATGCACCCACC −3’
Reverse: 5’- TGTGTAAACAGGCGGAAGGC −3’
GAPDH primers:
Forward: 5’- GTCTCCTCTGACTTCAACAGCG −3’
Reverse: 5’- ACCACCCTGTTGCTGTAGCCAA −3’
Immunofluorescence staining
5 × 10⁴ A549 cells and HSAEpC were cultured with or without 10 ng/ml TGF-β1 in 500 μl culture medium per well for 48 hours in 8 chamber tissue culture treated glass slides (Corning). The supernatant was then collected for western blots and cells were used for NEU3 immunofluorescence staining as previously described6.
Western blots
A549 cells at 50% confluence were cultured in 2 ml D medium (no BCS) with or without 10 ng/ml TGF-β1 for 48 hours in a 6-well tissue culture plate (Corning). 3 μl of 100 mg/ml CHX in DMSO (150 μg/ml CHX final concentration) or an equal volume of DMSO was then added to the cells for 0, 4, 8 and 12 hours. Cells were detached with 500 μl Accutase for 3–5 min and centrifuged at 500 × g for 5 mins at room temperature. Cells were resuspended in 1 ml ice cold CHX contained PBS and counted. 5 × 10⁵ cells at each time point were collected by centrifugation at 500 × g for 5 minutes at room temperature. Cell pellets were lysed with 200 μl RIPA Buffer (Thermo Scientific) containing protease/phosphatase inhibitor (Cell Signaling Technology, Danvers, MA) on ice for 30 minutes. Supernatants were collected after centrifuging at 12,000 × g for 15 min at 4˚ C. 5 μl of supernatant was mixed with 5 μl 2X SDS sample buffer and heated to 95˚ C for 5 minutes. Western blots were performed as described previously with the following exceptions7. For relative quantitation, gels also contained serial factor of 2 dilutions of the 0-hour TGF-β1 sample. Blocking was in PBS/2% BSA/5% nonfat milk. Anti-β-actin antibodies (Cell Signaling Technology) were incubated at 1: 3000 in PBS/ 2%BSA. Type 21630002 anti-NEU3 antibodies (Novus, Centennial, CO) were incubated at 1:5000 in PBS/ 2% BSA/ 0.1% NP-40 alternative (Millipore)/ 0.01% SDS. All washes were in PBS/ 0.1% (v/v) Tween-20 (VWR). Super Signal West Pico Chemiluminescence Substrate (Thermo Scientific) was used following the manufacturer’s protocol to visualize the peroxidase using a ChemiDoc XRS + System (Bio-Rad, Hercules, CA).
Results
TGF-β1 increases NEU3 expression but does not affect NEU3 mRNA levels in A549 cells
Transforming growth factor-β1 (TGF-β1), a key driver of fibrosis, causes NEU3 upregulation in human peripheral blood mononuclear cells (PBMC), human small airway epithelial cells, and human lung fibroblasts1. The human alveolar basal epithelial adenocarcinoma cell line A549 is a standard model for human lung epithelial cells8,9. Human small airway epithelial cells (HSAEpC) are cells isolated from human distal respiratory tract. To elucidate how TGF-β1 upregulates NEU3, A549 cells and HSAEpC were treated with or without 10 ng/ml TGF-β1 in serum-free and protein-free medium for 48 hours. Immunofluorescence staining indicated that TGF-β1 increased levels of NEU3 in both cell lines (Figure 1A), and western blots stained for NEU3 indicated that TGF-β1 increased levels of NEU3 secreted and/or released into the culture medium from both cell lines (Figure 1B). The human NEU3 gene generates several different splice variants10, and to assay NEU3 mRNA by RT-qPCR, we used primers that flank the region encoding the NEU3 domain which the NEU3 antibodies bind and which contains the NEU3 active site. TGF-β1 did not significantly change total (nuclear + cytosolic) NEU3 mRNA levels relative to levels of GAPDH mRNA in A549 cells (Figure 1C). Because TGF-β1 might affect GAPDH mRNA, we checked NEU3 mRNA without normalizing to GAPDH mRNA; the NEU3 mRNA levels in TGF-β1 treated cells were 97 ± 2% of control (mean ± SEM, n=3).
Figure 1.

TGF-β1 increases NEU3 expression but does not affect NEU3 mRNA levels in epithelial cells. (A) A549 cells and HSAEpC were treated with or without TGF-β1 for 48 hours. Cells were stained for NEU3. Images are representative of 3 independent experiments. Bar is 100 μm. (B) Supernatants were collected from A before immunofluorescence staining. NEU3 in the supernatants was detected by western blots. 1 indicates control; 2 indicates cells treated with TGF-β1. Images are representative of 3 independent experiments. (C) A549 cells were treated with or without TGF-β1 for 48 hours. Total mRNA was extracted and NEU3 and GAPDH mRNA in A549 cells were measured by qPCR. Values are mean ± SEM of the ratios (n=3).
TGF-β1 decreases NEU3 degradation in A549 cells
As previously observed1, anti-NEU3 antibodies detect multiple bands on Western blots (Figures 1B 2A). TGF-β1 upregulated total NEU3 protein levels (Figures 2A and B), and significantly upregulated levels of the 90, 50, 35, and 27 kDa NEU3 bands (p < 0.02 for 90 kDa, p < 0.01 for 50 and 35 kDa, and p < 0.05 for 27 kDa (t tests)). Treatment of cells with cycloheximide, a translation inhibitor11,12, followed by western blotting to assess levels of NEU3 as a function of time, showed that TGF-β1 decreased the degradation of NEU3 in A549 cells (Figures 2A and B). At 12 hours after cycloheximide treatment, the cells showed a variety of morphological changes, so this data was not included in the subsequent analysis. Linear fits to the 0–8 hour data indicated that TGF-β1 decreased the degradation rate of the combined NEU3 bands from 8.7 ± 0.6% per hour to 3.6 ± 0.5% per hour (mean ± SEM, n=3; the difference is significant with p < 0.02 (t-test)). TGF-β1 also significantly decreased the degradation rate of the individual NEU3 bands (p < 0.01 for 90, 50 and 27 kDa, and p < 0.05 for 35 kDa (t tests)). The degradation of actin was not significantly affected by TGF-β1 (2.1 ± 0.5% per hour in the control, and 1.8 ± 0.4% with TGF-β1), indicating that the TGF-β1 effect on NEU3 degradation is not due to a general effect on protein degradation.
Figure 2.

TGF-β1 increases NEU3 expression by decreasing NEU3 protein degradation. (A) A549 cells were treated with or without TGF-β1 for 48 hours, and the translation inhibitor cycloheximide (CHX) was then added. Cells were collected at the indicated times and western blots were stained for NEU3 or actin. Images are representative of 3 independent experiments. (B) NEU3 protein expression from experiments such as panel B, with serial factor of 2 dilutions of the 0 hour TGF-β1 sample to generate a relative concentration curve, was measured by densitometry of all the NEU3 bands and a linear fit was performed to the 0-8 hour data. All values are mean ± SEM, n=3. ** indicates p < 0.01 (t test).
TGF-β1 increases NEU3 translation in epithelial cells
To elucidate the effect of TGF-β1 on translation of NEU3 mRNA, we performed polysome profiling to collect monosomes and polysomes, which contain poorly translated RNAs and highly translated RNAs respectively13,14, and assessed NEU3 mRNA levels by conventional PCR and qPCR (Figures 3A and B). In the cytosol, the ratio of NEU3 mRNA to GAPDH mRNA was higher than for total mRNA (p < 0.01 for both control and TGF-β1 (t-tests), comparing Figure 1C to Figure 3B), suggesting that NEU3 mRNA is transported from the nucleus to the cytosol more efficiently than GAPDH mRNA. Without normalizing to GAPDH, TGF-β1 caused the cytosolic NEU3 mRNAs to be 132 ± 8% of the control. In control lysates, NEU3 mRNA appeared to be more in polysomes and less in monosomes than GAPDH mRNA, and TGF-β1 further decreased NEU3 mRNA levels in monosomes and increased NEU3 RNA level in polysomes (Figures 3A and B). Without normalizing to GAPDH, TGF-β1 caused monosome-associated NEU3 mRNA to be 53 ± 3%, and polysome-associated NEU3 mRNA to be 209 ± 25%, of control.
Figure 3.
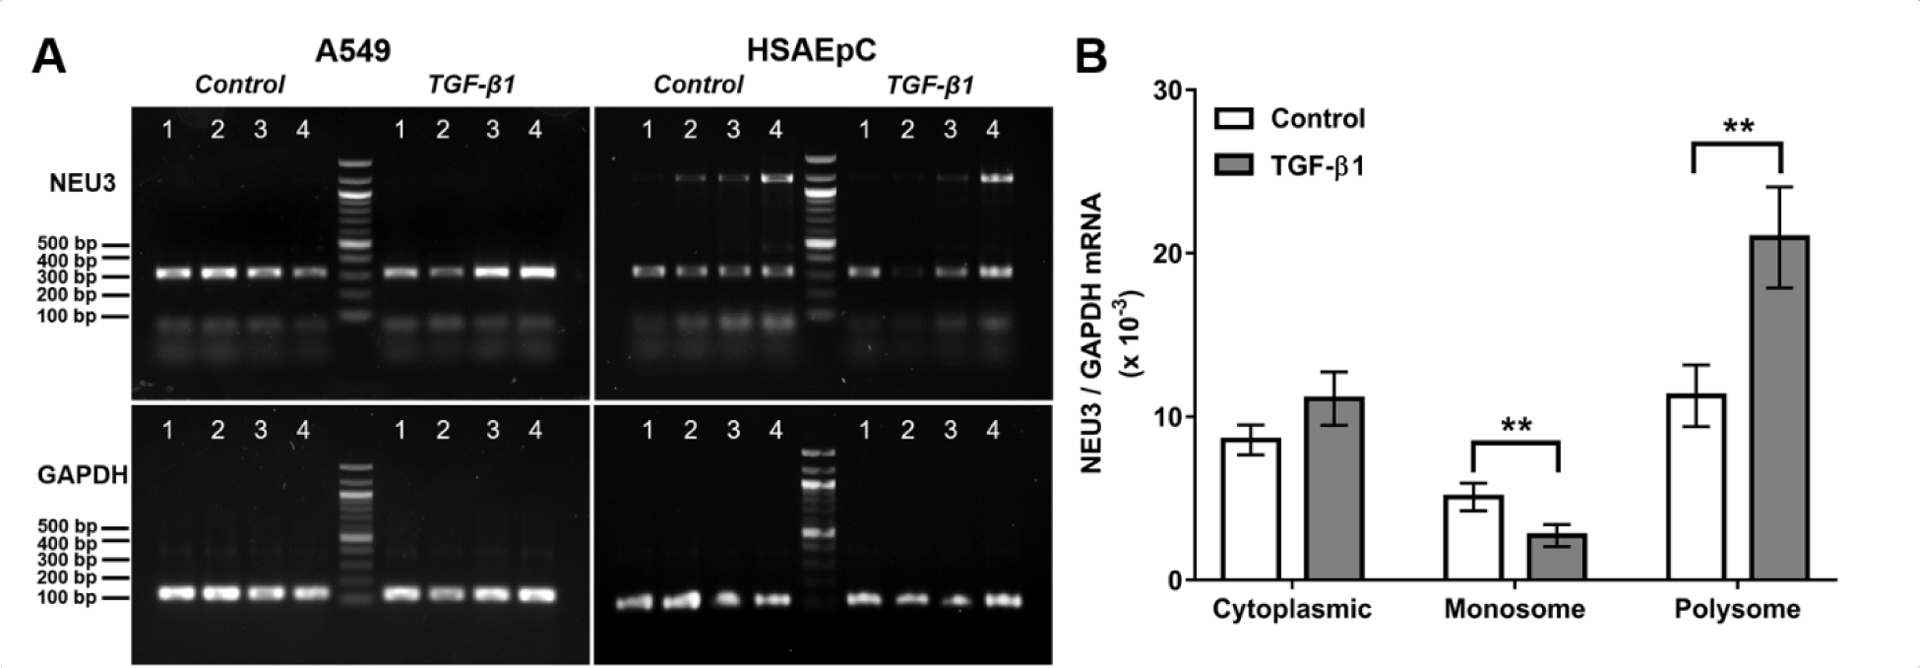
TGF-β1 increases NEU3 expression by upregulating NEU3 mRNA translation. (A) A549 cells and HSAEpC were treated with or without TGF-β1 for 48 hours. NEU3 and GAPDH mRNA in the cytosol (Lane 1), monosomes (Lane 2), early polysomes (Lane 3) and late polysomes (Lane 4) was measured by conventional PCR. Images are representative of 3 independent experiments. (B) A549 cells were treated with or without TGF-β1 for 48 hours. NEU3 and GAPDH mRNA in the cytosol, monosomes and polysomes was assessed by qPCR (n=3). All values are mean ± SEM, n=3. ** indicates p < 0.01 (t test).
Discussion
Together, these results suggest that TGF-β1 upregulates levels of NEU3 in lung epithelial cells by both decreasing NEU3 degradation and by increasing the translation of NEU3 mRNA. Since TGF-β1 regulates the expression of other proteins in mouse hepatoma, human osteosarcoma, and human mammary epithelial cells at the level of translation15–17 and also increases the stability of other proteins in human colon cancer cells18, and assuming that similar mechanisms regulate NEU3 levels in other lung cell types, this mechanism explains the apparent paradox of high levels of NEU3 protein in pulmonary fibrosis without a concomitant increase in the expression of NEU3 mRNA. This in turn suggests that TGF-β1 regulation of protein stability and mRNA translation may play a role in pulmonary fibrosis.
Acknowledgements
We thank Rachel Porter, Beckman Undergraduate Scholar for assistance with sucrose gradients, and Deb Bell-Pedersen, Tejas Karhadkar, and Darrell Pilling for helpful suggestions. This work was supported by the National Institutes of Health grant HL132919. The ribosome profiling equipment was purchased with National Institutes of Health grant GM126966 to Deborah Bell-Pedersen.
Footnotes
Declaration of interest
The authors report no conflicts of interest.
References
- 1.Karhadkar TR, Pilling D, Cox N & Gomer RH Sialidase inhibitors attenuate pulmonary fibrosis in a mouse model. Sci Rep 2017;7(1):15069. [DOI] [PMC free article] [PubMed] [Google Scholar]
- 2.Nance T et al. Transcriptome analysis reveals differential splicing events in IPF lung tissue. PLoS One 2014;9(5):e97550. [DOI] [PMC free article] [PubMed] [Google Scholar]
- 3.Reyfman PA et al. Single-Cell Transcriptomic Analysis of Human Lung Provides Insights into the Pathobiology of Pulmonary Fibrosis. Am J Respir Crit Care Med 2019;199(12):1517–1536. [DOI] [PMC free article] [PubMed] [Google Scholar]
- 4.Chirgwin JM, Przybyla AE, MacDonald RJ & Rutter WJ Isolation of biologically active ribonucleic acid from sources enriched in ribonuclease. Biochemistry 1979;18(24):5294–5299. [DOI] [PubMed] [Google Scholar]
- 5.Bubner B, Gase K & Baldwin IT Two-fold differences are the detection limit for determining transgene copy numbers in plants by real-time PCR. BMC Biotechnol 2004;4:14. [DOI] [PMC free article] [PubMed] [Google Scholar]
- 6.Karhadkar TR, Chen W & Gomer RH Attenuated pulmonary fibrosis in sialidase-3 knockout (Neu3−/−) mice. American Journal of Physiology-Lung Cellular and Molecular Physiology 2019;318(1):L165–L179. [DOI] [PMC free article] [PubMed] [Google Scholar]
- 7.Pilling D, Buckley CD, Salmon M & Gomer RH Inhibition of fibrocyte differentiation by serum amyloid P. J Immunol 2003;171(10):5537–5546. [DOI] [PMC free article] [PubMed] [Google Scholar]
- 8.Foster KA, Oster CG, Mayer MM, Avery ML & Audus KL Characterization of the A549 cell line as a type II pulmonary epithelial cell model for drug metabolism. Exp Cell Res 1998;243(2):359–366. [DOI] [PubMed] [Google Scholar]
- 9.Giard DJ et al. In vitro cultivation of human tumors: establishment of cell lines derived from a series of solid tumors. J Natl Cancer Inst 1973;51(5):1417–1423. [DOI] [PubMed] [Google Scholar]
- 10.Rodriguez-Walker M & Daniotti JL Human Sialidase Neu3 is S-Acylated and Behaves Like an Integral Membrane Protein. Sci Rep 2017;7(1):4167. [DOI] [PMC free article] [PubMed] [Google Scholar]
- 11.Downs CA, Kreiner LH, Trac DQ & Helms MN Acute effects of cigarette smoke extract on alveolar epithelial sodium channel activity and lung fluid clearance. Am J Respir Cell Mol Biol 2013;49(2):251–259. [DOI] [PMC free article] [PubMed] [Google Scholar]
- 12.Upton PD, Davies RJ, Tajsic T & Morrell NW Transforming growth factor-beta(1) represses bone morphogenetic protein-mediated Smad signaling in pulmonary artery smooth muscle cells via Smad3. Am J Respir Cell Mol Biol 2013;49(6):1135–1145. [DOI] [PMC free article] [PubMed] [Google Scholar]
- 13.Panda AC, Martindale JL & Gorospe M Polysome Fractionation to Analyze mRNA Distribution Profiles. Bio Protoc 2017;7(3). [DOI] [PMC free article] [PubMed] [Google Scholar]
- 14.Yang WY, Wilson HD, Velagapudi SP & Disney MD Inhibition of Non-ATG Translational Events in Cells via Covalent Small Molecules Targeting RNA. J Am Chem Soc 2015;137(16):5336–5345. [DOI] [PMC free article] [PubMed] [Google Scholar]
- 15.Beauchamp RD, Sheng HM, Alam T, Townsend CM Jr. & Papaconstantinou J Posttranscriptional regulation of albumin and alpha-fetoprotein messenger RNA by transforming growth factor-beta 1 requires de novo RNA and protein synthesis. Mol Endocrinol 1992;6(11):1789–1796. [DOI] [PubMed] [Google Scholar]
- 16.Liu C et al. Post-transcriptional stimulation of transforming growth factor beta 1 mRNA by TGF-beta 1 treatment of transformed human osteoblasts. J Bone Miner Res 1996;11(2):211–217. [DOI] [PubMed] [Google Scholar]
- 17.Lopez-Diaz FJ et al. Coordinate transcriptional and translational repression of p53 by TGF-beta1 impairs the stress response. Mol Cell 2013;50(4):552–564. [DOI] [PMC free article] [PubMed] [Google Scholar]
- 18.Gong J, Ammanamanchi S, Ko TC & Brattain MG Transforming growth factor beta 1 increases the stability of p21/WAF1/CIP1 protein and inhibits CDK2 kinase activity in human colon carcinoma FET cells. Cancer Res 2003;63(12):3340–3346. [PubMed] [Google Scholar]