

Summary
Background We have previously reported an experimental infection of young adults with a history of episodic and exclusive viral wheeze (EVW) using human coronavirus, in which 16 of 24 with EVW (15 atopic) and 11 of 19 healthy controls (seven atopic) developed a symptomatic cold with evidence of infection, but only those with EVW developed lower respiratory tract symptoms and increased airway responsiveness.
Objective The aim of this study was to compare the EVW and control groups from this study for inflammatory changes occurring in the upper and lower respiratory tracts during the experimental infection, in particular, to determine whether eosinophil‐driven inflammation was associated with EVW.
Methods Nasal lavage and induced sputum were collected prior to inoculation (day 0) and 2, 4 and 17 days later. Differential cell counts were performed and supernatant was assayed for IL‐8, IL‐5, IFN‐γ, and eosinophilic cationic protein (ECP).
Results There was no difference between the two groups in any measurement at baseline. In both groups, during colds the volume of nasal secretion increased as did leucocyte counts in both upper and lower respiratory tracts. A modest increase in nasal neutrophil count was seen in both EVW and control groups with symptomatic colds on day 2 (median (quartile) difference from baseline 5.4 (0.0, 11.0) and 1.8 (−1.1, 2.2)×104/mL of secretions, respectively). The change in nasal neutrophil counts in all subjects correlated with nasal symptom scores. A significant relative increase in sputum differential neutrophil count was seen on day 4 in the EVW group with a cold but not in controls (mean difference (95% confidence interval) 20.4 (9.6, 31.1)% and 3.1 (−8.2, 14.5)%, respectively, P<0.01); however, this increase did not correlate with lower respiratory tract symptom scores. IL‐8 increased in both the upper and lower respiratory tracts in both EVW and control subjects with colds, the largest change being seen on day 4 in the sputum of those with EVW (mean difference from baseline (95% confidence interval) 2.5 (0.55–4.46) ng/mL). Only modest changes were seen in IFN‐γ and no changes were seen in IL‐5 or ECP. None of the results was influenced by the atopic status of the subjects in either group.
Conclusions EVW wheeze is characterized by neutrophilic inflammation in both the upper and lower respiratory tracts without eosinophilia (even in atopic subjects). IL‐8 is likely to be an important chemokine in this process. Symptoms and airway responsiveness were correlated with change in neutrophils.
Keywords: common cold, exclusive viral wheeze, human coronavirus, neutrophil
Introduction
Exclusive viral wheeze (EVW) is an asthma phenotype that occurs predominantly in young children during common upper respiratory tract viral infections without progression to chronic airway inflammation and persistent symptoms associated with atopic asthma [1, 2]. The aftermath of EVW is detectable in adult life [[3] and we have confirmed its existence experimentally in young adults [4].
Due to the difficulty of performing invasive measurements in young children, there is little information on the cellular mechanisms of EVW in that age group. Opportunistic bronchoalveolar lavage (BAL) during anaesthesia has shown the relative absence of inflammatory cells in children with viral wheeze in between episodes, in contrast to those with atopic asthma [2]. There are no published data on inflammation in the respiratory tract during episodes of viral wheeze, although other evidence suggests that respiratory tract inflammation is likely to be involved. This comes from studies of inflammation in the upper respiratory tract (URT) and lower respiratory tract (LRT) in both healthy and asthmatic volunteers during ‘wild‐type’ [5, 6] and experimental infections, usually with human rhinovirus (HRV) [7, 8, 9, 10].
URT inflammation during colds is well described and predominantly involves neutrophil influx [11] with the release of cytokines and chemokines, which attract and activate inflammatory cells in the airway mucosa. In samples of nasal secretions, these soluble mediators include TNF‐α, IL‐8, IL‐6, IFN‐γ, GroA, and eosinophilic cationic protein (ECP) [9, 12, 13, 14, 15]. The LRT tract is also known to become inflamed during viral exacerbations of classical atopic asthma, two studies suggesting the recruitment of both neutrophils and eosinophils [5, 6]. In a study of acute severe asthma attacks, 50% of which were thought to be due to colds, high numbers of neutrophils, together with high concentrations of IL‐6 and IL‐8, were found in spontaneously expectorated sputum [5]. A second study of six classical asthmatics during colds found a more modest sputum neutrophilia, together with high levels of IL‐8 and ECP, compared with convalescent values [6]. Sputum eosinophil differential counts were not elevated in the latter despite evidence of their activation by the release of ECP.
Inherent difficulties exist when studying ‘wild‐type’ infections including timing of onset of infection and potential inter‐virus differences. Because of this and the problems of collecting invasive samples from young children during episodes of viral wheeze, we have established a model of EVW, employing an experimental infection using human coronavirus (HCoV) 229E, in young adults with a history of wheeze only during viral URT infection (URTI) [4]. HCoV, the second most prevalent common cold virus, is known to be associated with exacerbations of asthma in children [16] and with pre‐school wheeze [17]. Also, symptoms may be virus‐dependent [18], so it is important to study viruses other than HRV. We have previously reported that LRT symptoms and increased bronchial responsiveness in EVW subjects occur only during symptomatic infection and that these effects are independent of atopy [4]. We now report further analysis of this model to test the hypotheses that during symptomatic experimental URTI with HCoV 229E (1) a qualitative or quantitative difference in lower respiratory tract cellular infiltration distinguishes subjects with EVW from controls, (2) cellular changes seen in the LRT are qualitatively similar in nature to those seen in the URT, and (3) there is an association between the quantitative changes in the LRT and both symptoms and change in bronchial responsiveness.
Methods
Study design
The study design, symptom scores and physiological measurements have been reported elsewhere [4] and will be described briefly. Each subject paid four visits to the Clinical Trials Unit, Leicester Children's Asthma Centre. As well as clinical and physiological observations, nasal lavage and sputum inductions were carried out on day 0 immediately preceding virus inoculation and repeated 2, 4 and 17 days later at the same time of morning (±2 h). As the principal aim was to study mechanisms underlying URTI and the LRT response, we categorized subjects primarily on their symptomatic response, with laboratory confirmation of viral infection acting as an adjunct to validate the model and assist in categorizing subjects with borderline symptoms [4].
Subjects
Forty‐three adults, who had not smoked for at least 5 years, were recruited to the study. Nineteen healthy volunteers were recruited through local advertisements, and 24 with a history of EVW were recruited from three local university health centres. They gave a history of two or more episodes of wheeze with URTI in the last 2 years, but not exercise‐induced wheeze, nocturnal or early morning wheeze or cough, allergen (dust, pollen, animal)‐induced wheeze or wheeze in response to cold air, in the intervals between colds. The mean duration (range) of history was 12 (3–25) years. Only one subject had previously been labelled as asthmatic. None used inhaled corticosteroids, 14 used β2 agonists for relief during URTIs, and none had been admitted to hospital with a respiratory illness in the previous 5 years. No subject had suffered a URTI in the month preceding participation in the study.
Atopic status was assessed by skin prick test reaction to Dermatophagoides pteronyssinus, cat fur and mixed grass pollens compared with histamine‐positive and saline‐negative controls (Soluprick, ALK, Frederiksberg, Denmark). Subjects were classified as atopic on the basis of one or more positive skin prick tests, defined by a weal greater than 2 mm in diameter above the negative control. The study was approved by the Leicestershire Health Authority Research Ethics Committee and written informed consent was obtained from all participants.
Inoculation and clinical response
The 24 viral wheezers (15 atopic) and 19 controls (seven atopic) were inoculated nasally with 200 tissue culture infective doses (TCID50) of HCoV 229E as previously described [4]. Subjects were monitored for the development of symptoms by diary, spirometry and methacholine bronchial challenge, which were performed prior to sample collection on each visit, as has been previously described [4].
Sample collection
The technique of nasal lavage involved the subjects sitting with their necks extended to 45° while warm phosphate‐buffered saline with added inulin (0.45 mg/mL) was introduced into one nostril with the other occluded. Inulin was used as a marker of dilution and by measuring the inulin concentration in the wash solution and nasal lavage fluid (NLF) obtained, the proportion of NLF consisting of nasal secretions was calculated [19]. During the process, the subject occluded the soft palate by positive oral pressure so that the wash remained in the nasal cavity for 10 s before being expelled into a sterile receptacle that was kept on ice before weighing and processing within 1 h. A total of 10 mL in aliquots of 2.5 mL was inserted alternately in each nostril (5 mL total per nostril).
Sputum was induced using standard methods [20]. Briefly, subjects inhaled 200 μg salbutamol (by metred dose inhaler and Volumatic spacer) 10 min before inhaling nebulized 4.5% saline for three periods of 7 min from an ultrasonic nebulizer (Medix Ltd., Harlow, UK; output 0.9 mL/min; mass median diameter 5.6 μm) and mouthpiece. Sputum was expectorated after the subjects had blown their noses and gargled to minimize nasal and oral contamination. Sputum was stored on ice before weighing and processed within 1 h.
Cell processing
Cell processing was performed to assess the quality of the sample (cell viability and for sputum, squamous contamination), to count leucocytes and to perform differential cell counts. Processing followed commonly used and previously validated methods [20]. For sputum this included plug selection, dispersion with four times the volume of 0.1% dithiothreitol (DTT, Sigma, Poole, UK) giving a final concentration of 0.08%, gentle rocking for 15 min, further dilution with four volumes of Dulbecco's phosphate‐buffered saline, and filtration through a 48‐μm nylon gauze. NLF was processed in a similar way, but additional dilution was minimized by using 1% DTT to a concentration of 0.08% and skipping the second dilution step. Samples were then centrifuged at 790 g for 10 min and the supernatant removed, aliquoted and stored at −80°C. The Total cell count was obtained using a Neubauer haemocytometer (Fisher Scientific, Loughborough, UK) and cell viability was assessed by the trypan blue exclusion method. The cell suspension was adjusted to 0.5×10⁶ cells/mL and a 75 μL cell suspension was used to prepare cytospins at 450 r.p.m. for 6 min using a Shandon III cytocentrifuge (Shandon Southern Instruments, Sewickley, PA, USA). Cytospins were stained with the Diff Quick stain (Dade, Behring, Switzerland) and coded by a third party.
At least 200 cells were counted at low power (×40) in order to categorize squamous cells, bronchial or nasal ciliated epithelial cells and leucocytes, which were expressed as a percentage. Then where possible, at least 300 leucocytes were counted at high power (×100) in order to determine sputum and NLF leucocyte differentials. NLF leukocyte differentials were multiplied by the total cell count and adjusted for the dilution effect of the nasal wash by ‘inulin‐dilution’ [19]. This gave concentrations of cells per millilitre of nasal secretions. Supernatants were stored at –80°C.
Biochemical assays
IL‐8, IL‐5 and IFN‐γ were measured by enzyme immunoassay (OptEIA kits, PharMingen, San Diego, CA, USA) and ECP was measured by fluoroenzyme assay (UniCAP system, Pharmacia, Uppsala, Sweden) according to the manufacturer's instructions. The sensitivities of these tests were, respectively, 1, 2 and 4 pg/mL. Levels below the level of detection of ELISA assays were designated as half the lower level of detection for all data analyses. DTT, which was used as a mucolytic during sample processing, did not significantly interfere with the enzyme immunoassays as demonstrated by a comparison of assays of recombinant cytokines with and without the addition of DTT. The samples with added DTT resulted in a > 90% recovery of proteins compared with the samples without DTT. Inulin was measured by a method adapted for nasal secretions [19]. Cytokines were expressed per millilitre of sputum or of nasal secretion.
Analysis
The main outcomes were the leucocyte total and differential counts and soluble mediator concentrations. The sputum eosinophil and lymphocyte counts and all NLF cell counts were not normally distributed. Log10 transformation normalized the sputum eosinophils and lymphocytes prior to analysis at baseline. Baseline comparisons of sputum differential counts between groups were analysed by Student's unpaired t‐test. Baseline comparisons between groups of NLF cell counts and all soluble mediators were analysed by the Mann–Whitney U‐test. The changes from baseline of sputum differential counts and sputum and NLF IL‐8 concentrations on days 2, 4 and 17 were all normally distributed and analysed using a repeated measures manova analysis. The technique allows investigation of changes over time within each group (‘time effect’), differences between groups (‘group effect’) and differences in the effect of time between group (‘time–group interaction’). Other soluble mediators (IFN‐γ and ECP) and the neutrophil cell count in NLF were markedly skewed and were therefore analysed using the Mann–Whitney U‐test.
The relationship between change in neutrophils and IL‐8 was assessed by Pearson's correlation for the LRT and Spearman's rank correlation for the URT. Changes in neutrophils and IL‐8 on days 2 and 4 were also compared to changes in log2 PC20 methacholine and symptom scores on days 2 and 4 (taken from data reported previously [4]) by Pearson's correlation and Spearman's rank correlation according to data distribution.
Results
The subject characteristics and the clinical and physiological response to infection have been reported previously [4]. There were more females in the EVW group than the control group (18/24 and 7/19, respectively) and more atopics (15/24 and 7/19, respectively), but ages were similar (mean age (SD)=28 (5) and 24 (5) years, respectively). Despite the EVW group having lower baseline FEV1 and PEF, there was no difference in airway responsiveness at baseline [4]. Eight subjects had allergic rhinitis, four in each group. One EVW subject failed to attend on day 2 but other data were included.
Nineteen out of the 24 EVW subjects and 11 out of 19 controls developed symptomatic colds. Sixteen of the 19 EVW subjects and all 11 of the controls with symptomatic colds had laboratory evidence of HCoV 229E infection [4]. Only those with laboratory evidence of virus infection were included in the analysis of inflammation. None had evidence of coincidental ‘wild‐type’ infections (rhinovirus, adenovirus, influenza virus A and B, RSV, and parainfluenza viruses 1, 2, and 3) determined by culture of nose and throat swabs taken during the first week of the study. However, the symptom diary suggested that nine ‘wild’ colds occurred in the latter half of the study, hence day 17 data from these subjects were excluded. Sixteen of the 19 EVW subjects with symptomatic colds developed LRT symptoms (wheeze, shortness of breath, or chest tightness). No controls developed LRT symptoms. The EVW subjects had only minor (−3 to −4%) reductions in FEV1 and PEF on days with LRT symptoms, but a progressive reduction in log2 PC20 from 5.1 (1.9) g/L baseline to 2.8 (1.2) g/L 17 days after inoculation affecting both atopic and non‐atopic subjects equally (see reference [4] for detailed physiology results). There were no such changes in controls with or without colds.
Quality of samples
Sputum cell counts were not available on 26 occasions out of a possible 172 for the following reasons: failure to expectorate a sample (9), non‐attendance (2), less than 300 leucocytes counted on cytospin (6), and samples excluded on day 17 due to intercurrent ‘wild’ infections (9). Nasal lavage data were not obtained on 12 occasions out of a possible 172 for the following reasons: nasal sporting injury (1), non‐attendance (2), and samples excluded on day 17 due to ‘wild’ infections (9).
The vast majority of nasal lavage samples obtained throughout the study produced return volumes of greater than 5 mL (50%). On day 4, during the symptomatic phase of the illness, the volume of NLF returned (mean (95% CI)) was 7.4 mL (6.8, 8.0). The inulin‐adjusted volume (mean (95% CI)) was 4.4 mL (3.6, 5.2). Viability of cells was generally good in those with colds in both nasal samples (range 63–80%) and sputum samples (range 62–70%). Finally, squamous contamination was generally <20% (median 8.7%) in sputum samples but was greater in nasal samples (median 21%).
Leucocyte counts/differentials
Nasal samples
Median values for all cell types in NLF were zero in all subject groups at baseline, with no significant differences between groups. Small increases in total leucocyte cell count were seen in both groups with colds (Table 1a), with the largest change from baseline seen on days 2 and 4 in the larger EVW group. There was a small increase in nasal lavage neutrophil counts in both groups with colds during the study but no significant difference between the two groups (Table 1b). Neutrophils predominated in NLF with very few other cells throughout the study. There was a significant correlation between the change in NLF neutrophils and URT symptom scores on day 2 (r s=0.43, P=0.043) that was not seen on day 4 (r s=0.27, P=0.18). There was no difference between atopic (n=9) and non‐atopic (n=7) subjects in the EVW group with colds in change in neutrophil counts from baseline on day 4 (median change (quartiles)=3.9 (0.0–13.6) and 3.1 (0.0–11.1)×104/mL, respectively, P=0.78). Nor was there a significant change in eosinophils in either atopic or non‐atopic subjects with colds in the EVW group (median change (quartiles) from baseline on day 4=0.0 (0.0, 0.9) and 0.0 (0.0, 0.7)×104/mL, respectively).
Table 1.
| Study day | EVW cold | Control cold |
|---|---|---|
| (a) Nasal total leucocyte counts; values are median (lower and upper quartile),×105/mL | ||
| 0 | 0.0 (0.0, 5.5) | 0.0 (0.0, 4.8) |
| 2 | 11.9 (0.0, 28.5) * | 0.0 (0.0, 4.6) |
| 4 | 5.9 (0.0, 19.2) ** | 6.5 (0.0, 9.0) |
| 17 | 6.9 (0.8,12.9) | 0.0 (0.0, 0.8) |
| (b) Change from baseline in neutrophil counts in nasal lavage in subjects with colds; values are median difference (inter‐quartile range)×104/mL | ||
| 2 | 5.4 (0.0,11.0) | 0.0 (−1.1, 2.2) |
| 4 | 2.6 (0.0,7.9) | 1.8 (−1.3, 9.7) |
| 17 | 0.7 (−2.5, 11.0) | 0.0 (−1.4, 0.4) |
EVW=exclusive viral wheezers; number of observations on days 2, 4 and 17, respectively: viral wheezers 16, 16, 13; controls 9, 9, 6. No differences between EVW and controls were significant (Mann–Whitney U‐test). Difference from baseline:
P=0.026,
P=0.027.
Sputum samples
Small increases in total leucocyte cell count were seen in both groups with colds (Table 2). No such changes were seen in subjects without symptomatic colds. No difference was seen between groups in baseline cell differential counts (Table 3a). A significant increase in the proportion of sputum neutrophils was seen in the EVW group with colds between days 0 and 4, returning towards baseline by day 17 (P=0.023), with a reciprocal effect in the proportion of macrophages (P=0.013) (Table 3b and Fig. 1). There was no such effect in the control group with colds and the difference between groups was significant (P=0.009). No differences were seen in sputum lymphocytes or eosinophils during the study. Indeed, very low numbers of these cells were present.
Table 2.
Sputum total leucocyte counts values are median (lower and upper quartile)×105/mL.
| Study day | EVW cold | Control cold |
|---|---|---|
| 0 | 6.7 (4.0,13.7) | 7.7 (3.9,29.1) |
| 2 | 17.5 (4.3,19.1) * | 5.2 (2.1,13.1) |
| 4 | 11.0 (4.4,19.9) | 10.4 (5.3,13.3) |
| 17 | 9.2 (5.1,21.0) | 5.4 (3.6,17.7) |
EVW=exclusive viral wheezers; change from baseline:
P=0.059; number of observations on days 2, 4 and 17, respectively: viral wheezers 16, 16, 13; controls 9, 9, 6. No differences between EVW and controls were significant (Mann–Whitney U‐test).
Table 3.
| (a) Baseline sputum cell differentials (% total leucocytes) values are mean* or †geometric mean (95% CI) percentage points Sputum | |||
|---|---|---|---|
| EVW | Controls | P | |
| Monocytes/macrophages* | 70.3 (±9.0) | 66.0 (±7.6) | 0.24 |
| Neutrophils* | 27.2 (±8.8) | 31.3 (±8.0) | 0.51 |
| Lymphocytes† | 1.2 (0.8, 1.9) | 1.0 (0.6, 1.6) | 0.93 |
| Eosinophils† | 2.5 (1.1, 7.9) | 1.5 (0.8, 3.2) | 0.46 |
| (b) Change from baseline in leucocyte differential counts in sputum in subjects with colds; values are mean difference (95% CI) percentage points | |||||
|---|---|---|---|---|---|
| Cell type | Study day | EVW cold | Control cold | Multivariate analysis P‐values | |
| G | T | ||||
| Macrophages | 2 | −13.0 (−22.7, −3.2) | 12.2 (−17.0, 41.4) | ||
| 4 | −25.7 (−37.3, −14.1) | 4.5 (−16.7, 25.7) | 0.005 | 0.013 | |
| 17 | −4.4 (−19.5, 10.8) | 10.4 (1.0, 19.7) | |||
| Neutrophils | 2 | 12.2 (2.7, 21.8) | −1.8 (−16.5, 13.0) | ||
| 4 | 20.4 (9.6, 31.1) | 3.1 (−8.2, 14.5) | 0.009 | 0.023 | |
| 17 | 2.3 (−12.8, 17.4) | −9.3 (−18.3,−0.2) | |||
| Lymphocytes | 2 | 0.1 (−1.1, 1.3) | −0.1 (−1.9, 1.8) | ||
| 4 | 0.3 (−0.7, 1.2) | 0.2 (−1.3, 1.6) | 0.76 | 0.25 | |
| 17 | 1.8 (0.1, 3.6) | −0.8 (−2.8, 1.3) | |||
| Eosinophils | 2 | 0.7 (−0.4, 1.7) | −1.7 (−4.4, 1.0) | Analysis not performed | |
| 4 | −0.2 (−1.4, 1.0) | −1.5 (−4.7, 1.7) | |||
| 17 | 0.2 (−0.7, 1.2) | −0.2 (1.8, 1.4) | |||
EVW=exclusive viral wheezers. Number of observations on days 2, 4 and 17, respectively: viral wheezers 13, 15, 13; controls 8, 11, 5. T – time effect; G – group effect; there was no significant time–group interaction.
Figure 1.
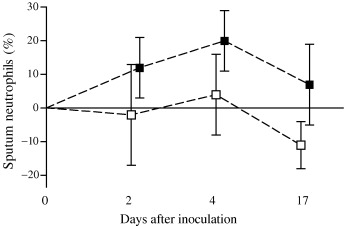
Sputum: difference from baseline in mean (95% CI) neutrophil differential count (%) in viral wheezers (▪) and controls (□) with colds during the study.
The relationship between the change in neutrophils and change in symptom scores on day 4 (the day with maximal changes in neutrophils) was explored and there no significant correlation (r s=0.10, P=0.81) was found. However, there was a significant correlation between the change in sputum neutrophils and the total LRT symptom scores over the whole study period (r s=0.39, P=0.01).
Soluble mediators
At baseline there was no significant difference between the EVW and control groups in any measure from the URT or LRT. There was no significant difference in baseline ECP between atopic (n=10) and non‐atopic (n=7) subjects with EVW in either the URT (median (quartiles) 9.0 (6.2, 13.8) and 11.7 (0.0, 32.6) pg/mL of nasal secretions, respectively, P=0.49) or LRT (median (quartiles) 14.0 (4.6, 84.9) and 0.5 (0.0, 51.2) pg/mL of sputum supernatant, respectively, P=0.43). There were no significant changes during the study in any mediators in the NLF or sputum of the controls without colds (n=8). Data are therefore presented only from those with symptomatic colds.
Nasal samples
The subjects with EVW and colds had a trend towards an increase in nasal IL‐8 on day 4 returning towards baseline on day 17, which was not seen in the controls (Fig. 2). There was no significant difference between atopic and non‐atopic subjects with colds in change in IL‐8 on day 4 (mean difference (95% CI) 948 (452, 1444) and 554 (240, 868) pg/mL, respectively, P=0.36), although atopic subjects tended to have higher values. More than 25% of all subjects with colds had NLF IFN‐γ concentrations below the levels of detection. Although levels increased in some subjects during colds, the increases were modest with no significant difference between the groups. There was no overall change in nasal ECP, although a few subjects in both groups had modest increases on day 4. Subgroup analysis of atopic and non‐atopic EVW subjects with colds on day 4 also showed no significant difference (median (quartiles) 11.2 (0, 91.5) and 11.0 (0, 25.9) pg/mL P=0.22, respectively). IL‐5 was below the assay sensitivity (2 pg/mL) for the majority of subjects in both groups at all time‐points.
Figure 2.
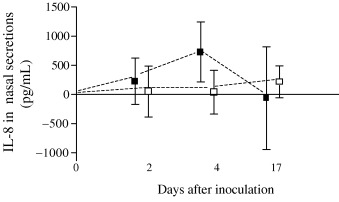
Nasal lavage: difference from baseline in mean (95% CI) IL‐8 (pg/mL) from in viral wheezers (▪) and control subjects (□). Multivariate analysis P‐values: Time P=0.49, Group P=0.20, Time–Group interaction P=0.45.
There was no significant correlation between change in IL‐8 concentration and URT symptom scores on days 2 and 4 (r s=0.23 (P=0.21) and 0.21 (P=0.21), respectively). However, the change in IL‐8 concentration on day 4 was significantly correlated to the total URT score over the whole study period (r s=0.37, P=0.045). A weak but significant correlation was found between the changes in IL‐8 and neutrophils from baseline on day 4 (r s=0.3, P=0.006). There was thus a significant interrelationship between URT symptoms, neutrophil count, and IL‐8 during the illness.
Sputum samples
In those with colds, a significant increase in sputum IL‐8 was seen in the EVW group on days 2 and 4 returning towards baseline on day 17 (Table 4 and Fig. 3). This pattern was not seen in the controls and there was a significant difference between the groups (Table 4). More than 25% of all subjects with colds had IFN‐γ below the levels of detection, and although some with colds had an increase, this was modest with no significant difference between the groups. There were no significant changes in sputum ECP in either group and subgroup analysis of atopic EVW subjects with colds also showed no significant change from baseline (median (quartile) ECP at day 0 and 4, 7.7 (0.0, 10.9) and 10.5 (0.0, 12.3) pg/mL, respectively, P=0.59). Again, the majority of samples had levels of IL‐5 below the level of detection of the assay.
Table 4.
Change from baseline in IL‐8 in nasal lavage and sputum samples in subjects with colds; values are mean difference (95% CI)
| Study day | EVW colds | Control colds | Multivariate analysis P‐values | ||
|---|---|---|---|---|---|
| G | T | ||||
| Nasal lavage fluid (corrected) (pg/mL) | |||||
| 2 | 229 (−169 to 626) | 50 (−386 to 486) | |||
| 4 | 730 (215 to 1244) | 41 (−333 to 416) | 0.20 | 0.49 | |
| 17 | −63 (−945 to 819) | 217 (−57 to 490) | |||
| IL‐8 sputum (pg/mL) | |||||
| 2 | 1.98 (0.63 to 3.33) | −0.13 (−1.50 to 1.24) | |||
| 4 | 2.50 (0.55 to 4.46) | 1.47 (−0.18 to 3.11) | 0.019 | 0.002 | |
| 17 | −0.27 (−1.64 to 1.10) | −2.15 (−5.50 to 1.20) | |||
See Table 3.
Figure 3.
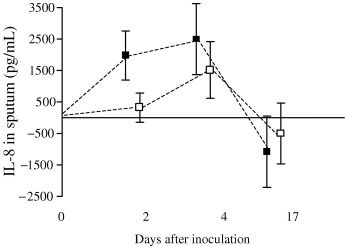
Sputum: difference from baseline in mean (95% CI) IL‐8 (pg/mL) during the study in viral wheezers (▪) and control subjects (□). Multivariate analysis P‐values: Time P=0.002, Group P=0.019, Time–Group interaction P=0.81.
Change in sputum IL‐8 concentration from baseline on day 4 post‐inoculation was weakly correlated to LRT neutrophil differential count (r s=0.27, P=0.013) but not to LRT symptom score on day 4 (r s=−0.01, P=0.94) or to the total LRT symptom score (r s=0.08, P=0.63).
Discussion
It is increasingly being recognized that within the ‘asthma syndrome’, especially in young children, there are phenotypes that are independent of atopy and airway hyper‐responsiveness. Von Mutius [21] has recently put forward the idea that there is a component of the ‘asthma syndrome’ that is not related to atopy, speculation in keeping with some of our own observations [22], questioning the very core of recent understanding of the pathophysiology of asthma. We have established an adult model of viral wheeze in individuals without the typical allergic asthma phenotype, in order to study the inflammatory characteristics of this particular phenotype. In conjunction with our report of the physiological changes in the model of EVW [4], this study provides firm evidence for the phenotype of EVW, as distinct from classical atopic asthma, and strongly implicates the neutrophil in the process.
No qualitative or quantitative differences were demonstrated between asymptomatic subjects with EVW and controls at baseline. However, qualitative and quantitative differences between subjects with EVW and controls were found in inflammation in both upper and lower respiratory tracts during symptomatic colds. Subjects with EVW had significant relative neutrophilia in sputum not seen in controls. This was associated with higher concentrations of IL‐8 in sputum during symptomatic colds. This neutrophilia was associated with the LRT symptoms as previously reported [4]. Both groups had evidence of increased leucocytes in the upper and lower respiratory tracts during colds, although the small number of controls makes quantitative comparisons insensitive. Some similarities in inflammatory response in the URT and LRT were observed. Neutrophils seemed to be key cells in both sites for the EVW group, whereas eosinophils and their products were not.
This is the first time that upper and lower respiratory tract inflammation has been studied during an experimental infection with HCoV and the first time an association between elevated nasal IL‐8 levels and an HCoV common cold has been shown. This confirms similar findings for HRV [11] and wild infections [14]. We have also established an association between symptoms and neutrophilic inflammation in both the upper and lower respiratory tracts. There was no evidence supporting the involvement of a TH2‐associated process (IL‐5, eosinophilic recruitment or eosinophilic activation).
Stevenson et al. [2] studied opportunistically collected BAL fluid from young children with a history of EVW and found no evidence of chronic inflammation during asymptomatic periods, in contrast to atopic asthmatics who had increased eosinophil and mast cell differential counts. We have confirmed that in asymptomatic intervals, EVW is not characterized by chronic inflammation in the LRT. We have also demonstrated that eosinophils are not involved in the acute illness, as appears to be the case in either natural viral exacerbations [5, 6] or experimental infections in atopic asthmatics [7, 8].
Although experimental infections have the advantages of homogeneous subject selection, timing of inoculation and use of a single virus strain, interpretation should take into account design or technical aspects of methodology.
Methodological issues
Design
Experimental infection with a laboratory strain of virus differs in several respects to a wild infection. The ability of a cultured virus to trigger LRT symptoms may well be affected by attenuation as well as some unknown virus‐specific factors, although this did not prove to be the case here or in previous studies [18, 23]. The dose and route of inoculation are clearly different from the wild situation. This is of minor importance in the present study which is, in effect, a proof of the principle that EVW is a distinct disorder.
All volunteers were inoculated with active virus. It is possible that some may have had asymptomatic infection [4] or responded to mediators in the suspension medium. Any inflammatory response to asymptomatic infection would act to minimize the difference between the symptomatic and asymptomatic groups but should not affect differences between viral wheezers and controls with clinical colds. A ‘sham‐infected’ group would be required to exclude such interference. Recently published data from our group suggest that active virus can produce an asymptomatic pathogenic effect on the URT epithelium but that the medium (containing ultraviolet treated and hence inactivated virus) has no pathogenic effect [24].
The two groups were identical in many characteristics, although there were more atopics in the viral wheeze group. Atopy is thought to predispose an individual to a more severe URT illness during experimental HRV infection [25] and in our study could have been a confounding factor. However, we did not find atopy to be a factor in the development of URT symptoms, hyper‐responsiveness [1] or nasal neutrophil response in this model, although numbers were small (nine and seven atopics and non‐atopics, respectively, in the viral wheeze group with colds). Allergic rhinitis is also known to predispose subjects to more severe URT symptoms [25, 26], but there were only four subjects with a history of allergic rhinitis in each group, so this is unlikely to account for the inflammatory response seen.
Technical
Repeated sputum inductions 24 h apart using high doses of hypertonic saline (51 mL at 1.7 mL/min) cause the concentration of ECP and the neutrophil count to increase by approximately 10–12% [27]. Pavord [28] has reviewed this problem and suggested that the effect may be related to the dose of hypertonic saline used. The present study used less than half this amount of hypertonic saline given at a rate of 0.9 mL/min and no changes in neutrophils were seen in the sputum of controls, with or without colds, despite repeated inductions 48 h apart. Repeated nasal lavages could ‘wash out’ or conversely recruit cells to the nasal epithelium. Again, in a repeated study of subjects without colds there was good agreement between cell counts in repeat NLF at 2‐ or 3‐day intervals (intraclass correlation coefficients 0.75 and 0.84, respectively). The slightly poorer repeatability at 2 days was suggested to be an effect of cell recruitment or wash‐out [29]. Recruitment was not a problem in the current study as asymptomatic controls had very few cells in NLF at any stage. A minor wash‐out effect would diminish real differences between groups.
Recent studies have demonstrated that the addition of protease inhibitors markedly enhances the recovery of cytokines, in particular IL‐5, from sputum [30]. This could be one reason why we found undetectable levels of IL‐5.
Pathogenesis of LRT features
Many factors are believed to be important in the pathogenesis of EVW. Exacerbations of wheeze are associated with any one of a wide range of infecting viral strains suggesting that host response factors rather than virus specificity are predominant. Either heightened or abnormal inflammatory response to a virus infection or an undue physiological response to ‘normal’ inflammation (a form of bronchial hyper‐responsiveness) could be central to the abnormal wheezing response.
The clear evidence of relative neutrophilia in the LRT along with the elevation of IL‐8 in the EVW group has also been demonstrated in two studies of ‘wild’ type virus exacerbations of atopic asthma [5, 6]. The latter also found eosinophilia and increased ECP in the LRT. The very low levels of eosinophils and ECP in the present study suggest that eosinophils are not important in EVW. Nor was there a difference in the cellular or physiological [4] responses of atopic and non‐atopic subjects with EVW. Mechanisms other than atopy and eosinophilic inflammation must be involved in EVW.
Adults with EVW suffer URT symptoms similar to healthy controls, although in our study there was a trend towards more severe symptoms [4] and a greater degree of neutro‐philic nasal inflammation, but LRT neutrophilia appears to be specific to the EVW subjects. Traditionally it has been proposed that neutrophils limit the damage caused by viral respiratory tract infection, although they may also cause tissue damage through the release of cytotoxic granule‐derived proteins such as elastase and myeloperoxidase, free radicals and lipid‐derived mediators such as LTB4. If neutrophils do cause LRT tissue damage in those who wheeze, then clearly these cells could be involved in the pathogenesis of EVW. No other study of viral URTI, with the exception of respiratory syncytial virus (RSV) bronchiolitis [31], has found a direct relationship between the LRT neutrophil cell differential count and LRT symptoms.
It seems likely that other factors are also involved in EVW. It has been suggested that a cascade of different mechanisms, such as the recruitment and activation of lymphocytes, release of other pro‐inflammatory cytokines and chemokines, airway remodelling and alterations in neural responses combine to produce the changes in airway physiology that we have demonstrated. There is increasing evidence that common respiratory viruses can directly infect the LRET [32, 33, 34], which might directly influence these mechanisms. If inflammation is important to this illness, then the search for potential therapeutic interventions should focus on the stimulus to and the mechanisms of LRT cell recruitment and their role in symptom production.
The possibility that indirect mechanisms could link the URT to the LRT remains. Several potential links exist. Nasal provocation with cold air has been shown to produce increased airway resistance not seen when the stimulus was delivered to the mouth of asthmatics, suggesting the presence of a nasobronchial neural reflex [35]. The nose also plays an important protective role for the LRT, not only by conditioning and filtering inspired air, but also by its ability to generate an immune response. The possibility of a nasal immune response, such as T cell activation, having LRT effects via circulating cells and mediators needs to be explored. All these mechanisms require some host factor(s) that discriminates between healthy and wheezy subjects and is independent of atopy.
Conclusions
We report the role of inflammation in the URT and LRT during an experimental HCoV infection of adults with a history of EVW. We have demonstrated modest neutrophilic inflammation in the LRT of EVW subjects but no evidence of eosinophil accumulation or activation. Neutrophils are likely to be involved in the mechanisms that lead to EVW. The basis for their excessive accumulation in EVW should be sought.
Acknowledgements
We thank Professor A. Wardlaw and Dr J. Grigg (members of the Institute of Lung Health, Leicester) and Dr H. Pringle (Department of Pathology, Leicester University) for their advice, and Ms M. Leech, Mrs S. Euden, and Mr R. Ward for their technical assistance. This project was supported by the National Asthma Campaign (UK), Glaxo‐Smith‐Kline (UK), and Merck Sharpe and Dohme (UK).
References
- 1. Martinez FD, Wright AL, Taussig LM et al Asthma and wheezing in the first six years of life. N Engl J M 1995; 332: 133–8. [DOI] [PubMed] [Google Scholar]
- 2. Stevenson EC, Turner G, Heaney LG et al Bronchoalveolar lavage findings suggest two different forms of childhood asthma. Clin Exp Allergy 1997; 27: 1027–35. [DOI] [PubMed] [Google Scholar]
- 3. Godden DJ, Ross S, Abdalla M et al Outcome of wheeze in childhood. Symptoms and pulmonary function 25 years later. Am J Respir Crit Care Med 1994; 149: 106–12. [DOI] [PubMed] [Google Scholar]
- 4. Mckean MC, Leech M, Lambert PL, Hewitt C, Myint S, Silverman M. A model of viral wheeze in non‐asthmatic adults: symptoms and physiology. Europ Respir J 2001; 18: 23–32. [DOI] [PubMed] [Google Scholar]
- 5. Fahy JV, Kwong Woo Kim, Liu J, Boushey HA Respiratory pathophysiologic responses: Prominent neutrophilic inflammation in sputum from subjects with asthma exacerbation. J Allergy Clin Immunol 1995; 95: 843–52. [DOI] [PubMed] [Google Scholar]
- 6. Pizzichini MMM, Pizzichini E, Efthimiadis A et al Asthma and natural colds‐ Inflammatory indices in induced sputum: A feasibility study. Am J Respir Crit Care Med 1998; 158: 1178–1184. [DOI] [PubMed] [Google Scholar]
- 7. Fraenkel DJ, Bardin PG, Sanderson G, Lampe F, Johnston SL, Holgate ST. Lower airways inflammation during rhinovirus colds in normal and in asthmatic subjects. Europ Arch Oto-Rhino-Laryngol 1995; 151S: 879–86. [DOI] [PubMed] [Google Scholar]
- 8. Grunberg K, Smits HH, Timmers MC. et al Experimental rhinovirus 16 infection: Effects on cell differentials and soluble markers in sputum in asthmatic subjects. Am J Respir Crit Care Med 1997; 156: 609–16. [DOI] [PubMed] [Google Scholar]
- 9. Fleming HE, Little FF, Schnurr D et al Rhinovirus‐16 colds in healthy and in asthmatic subjects: Similar changes in upper and lower airways. Am J Respir Crit Care Med 1999; 160: 100–8. [DOI] [PubMed] [Google Scholar]
- 10. Grunberg K, Sharon RF, Sont JK et al Rhinovirus‐induced airway inflammation in asthma: effect of treatment with inhaled corticosteroids before and during experimental infection. Am J Respir Crit Care Med 2001; 15;164: 1816–22. [DOI] [PubMed] [Google Scholar]
- 11. Turner RB. The role of neutrophils in the pathogenesis of rhinovirus infections. Ped Infectious Dis J 1990; 9: 832–5. [DOI] [PubMed] [Google Scholar]
- 12. Noah TL, Henderson FW, Wortman IA et al Nasal cytokine production in viral acute upper respiratory infection of childhood. J Infect Dis 1995; 171: 584–92. [DOI] [PubMed] [Google Scholar]
- 13. Noah TL, Henderson FW, Henry MM, Peden DB, Devlin RB. Nasal lavage cytokines in normal, allergic, and asthmatic school‐age children. Am J Respir Crit Care Med 1995; 152: 1290–6. [DOI] [PubMed] [Google Scholar]
- 14. Teran LM, Johnston SL, Schroder J, Church MK, Holgate ST. Role of nasal interleukin‐8 in neutrophil recruitment and activation in children with virus‐induced asthma. Am J Respir Crit Care Med 1997; 155: 1362–6. [DOI] [PubMed] [Google Scholar]
- 15. Greiff L, Andersson M, Svensson C, Linden M, Myint S, Persson CGA. Allergen challenge‐induced acute exudation of IL‐8, ECP and alpha2‐ macroglobulin in human rhinovirus‐induced common colds. Europ Respir J 1999; 13: 41–7. [DOI] [PMC free article] [PubMed] [Google Scholar]
- 16. Johnston SL, Pattemore PK, Sanderson G et al Community study of role of viral infections in exacerbations of asthma in 9‐11 year old children. BMJ 1995; 310: 1225–9. [DOI] [PMC free article] [PubMed] [Google Scholar]
- 17. McIntosh K, Chao RK, Krause HE, Wasil R, Mocega HE, Mufson MA. Coronavirus infection in acute lower respiratory tract disease of infants. J Infect Dis 1974; 130: 502–7. [DOI] [PMC free article] [PubMed] [Google Scholar]
- 18. Siddell S, Myint S Coronaviruses In: Myint S, Taylor‐Robinsob D, eds. Viral and other infections of the human respiratory tract. London: Chapman & Hall, 1996. [Google Scholar]
- 19. Balfour‐Lynn IM, Valman B, Silverman M, Webster ADB. Nasal IgA response in wheezy infants. Arch Dis Child 1993; 68: 472–6. [DOI] [PMC free article] [PubMed] [Google Scholar]
- 20. Pizzichini E, Pizzichini MMM, Efthimiadis A et al Indices of airway inflammation in induced sputum: Reproducibility and validity of cell and fluid-phase measurements. Am J Respir Crit Care Med 1996; 154: 308–317. [DOI] [PubMed] [Google Scholar]
- 21. Von Mutius E. Is asthma really linked to atopy? Clin Exp Allergy 2001; 31: 1651–2. [DOI] [PubMed] [Google Scholar]
- 22. Kuehni C.E., Davis A., Brooke A.M., Silverman M. Are all wheezing disorders in very young (preschool) children increasing in prevalence? Lancet 2001; 357: 1821–5. [DOI] [PubMed] [Google Scholar]
- 23. Myint S, Siddell S, Tyrrell D. Detection of human coronavirus 229E in nasal washings using RNA: RNA hybridisation. J Med Virol 1989; 29: 70–3. [DOI] [PMC free article] [PubMed] [Google Scholar]
- 24. Chilvers MA, Mckean MC, Rutman A, Myint S, Silverman M, O'Callaghan C. The effects of coronavirus on human nasal ciliated respiratory epithelium. Europ Respir J 2001; 18: 965–70. [DOI] [PubMed] [Google Scholar]
- 25. Bardin PG, Fraenkel DJ, Sanderson G, Dorward M, Lau LC, Johnston SL et al Amplified rhinovirus colds in atopic subjects. Clin Exp Allergy 1994; 24: 457–64. [DOI] [PMC free article] [PubMed] [Google Scholar]
- 26. Callow KA, Tyrrell DA, Shaw RJ, Fitzharris P, Wardlaw AJ, Kay AB. Influence of atopy on the clinical manifestations of coronavirus infection in adult volunteers. Clin Exp Allergy 1988; 18: 119–29. [DOI] [PMC free article] [PubMed] [Google Scholar]
- 27. Holz O, Richter K, Jorres RA, Speckin P, Mucke M, Magnussen H. Changes in sputum composition between two inductions performed on consecutive days. Thorax 1998; 53: 83–6. [DOI] [PMC free article] [PubMed] [Google Scholar]
- 28. Pavord ID. Sputum induction to assess airway inflammation: is it an inflammatory stimulus? Thorax 1998; 53: 79–80. [DOI] [PMC free article] [PubMed] [Google Scholar]
- 29. Simpson JL, Gibson PG, Ward PA. Optimisation of sputum‐processing methods for the measurement of interleukin‐5: effects of protease inhibition. Respirology 2002; 7: 111–6. [DOI] [PubMed] [Google Scholar]
- 30. Hauser R, Garcia‐Closas M, Kelsey KT, Christiani DC. Variability of nasal lavage polymorphonuclear leukocyte counts in unexposed subjects: its potential utility for epidemiology. Arch Environ Health 1994; 49: 267–72. [DOI] [PubMed] [Google Scholar]
- 31. Everard ML, Swarbrick A, Wrightham M, McIntyre J, Dunkley C, James PD et al Analysis of cells obtained by bronchial lavage of infants with respiratory syncytial virus infection. Arch Dis Child 1994; 71: 428–32. [DOI] [PMC free article] [PubMed] [Google Scholar]
- 32. Gern JE, Galagan DM, Jarjour NN, Dick EC, Busse WW. Detection of rhinovirus RNA in lower airway cells during experimentally induced infection. Am J Respir Crit Care Med 1997; 155: 1159–61. [DOI] [PubMed] [Google Scholar]
- 33. Papadopoulos NG, Sanderson G, Hunter J, Johnston SL. Rhinoviruses replicate effectively at lower airway temperatures. J Med Virol 1999; 58: 100–4. [DOI] [PubMed] [Google Scholar]
- 34. Papadopoulos NG, Bates PJ, Bardin PG et al Rhinoviruses infect the lower airways. J.Inf Dis 2000; 181: 1875–84. [DOI] [PubMed] [Google Scholar]
- 35. Fontanari P, Zattara‐Hartmann M, Burnet H, Jammes Y. Nasal eupnoeic inhalation of cold, dry air increases airway resistance in asthmatic patients. Europ Respir J 1997; 10: 2250–4. [DOI] [PubMed] [Google Scholar]