

A coherent control strategy for super-resolution nanoscopy achieves resolution <50 nm in wide-field imaging.
Abstract
Super-resolution nanoscopy based on wide-field microscopic imaging provided high efficiency but limited resolution. Here, we demonstrate a general strategy to push its resolution down to ~50 nm, which is close to the range of single molecular localization microscopy, without sacrificing the wide-field imaging advantage. It is done by actively and simultaneously modulating the characteristic emission of each individual emitter at high density. This method is based on the principle of excited state coherent control on single-particle two-photon fluorescence. In addition, the modulation efficiently suppresses the noise for imaging. The capability of the method is verified both in simulation and in experiments on ZnCdS quantum dot–labeled films and COS7 cells. The principle of coherent control is generally applicable to single-multiphoton imaging and various probes.
INTRODUCTION
Super-resolution imaging techniques now are powerful tools for optical nanoscopic studies, especially for biological science. According to the imaging acquisition process, the techniques can be classified into two groups. Single-molecular localization microscopies (SMLMs) are diffraction-unlimited and well developed for high spatial resolution, such as stimulated emission depletion (STED) (1, 2), photoactivated localization microscopy (PALM) (3, 4), and stochastic optical reconstruction microscopy (STORM) (5). They provide high spatial resolution of a few tens of nanometers, and may go down to 1 nm (6), but suffer from the slow data acquisition. There are also methods of high acquisition efficiency since they are based on wide-field microscopic imaging, such as structured illumination microscopy (SIM) (7, 8), super-resolution optical fluctuation imaging (SOFI) (9), super-resolution radial fluctuations (SRRFs) (10), and super-resolution by polarization demodulation (SPoD) (11, 12), among others. However, their major weakness is the low spatial resolution at the ~100-nm scale. In this field, the combination of high spatial resolution and high acquisition efficiency awaits further effort.
In wide-field imaging nanoscopy, the distinguished fluorescence characteristics of an emitter identifies itself from surrounding emitters and background pattern, so that its accurate location beyond the optical diffraction limit can be resolved. For example, for SOFI, the spontaneous blinking of a single molecule is critical to tell its position (9). For SRRF, it measures local radial symmetries in the image. By calculating the convergence degree of these vectors at the original central subpixels, the position of the emitter can be determined (10). For SPoD, the response to polarized excitation isolates the emitter to its neighbors (11, 12). However, their resolutions are still limited because of limited variance between adjacent emitters and/or between the emitter and background noise. To manipulate the fluorescent emission to amplify the variance, the coherent control method, which uses femtosecond pulse shaping technique, can be proposed (13, 14). Pulse shaping is used to tailor the light field of a femtosecond pulse in temporal domain, for its amplitude, spectra, phase, and polarization. The principle of coherent control is based on the complexity of potential energy surface and rich splitting levels of excited states due to vibration, rotation, etc., which are also influenced by their local environment. With excitation, the initial wave packet comes from the coherence of the excited states. Coherent control is used to manipulate the coherence of these states by the shaped pulse (SP) to control the product of photoexcitation, such as the fluorescent emission in this study. Coherent control is broadly applied in the field of ultrafast spectroscopy (15, 16). It can be regarded as a previously unidentified controlling dimension to intentionally influence the excitation behavior of biological and chemical molecular and nanoscopic systems. It had been widely tested, that is, from chemical reaction, fluorescent emission, electron transfer, molecular vibration, Raman spectroscopy, to isomerization, etc. (17–23), such as for regulating energy flow among competing pathways in a light-harvesting complex (19, 24), enhancing or suppressing the retinal isomerization in bacteriorhodopsin to 20% (20), and controlling the photophysical behavior of the green fluorescent protein in a multiphoton process (25). This principle had been extended to studies on single molecules, since the “identical” molecules or nanoparticles could be distinctly different from a microscopic point of view. For example, with the broadband femtosecond pulses covering all vibrational sidebands in transition, the emission from highly photostable dinaphtoquaterrylenebis(dicarboximide) single molecules presented individual fluorescent emission properties under identical shaped excitation pulses (26). This technique was also applied to individual light-harvesting complex 2 to control electron transfer (27). For the protein probe blue fluorescent protein, a pulse-shaping technique achieves 1.5 times the excitation efficiency at low excitation power (28). Coherent control on single organic fluorescent probes (Tag–red fluorescent protein and rhodamine B) and semiconductor quantum dot (QD) (CdSe) was also applied to explore fluorescence yield and photobleaching (29).
These abundant studies inspired us in that this principle can be used to control the molecular fluorescence at the single molecular level and eventually benefit super-resolution nanoscopy. Here, we demonstrate this proof-of-principle study of super-resolution nanoscopy by actively controlling (SNAC) individual fluorescent emitters. We use a programmable liquid crystal pulse shaper to produce shaped femtosecond pulses to excite two-photon fluorescence (TPF) for microscopic imaging. By periodically applying a series of SPs for TPF imaging, we effectively enhanced the fluorescent variance between emitters. With a multi-Gaussian (MG) fitting algorithm, the resolution was significantly improved to several tens of nanometers, which is in the range of SMLM. The method is tested with simulations and experiments on films containing gold nanorods (NRs) and ZnCdS QDs and QD-labeled biological structures. To the best of our knowledge, it is the first report on super-resolution nanoscopy based on wide-field multiphoton imaging, which shows high resolution down to ~50 nm. This principle or strategy is generally applicable to single and multiphoton excitation and to various probes for super-resolution nanoscopy. In addition, it can be easily incorporated into other (super-resolution) microscope systems, since it solely modifies the temporal profile of the femtosecond pump pulse.
RESULTS
The SNAC method is simple to set up. In a TPF microscope imaging system, a homebuilt pulse shaper system (see fig. S1) was inserted into the external optical path of the femtosecond excitation pump source, as shown in Fig. 1A. The femtosecond laser beam was from a femtosecond oscillator centered at 800 nm (Rainbow, Femtolasers). The spectrum between 750 and 850 nm was used by the shaper, which turned the original transform-limited femtosecond pulses into SPs. Because of the principle of coherent control, each emitter would produce a unique response to one SP. As demonstrated in Fig. 1B, four fluorescent molecules, which were excited by an SP, present weakened or enhanced fluorescent intensity independently. These independent responses are due to the intrinsic properties of molecules, such as orientation, local environment, geometry, and defects of nanoparticles, among others. To strengthen the different response from these emitters, a series of SPs (e.g., SP1 to SP4 in Fig. 1B) are applied to generate a series of images. Each emitter has its independent response to each SP. Therefore, by comparing any two images, the different responses from neighboring emitters are exposed. The programmed pulse shaping is repeatable, ensuring the repeatable TPF imaging series. This periodical imaging series is collected for further analysis.
Fig. 1. Setup and demonstration of SNAC.
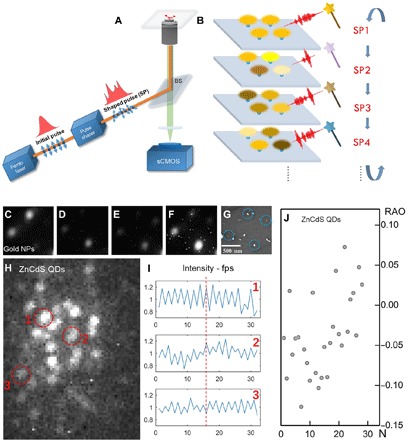
(A) A pulse shaper is inserted into the femtosecond pump beam of a two-photon fluorescence microscope system. (B) Four emitters under a series of SP (SP1, etc.) display independent response (emission intensity) to SPs’ excitation. (C to F) The fluorescence imaging of gold NRs under different SPs. (G) Corresponding position of the gold NR emitters in the film, shown in the SEM image. (H) Fluorescence imaging of ZnCdS quantum dot film. (I) Periodical response of three emitters marked by red dashed circles in (H) under two SPs. fps, frames per second. (J) Particles’ relative amplitude oscillation (RAO); 20% (±10%) of the RAO is obtained under the SNAC modulation.
Sparse gold NRs were used as an example to demonstrate the control on fluorescence. In the experiment, random phase modulations were loaded on the pulse shaper. The beam uniformly illuminated a sample area of ~2 μm in diameter to excite multiple particles simultaneously. Four emissive NRs in Fig. 1 (C to F) present their sensitivity to the SPs. In a scanning electron microscopy (SEM) image (Fig. 1G), the location of each emissive gold NR is marked by a circle. It is clearly shown that the relative fluorescent intensity between the four NRs is modulated by the different SPs.
Unlike the gold NRs, which are asymmetric in shape, the ZnCdS QDs are usually regarded symmetric and identical. However, the small difference among the QDs (fig. S2) provides the possibility to control their fluorescence individually. The fluorescent image of QDs embedded in a PMMA film is shown in Fig. 1H. We use two SPs as a cycle to periodically excite the QD in film. Periodical variations (normalized) of three QDs are shown in Fig. 1I. Their fluorescent variations are independent, which are in-phase with different amplitudes (QD1 and QD2) or are reversed phase (QD3). The signal periodicity is the basis for analysis using fast Fourier transform (FFT) to remove the background noise and quantify the amplitude and phase of modulated emission. Figure 1J shows the relative amplitude of oscillation (RAO; normalized to its own amplitude) of multiple emitters in Fig. 1H. The negative RAOs indicate reversed phase. Most of the RAOs are between −10 and +10%. These RAOs of individual emitters show their different variances under a pair of SP excitation pulses.
The periodical fluorescent modulation is crucial for enhancing the image quality and achieving final improvement in nanoscopic resolution. First, the modulation amplitude and phase are the indication for existence and characteristic response of each QD. Second, the FFT analysis works as a narrow band filter, through which the background random noise is largely removed. Third, the fixed pattern noise from digital imaging sensor, which distorts the profile of fluorescent image and cannot be ruled out by averaging or summing multiple images, is effectively erased. This idea of signal extraction with known carrier frequency (known period) from a highly noisy environment is widely applied in weak signal detection. One example is the lock-in amplifier, which can reliably detect periodical signals even 1 million times smaller than noise.
For only two SPs in a cycle, some emitters may have similar sensitivity (similar RAO in Fig. 1J). To overcome this, the simplest way is to apply multiple SPs in a cycle and recombine them into a series of SP pairs. As illustrated in Fig. 2A, we apply N SPs in one period. Combining any two of SPs as a pair, there are SP pairs. For example, four SPs in one period (Fig. 2B) generate periodically repeated image pairs, and therefore six FFT proceeded images (Fig. 2C). (This combination is highly efficient in data utilization. For example, 10 SPs in one period produce FFT images.) After applying the MG fitting algorithm, the six super-resolution images are resolved, as shown in Fig. 2D. By summing these images, the final SNAC output, showing all emitters and improved localization accuracy, is achieved (Fig. 2E). More detailed discussion about localization accuracy by summing process are mentioned in fig. S3.
Fig. 2. Multiple periodical excitation and image processing.
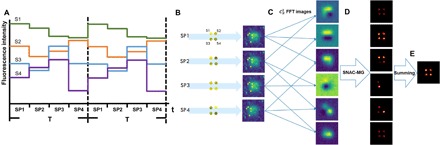
(A) Four adjacent emitters, S1 to S4, are excited by four SPs periodically. (B) Simulated optical images under four SP excitation in one period. (C) The combined images and FFT processed six images. (D) Each FFT image is resolved by MG fitting. (E) Summing of images in (D) to generate final output.
On the basis of the above SNAC-MG procedure, a simulation for resolving closely located emitters is demonstrated in Fig. 3. The fluorescent images of two adjacent emitters separated from 30 to 150 nm are simulated, with a poor background containing random Poisson and fixed pattern noise [signal-to-noise ratio (SNR) = 3; Fig. 3A]. One pixel corresponds to 50 nm, according to the scientific complementary metal-oxide semiconductor (sCMOS) (Andor Zyla 4.2) recorded real images. The fluorescent wavelength is 480 nm, the same as that of the QDs in the latter part of experiments. The emitters have a random brightness fluctuation within ±10% of their average intensity under different SPs. When one period contains 10 SPs and 64 periods (also applied in later simulations), SNAC-MG positioned the two 50-nm emitters apart by 43 nm, which means an error within 15% (Fig. 3B). For comparison with other algorithms, we input the full set of simulated images into SRRF (10), SOFI (9), and Richardson-Lucy (RL) deconvolution (30, 31) super-resolution algorithms. As shown in Fig. 3C, SNAC-MG provides highest accuracy and resolution among all algorithms. Here, we define the resolution as the ability to resolve two adjacent emitters.
Fig. 3. Simulation for resolving adjacent emitters and line structure marked with emitters.
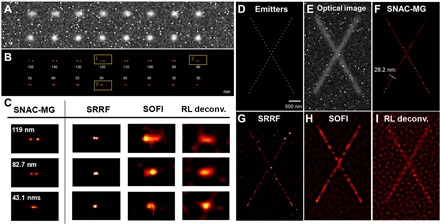
(A) Simulated fluorescent imaging of two adjacent emitters, apart from 30 to 150 nm (pixel = 50 nm, λ_emi = 480 nm). The background includes random Poisson and fixed pattern noise, SNR = 3. (B) Super-resolution image by SNAC-MG. (C) SNAC-MG, SRRF, SOFI, and RL deconvolution algorithms are listed for comparing. The simulation of X-bar cross line shape structure is shown in (D) to (I). (D) Sparse emitters’ position on X-bar. (E) Simulated optical image with pixel = 50 nm, λ_emi = 480 nm, and SNR = 3. (F to I) Super-resolution reconstruction results from SNAC-MG, SRRF, SOFI, and RL deconvolution, respectively.
Continued linear structures are ubiquitous in biological cells. Accurately resolving their spatial layout is an essential task for super-resolution. The structures are usually labeled with dense probes. We simulated an X-bar design labeled with emitters (Fig. 3D). The optical images are generated in Fig. 3E, in which the background and excitation parameters are consistent with Fig. 3A. For the X-bar with the emitters, the position of the emitters can be located precisely by SNAC-MG (Fig. 3F). In this case, SNAC-MG locates the lines down to ~28 nm in position and illustrates the contour profile precisely. The same image set resolved by SRRF, SOFI, and RL deconvolution is demonstrated in Fig. 3 (G to I, respectively). SNAC-MG provides not only the higher localization precision of the emitters but also the cleanest background. Another simulation with dense asymptote probes lined up from 50 to 150 nm is provided in fig. S4. The radial position accuracy proved to be ~30 nm for various densities of emitters, indicating its capability in resolving line structures in optical nanoscopy.
A simulated complex two-dimensional (2D) panda image, containing adjacent points and sophisticated line frameworks (Fig. 4A), is used to verify the resolving capability of SNAC-MG. The corresponding diffraction-limited fluorescent image is shown in Fig. 4B with SNR identical to former simulations. One of the FFT-strengthened images is presented in Fig. 4C. The SNAC-MG super-resolution image is shown in Fig. 4D. The panda’s eye, foot, and navel, marked as areas 1 to 3 in Fig. 4B, are zoomed in and shown in Fig. 4E. SNAC-MG successfully recovers the spatial line position with accuracies of 34.5, 29.5, and 28.6 nm, respectively. The resolved images by other algorithms are also shown in Fig. 4E for comparison. This simulation presents the power of SNAC-MG in dealing with complicated structures. An integral comparison is shown in fig. S5.
Fig. 4. Super-resolution imaging of a 2D panda.
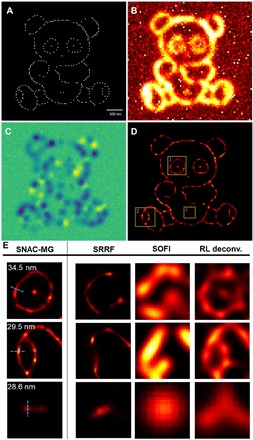
(A) A simulated complex 2D structure containing adjacent points and sophisticated line structures. (B) Optical images are simulated with pixel = 50 nm, λ_emi = 480 nm, and SNR = 3. (C) One of the FFT-strengthened images. (D) Super-resolution reconstruction result of SNAC-MG. (E) Zoomed-in super-resolution image of the panda’s eye, foot, and navel areas in (D) by SNAC-MG, SRRF, SOFI, and RL deconvolution. The positioning accuracy of line structures is marked in SNAC-MG images.
The nanoscopic resolution of the SNAC-MG method is also verified through experiments. The QDs were monodispersed randomly in thin poly(methyl methacrylate) (PMMA) films. In the illuminated area, a number of QDs were excited under four SPs in one period (Fig. 5, A to D) with 32 cycles. It takes 0.5 s to integrate each image. Shorter period and fewer cycles in experiments than the simulations are needed to prevent drifting during the image acquisition process. The SNAC-MG algorithm localizes the particles with high accuracy as shown in Fig. 5E. Two pairs of closely located emitters are analyzed, with results of 97.1 and 86.9 nm, as shown in Fig. 5 (G and H, respectively). For an isolated emitter shown in Fig. 5I, it can be described in a precise location of 36.5 nm and represents the positioning ability of an isolated single emitter. These experimental precisions are consistent with the simulated results shown in figs. S6 and S7.
Fig. 5. SNAC-MG reconstruction for PMMA-QD films.
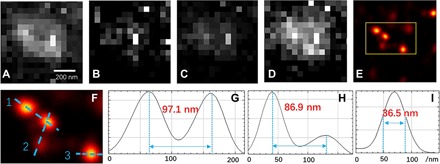
(A to D) Optical images of a PMMA-QD film pumped with four SPs in a period. (E) Reconstructed image based on SNAC-MG. (F) Zoomed-in image of the yellow box in (E). Three blue dashed lines mark two adjacent points for analysis. (G to I) Profile of nos. 1, 2, and 3 dashed lines in (F), respectively.
The line structures in COS7 cells, labeled by QD625 QDs, are studied to demonstrate the radial resolution of the SNAC-MG method. A fluorescent image of the reticular vascular structure of a cell is shown in Fig. 6A. The red and blue square marked areas are reconstructed by SNAC-MG (Fig. 6, C and I). The fluorescence of QD labels can be effectively controlled with 10 SPs for 64 cycles. For Fig. 6C inset, the morphology of many parallel tubes within the diffraction limit can be reconstructed with their location precisely resolved with a distance from 31.1 to 44.6 nm. For Fig 6I, two peaks can still be recognized in the fiber intersect area with a distance of 95.3 nm. The above results coincided with the simulation. Wide-field, MG, SRRF, SOFI, and RL deconvolution algorithms are also provided for comparison (Fig. 6, B, D–H, J–M).
Fig. 6. Data of COS7-QD625–labeled cell of SNAC reconstruction.
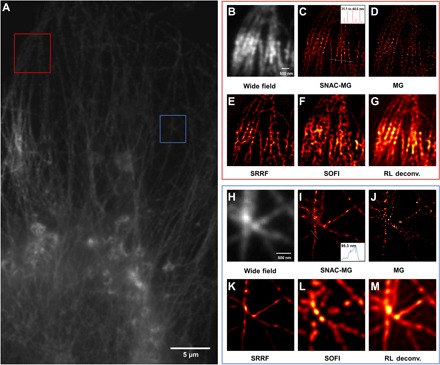
(A) One-photon fluorescence image of a reticular vascular part of COS7 cells labeled by QD625. (B and H) Two-photon excited fluorescence images in wide field for red and blue marked areas in (A). (C to G and I to M) The super-resolution reconstruction results of the marked box parts in (A) of SNAC-MG, MG, SOFI, and RL deconvolution. The Full Width Half Maximum (FWHM) of five lines in the inset of (C) is 31.8, 32.1, 31.1, 44.6, and 39.0 nm, from left to right. The peak distance in the inset of (I) is 95.3 nm.
DISCUSSION
Previous fluorescence super-resolution techniques take advantage of the fluorescent characteristics of the emitters, such as molecular photoswitching, blinking, and polarization properties. Quantum coherent control, as a new dimension of manipulation on molecular fluorescence, is a principal innovation to achieve super-resolution. It actively controls the excitation of fluorescent molecules, which is different from uncontrollable stochastic photobleaching and blinking. As a general principle, it is applicable to various probe systems, including dye markers, fluorescent proteins, and nanoparticles, to name a few. This report verified the application on two-photon excitation, which has low photodamage possibility and potential for deep imaging. In principle, and from reports, it is also applicable to single-photon excitation. In addition, the technique modifies only the temporal profile of the femtosecond pump pulse. The pulse shaper itself could be a black box, which can be inserted into the pump beam without interfering with any other optics in the path. This makes it easy to be incorporated into other microscope systems, or even other super-resolution systems. This method obtains the active response of the fluorescent probes and can easily eliminate the interference of noise, including the fixed pattern noise of sCMOS and the random noise, which do not follow the periodical excitation.
In the experimental demonstration, we show its nanoscopic high-resolution capability. The positioning accuracy reaches ~30 nm for linear structure and ~50 nm for two adjacent emitters. The resolution of mainstream super-resolution methods can be briefly classified into two categories (32). The following wide-field imaging methods have limited resolution: SOFI(SRRF)/SOFI/JT-SOFI (~70/~100/85 nm) (9, 33), (S)SIM (~50/100 nm) (34, 35), and SPoD/SDOM (Super-resolution Dipole Orientation Mapping) (~130 nm) (11, 12). Another group is the conceptually diffraction-unlimited methods, such as (F)PALM/STORM (10 to 40 nm) (36) and STED (20 to 70 nm) (37). SNAC is a method based on wide-field imaging that advances the resolution into the range of the conceptually diffraction-unlimited method. We summarize the resolutions of various super-resolution methods and our contribution in fig. S9.
In application, data acquisition efficiency is an important index for real-time imaging. The (F)PALM/STORM requires a long integration time (seconds to minutes) and a number of cycles (100 to 1000) to complete the acquisition (2 to 12 hours) (4) because of the manipulation of the photoswitching and the photobleaching process. The SOFI and STED methods also require 1000 to 10000 frames (9, 38) of data to traverse all fluorophores. SNAC is a flexible acquisition method. We verified that to resolve two adjacent emitters, the SNAC method can choose to lower resolution with higher efficiency (~70 nm, 128 frames) or higher resolution with longer time (~50 nm, 640 frames). However, we also proved that the line structure can be well located to ~30 nm even with only 128 frames (Fig. 6, B and F). We also demonstrate the time efficiency in fig. S9.
CONCLUSION
Here, we introduce a new method, SNAC, for controlling and periodically modulating the fluorescent emission of individual emitters for super-resolution nanoscopy. This pure optical method is based on the principle of quantum coherent control and femtosecond pulse shaping technique. In a TPF microscope imaging system, we insert a pulse shaper into the femtosecond excitation beam. With designed periodical modulation and the FFT filtering, the background noise is eliminated greatly and the fluorescent signal variance is effectively extracted. Improved output is achieved compared to other wide-field methods, e.g., SOFI, SRRF, and RL deconvolution, by direct comparison. The precise locations of twin emitters can be well resolved down to ~50 nm in simulation by MG algorithm. For a complex structure labeled with dense emitters, SNAC shows a significant improvement in resolution; e.g., in the simulated structure of a panda, SNAC-MG successfully restores the precise location of lines and isolated emitters. The resolution was also certified in experiments on the films embedded with QDs and COS7 cells labeled with QDs. For the reticular vascular structure of a cell, the array of parallel tubes within the diffraction limit can be clearly reconstructed with localization accuracy ~30 nm. Two peaks can be recognized at the fiber intersect area with a distance of 95.3 nm. These resolutions are among or beyond the highest resolution in wide-field nanoscopic imaging. It pushes the resolution of wide-field super-resolution imaging into the range of SMLM techniques.
The femtosecond pulsed laser not only has a very strong instantaneous power due to the short pulse duration but also ensures the low average power in time, which benefits two-photon imaging on living tissue. The femtosecond pulse shaping system can be conveniently inserted as a black box into the pump beam path of an imaging system. It provides periodical modulation to the emitters to isolate their emission with the background random and fixed pattern noise. This setup, working together with MG algorithm, converts a normal fluorescent microscope into a nanoscopic system for resolving structures at several tens of nanometers. For those super-resolution ready systems, SNAC may also be compatible and provides another controlling dimension to enhance their resolution or efficiency. The first time that the resolution has been improved is by SNAC, through modulating SPs and coherently controlling the emission of probes. However, the precise experimental proof on its nanoscopic resolution enhancement is not sufficient in this contribution and remains the subject of future studies. In addition, the advanced algorithms are also expected to further improve the resolution and efficiency. It is also expected that this principle and technique could be applied in various (super-resolution) microscopic imaging systems.
MATERIALS AND METHODS
Generation of simulated data
The simulated data were generated with Python using a point spread function with Gaussian intensity profile (λ_emi = 480 nm, pixel size = 50 nm). The simulated image of each structure was in total 201 × 201 pixels. First, we randomly generate Poisson noise with a mean intensity of 40 in each frame. Then, the same fixed pattern noise is loaded on each image, which is generated from the statistical results of the sCMOS pure noise collected in experiment. For each emitter in designed structures, the intensity of their signal varies periodically for 32 and 64 cycles, and the intensity variation of each emitter was guaranteed to be within 20% of the mean (mean intensity = 120, SNR = peak value of signal intensity/mean value of background noise = 3), which is the same 20% of RAO as the experiment.
Algorithm processing
For the active control of the QDs system, three potentially suitable algorithms have been studied for comparison and verification with SNAC-MG. All the generated simulated data or acquisition experimental data are sequentially input into the SRRF, SOFI, and RL deconvolution algorithm without adding an intermediate process. The main idea of this SNAC-MG method is to input FFT images extracted from periodic sequence frames into the MG fitting algorithm. The number of Gaussian signals injected with positive or negative amplitudes are continuously increased in the region of interest of each preprocessed image until the result converges steadily. Last, the results obtained from these FFT images are statistically superimposed to get the final super-resolution image. The SRRF algorithm plugin for ImageJ and the SOFI algorithm source codes are provided in (9, 30). We wrote the RL deconvolution algorithm consulting (31, 32).
Sample preparation
Gold NR films
They were deposited on treated glass by evaporation at room temperature. The glass slices are processed by plasma (75 W, 10 min) after the cleaning of ultrapure water, acetone, and alcohol. Aqueous solution [(0.08 weight % (wt %)] of polyvinyl alcohol was prepared, and the concentrated gold NR solution was mixed to it with the same amount. The mixed solution (100 μl) was dripped on the glass plate and evaporated for hours, and then the samples were obtained.
ZnCdS QD films
They were deposited on clean glass by spin coating. First, the PMMA-chloroform solution of 2 wt % was prepared, and then the polymer solution was mixed with QD solution (10 μl/mol; chloroform solvent) at a 300:1 volume ratio. The mixed solution (100 μl) was dripped on the glass plate with spin-coating at 3000 rpm for 1 min.
Immunostaining of microtubules in COS7 cells
COS7 cells were cultured on glass slides for 24 hours. COS7 cells were cultured on glass slides for 24 hours. For immunostaining, cells were washed three times with phosphate-buffered saline (PBS) buffer [137 2.7 mM NaCl, 2.7 mM KCl, 10 mM Na2HPO4·12 H2O, and 1.76 mM KH2PO4 (pH 7.4)]. After that, cells were extracted in PEM [0.1 M Pipes, 1 mM EGTA, and 1 mM MgCl2 (pH 7)] buffer with 0.2% v/v Triton X-100 for 2 min. Fixation was followed with 4% paraformaldehyde (PFA) (in PBS; Electron Microscopy Science) with 0.1% glutaraldehyde for 10 min at 37°C. Then, the cells were treated with 1 mg/ml NaBH4 for 5 min and washed with PBS. After that, cells were blocked and permeabilized by 5% bovine serum albumin (Jackson ImmunoResearch Laboratories) with 0.5% v/v Triton X-100 in PBS for 30 min at room temperature. Primary antibody with biotin against α-tubulin was diluted to 10 μg/μl in blocking buffer and incubated with cells for 1 hour at room temperature. Then, the cells were washed three times with PBS, 10 min each. After that, cells were stained by QD streptavidin conjugates (Invitrogen) with emission peak at 625 nm, and the QDs were diluted to 15 nM in blocking buffer. After secondary staining, cells were washed three times with PBS, 10 min each, and fixed in 4% PFA (in PBS; Electron Microscopy Science) with 0.1% glutaraldehyde for 10 min at 37°C. Then, cells were washed and mounted with 50% glycerin.
Supplementary Material
Acknowledgments
We thank P. Xi and H. Zhang for inspirational discussion. Funding: This work was supported by the National Key Research and Development Program nos. 2016YFB0401003 and 2017YFA0504702 and the National Natural Science Foundation of China under grant nos. 91750203, 11527901, 11874074, 61775004, 61575005, 11574009, 31421002, U1611261, U1611263, and U1605244. Author contributions: C.L. performed most of the optical setup, the simulation, super-resolution experiments, and manuscript preparation. W.L. works in programming, simulation, and imaging analysis. S.W. proposed the original idea and directly led the research. H.L., Z.L., and F.Z. guided the simulation and compared the algorithms. D.Z., J.T., and T.Z. prepared QD-labeled cells for study. D.L. initialized the pulse shaper system and the two-photon microscope system. M.Z. and P.X. guided the discussion on super-resolution on biological structures. Q.G. directed the overall project. Competing interests: The authors declare that they have no competing interests. Data and materials availability: All data needed to evaluate the conclusions in the paper are present in the paper and/or the Supplementary Materials. Additional data related to this paper may be requested from the authors.
SUPPLEMENTARY MATERIALS
Supplementary material for this article is available at http://advances.sciencemag.org/cgi/content/full/6/16/eaaw6579/DC1
REFERENCES AND NOTES
- 1.Hell S. W., Wichmann J., Breaking the diffraction resolution limit by stimulated emission: Stimulated-emission-depletion fluorescence microscopy. Opt. Lett. 19, 780–782 (1994). [DOI] [PubMed] [Google Scholar]
- 2.Klar T. A., Hell S. W., Subdiffraction resolution in far-field fluorescence microscopy. Opt. Lett. 24, 954–956 (1999). [DOI] [PubMed] [Google Scholar]
- 3.Hess S. T., Girirajan T. P. K., Mason M. D., Ultra-high resolution imaging by fluorescence photoactivation localization microscopy. Biophys. J. 91, 4258–4272 (2006). [DOI] [PMC free article] [PubMed] [Google Scholar]
- 4.Betzig E., Patterson G. H., Sougrat R., Lindwasser O. W., Olenych S., Bonifacino J. S., Davidson M. W., Lippincott-Schwartz J., Hess H. F., Imaging intracellular fluorescent proteins at nanometer resolution. Science 313, 1642–1645 (2006). [DOI] [PubMed] [Google Scholar]
- 5.Rust M. J., Bates M., Zhuang X., Sub-diffraction-limit imaging by stochastic optical reconstruction microscopy (STORM). Nat. Methods 3, 793–796 (2006). [DOI] [PMC free article] [PubMed] [Google Scholar]
- 6.Balzarotti F., Eilers Y., Gwosch K. C., Gynnå A. H., Westphal V., Stefani F. D., Elf J., Hell S. W., Nanometer resolution imaging and tracking of fluorescent molecules with minimal photon fluxes. Science 355, 606–612 (2017). [DOI] [PubMed] [Google Scholar]
- 7.Gustafsson M. G. L., Nonlinear structured-illumination microscopy: Wide-field fluorescence imaging with theoretically unlimited resolution. Proc. Natl. Acad. Sci. U.S.A. 102, 13081–13086 (2005). [DOI] [PMC free article] [PubMed] [Google Scholar]
- 8.Rego E. H., Shao L., Macklin J. J., Winoto L., Johansson G. A., Kamps-Hughes N., Davidson M. W., Gustafsson M. G. L., Nonlinear structured-illumination microscopy with a photoswitchable protein reveals cellular structures at 50-nm resolution. Proc. Natl. Acad. Sci. U.S.A. 109, E135–E143 (2012). [DOI] [PMC free article] [PubMed] [Google Scholar]
- 9.Dertinger T., Colyer R., Iyer G., Weiss S., Enderlein J., Fast, background-free, 3D super-resolution optical fluctuation imaging (SOFI). Proc. Natl. Acad. Sci. U.S.A. 106, 22287–22292 (2009). [DOI] [PMC free article] [PubMed] [Google Scholar]
- 10.Nils G., Culley S., Ashdown G., Owen D. M., Pereira P. M., Henriques R., Fast live-cell conventional fluorophore nanoscopy with ImageJ through super-resolution radial fluctuations. Nat. Commun. 7, 12471 (2016). [DOI] [PMC free article] [PubMed] [Google Scholar]
- 11.Hafi N., Grunwald M., van den Heuvel L. S., Aspelmeier T., Chen J.-H., Zagrebelsky M., Schütte O. M., Steinem C., Korte M., Munk A., Walla P. J., Fluorescence nanoscopy by polarization modulation and polarization angle narrowing. Nat. Methods 11, 579–584 (2014). [DOI] [PubMed] [Google Scholar]
- 12.Zhanghao K., Chen L., Yang X.-S., Wang M.-Y., Jing Z.-L., Han H.-B., Zhang M. Q., Jin D., Gao J.-T., Xi P., Super-resolution dipole orientation mapping via polarization demodulation. Light-Sci. Appl. 5, e16166–e16166 (2016). [DOI] [PMC free article] [PubMed] [Google Scholar]
- 13.Weiner A. M., Femtosecond pulse shaping using spatial light modulators. Rev. Sci. Instrum. 71, 1929–1960 (2000). [Google Scholar]
- 14.Weiner A. M., Ultrafast optical pulse shaping: A tutorial review. Opt. Commun. 284, 3669–3692 (2011). [Google Scholar]
- 15.Brif C., Chakrabarti R., Rabitz H., Control of quantum phenomena: Past, present and future. New J. Phys. 12, 075008 (2010). [Google Scholar]
- 16.Dantus M., Lozovoy V. V., Experimental coherent laser control of physicochemical processes. Chem. Rev. 104, 1813–1859 (2004). [DOI] [PubMed] [Google Scholar]
- 17.Rabitz H., de Vivie-Riedle R., Motzkus M., Kompa K., Whither the future of controlling quantum phenomena? Science 288, 824–828 (2000). [DOI] [PubMed] [Google Scholar]
- 18.Bardeen C. J., Yakovlev V. V., Squier J. A., Wilson K. R., Quantum control of population transfer in green fluorescent protein by using chirped femtosecond pulses. J. Am. Chem. Soc. 120, 13023–13027 (1998). [Google Scholar]
- 19.Herek J. L., Wohlleben W., Cogdell R. J., Zeidler D., Motzkus M., Quantum control of energy flow in light harvesting. Nature 417, 533–535 (2002). [DOI] [PubMed] [Google Scholar]
- 20.Nagy A. M., Brown L. S., Miller R. J. D., Prokhorenko V. I., Experimental coherent control of retinal isomerization in bacteriorhodopsin. Science 313, 1257–1261 (2006). [DOI] [PubMed] [Google Scholar]
- 21.Kuroda D. G., Singh C. P., Peng Z., Kleiman V. D., Mapping excited-state dynamics by coherent control of a dendrimer's photoemission efficiency. Science 326, 263–267 (2009). [DOI] [PubMed] [Google Scholar]
- 22.Oron D., Dudovich N., Silberberg Y., Femtosecond phase-and-polarization control for background-free coherent anti-Stokes Raman spectroscopy. Phys. Rev. Lett. 90, 213902 (2003). [DOI] [PubMed] [Google Scholar]
- 23.Silberberg Y., Quantum coherent control for nonlinear spectroscopy and microscopy. Annu. Rev. Phys. Chem. 60, 277–292 (2009). [DOI] [PubMed] [Google Scholar]
- 24.Savolainen J., Fanciulli R., Dijkhuizen N., Moore A. L., Hauer J., Buckup T., Motzkus M., Herek J. L., Controlling the efficiency of an artificial light-harvesting complex. Proc. Natl. Acad. Sci. U.S.A. 105, 7641–7646 (2008). [DOI] [PMC free article] [PubMed] [Google Scholar]
- 25.Walowicz K. A., Pastirk I., Lozovoy V. V., Dantus M., Multiphoton intrapulse interference. 1. control of multiphoton processes in condensed phases. J. Phys. Chem. A. 106, 9369–9373 (2002). [Google Scholar]
- 26.Brinks D., Stefani F. D., Kulzer F., Hildner R., Taminiau T. H., Avlasevich Y., Müllen K., van Hulst N. F., Visualizing and controlling vibrational wave packets of single molecules. Nature 465, 905–908 (2010). [DOI] [PubMed] [Google Scholar]
- 27.Hildner R., Brinks D., Nieder J. B., Cogdell R. J., van Hulst N. F., Quantum coherent energy transfer over varying pathways in single light-harvesting complexes. Science 340, 1448–1451 (2013). [DOI] [PubMed] [Google Scholar]
- 28.Tkaczyk E. R., Mauring K., Tkaczyk A. H., Krasnenko V., Ye J. Y., Baker J. R. Jr., Norris T. B., Control of the blue fluorescent protein with advanced evolutionary pulse shaping. Biochem. Biophys. Res. Commun. 376, 733–737 (2008). [DOI] [PMC free article] [PubMed] [Google Scholar]
- 29.Field J. J., Carriles R., Sheetz K. E., Chandler E. V., Hoover E. E., Tillo S. E., Hughes T. E., Sylvester A. W., Kleinfeld D., Squier J. A., Optimizing the fluorescent yield in two-photon laser scanning microscopy with dispersion compensation. Opt. Express 18, 13661–13672 (2010). [DOI] [PMC free article] [PubMed] [Google Scholar]
- 30.Richardson W. H., Bayesian-based iterative method of image restoration. J. Opt. Soc. A. 62, 55–59 (1972). [Google Scholar]
- 31.Lucy L. B., An iterative technique for the rectification of observed distributions. J. Astron. 79, 745 (1974). [Google Scholar]
- 32.Sahl S. J., Hell S. W., Jakobs S., Fluorescence nanoscopy in cell biology. Nat. Rev. Mol. Cell Biol. 18, 685–701 (2017). [DOI] [PubMed] [Google Scholar]
- 33.Zeng Z., Chen X., Wang H., Huang N., Shan C., Zhang H., Teng J., Xi P., Fast super-resolution imaging with ultra-high labeling density achieved by joint tagging super-resolution optical fluctuation imaging. Sci. Rep. 5, 8359 (2015). [DOI] [PMC free article] [PubMed] [Google Scholar]
- 34.Sahl S. J., Balzarotti F., Keller-Findeisen J., Leutenegger M., Westphal V., Egner A., Lavoie-Cardinal F., Chmyrov A., Grotjohann T., Jakobs S., Comment on "Extended-resolution structured illumination imaging of endocytic and cytoskeletal dynamics". Science 352, 527 (2016). [DOI] [PubMed] [Google Scholar]
- 35.Kner P., Chhun B. B., Griffis E. R., Winoto L., Gustafsson M. G. L., Super-resolution video microscopy of live cells by structured illumination. Nat. Methods 6, 339–342 (2009). [DOI] [PMC free article] [PubMed] [Google Scholar]
- 36.Xu K., Babcock H. P., Zhuang X., Dual-objective STORM reveals three-dimensional filament organization in the actin cytoskeleton. Nat. Methods 9, 185–188 (2012). [DOI] [PMC free article] [PubMed] [Google Scholar]
- 37.Bückers J., Wildanger D., Vicidomini G., Kastrup L., Hell S. W., Simultaneous multi-lifetime multi-color STED imaging for colocalization analyses. Opt. Express 19, 3130–3143 (2011). [DOI] [PubMed] [Google Scholar]
- 38.Wegel E., Göhler A., Lagerholm B. C., Wainman A., Uphoff S., Kaufmann R., Dobbie I. M., Imaging cellular structures in super-resolution with SIM, STED and localisation microscopy: A practical comparison. Sci. Rep. 6, 27290 (2016). [DOI] [PMC free article] [PubMed] [Google Scholar]
Associated Data
This section collects any data citations, data availability statements, or supplementary materials included in this article.
Supplementary Materials
Supplementary material for this article is available at http://advances.sciencemag.org/cgi/content/full/6/16/eaaw6579/DC1