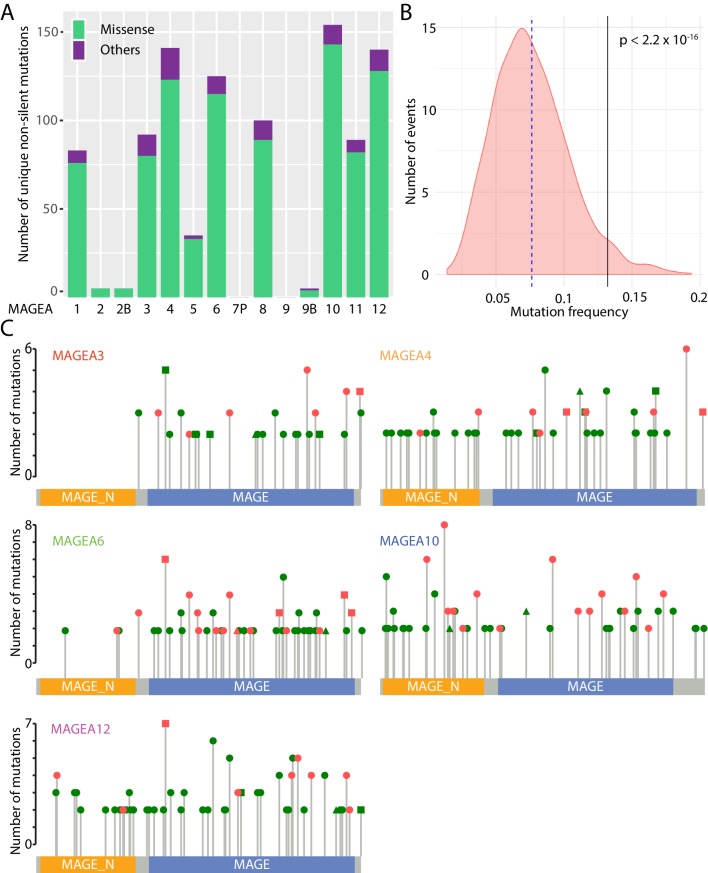
Figure 1. Mutational landscape of MAGEA genes in pan-cancer study.
(A) Histogram of missense mutations and others (nonsense, frameshift, in-frame indels, and splice site mutations) across the entire MAGEA family. (B) Mutation frequency analysis of MAGEA genes. Pink area represents the mutation frequency distribution of 1000 randomly selected genes with sizes similar to MAGEA genes. Blue dotted line and black line indicate the mean mutation frequency of the 1000 genes and the MAGEA gene respectively. P value was calculated by a one-sample Wilcoxon test. (C) Lollipop diagrams indicate the distribution and number of recurrent mutations in individual MAGEA genes. Reported amino acid changes: missense mutations (dot), others (triangle), and both (square) are marked in pink for those selected for immunoblot analysis in Figure 2.

